Technology
Wired World: 35 Years of Submarine Cables in One Map
You could be reading this article from nearly anywhere in the world and there’s a good chance it loaded in mere seconds.
Long gone are the days when images would load pixel row by pixel row. Now, even high-quality video is instantly accessible from almost everywhere. How did the internet get so fast? Because it’s moving at the speed of light.
The Information Superhighway
The miracle of modern fiber optics can be traced to a single man, Narinder Singh Kapany. The young physicist was skeptical when his professors asserted that light ‘always travels in a straight line’. His explorations into the behavior of light eventually led to the creation of fiber optics—essentially, beaming light through a thin glass tube.
The next step to using fiber optics as a means of communication was lowering the cable’s attenuation rate. Throughout the 1960-70s, companies made gains in manufacturing, reducing the number of impurities and allowing light to cross great distances without a dramatic decrease in signal intensity.
By the mid-1980s, long distance fiber optic cables had finally reached the feasibility stage.
Crossing the Pond
The first intercontinental fiber optic cable was strung across the floor of the Atlantic Ocean in 1988. The cable—known as TAT-8*—was spearheaded by three companies; AT&T, France Télécom, and British Telecom. The cable was able to carry the equivalent of 40,000 telephone channels, a ten-fold increase over its galvanic predecessor, TAT-7.
Once the kinks of the new cable were worked out, the floodgates were open. During the course of the 1990s, many more cables hit the ocean floor. By the dawn of the new millennium, every populated continent on Earth was connected by fiber optic cables. The physical network of the internet was beginning to take shape.
As today’s video from ESRI shows, the early 2000s saw a boom in undersea cable development, reflecting the uptick in internet usage around globe. In 2001 alone, eight new cables connected North America and Europe.
From 2016-2020, over 100 new cables were laid with an estimated value of $14 billion. Now, even the most remote Polynesian islands have access to high-speed internet thanks to undersea cables.
*TAT-8 does not appear in the video above as it was retired in 2002.
The Shifting Nature of Cable Construction
Even though nearly every corner of the globe is now physically connected, the rate of cable construction is not slowing down.
This is due to the increasing capacity of new cables and our appetite for high-quality video content. New cables are so efficient that the majority of potential capacity along major cable routes will come from cables that are less than five years old.
Traditionally, a consortium of telecom companies or governments would fund cable construction, but tech companies are increasingly funding their own submarine cable networks.
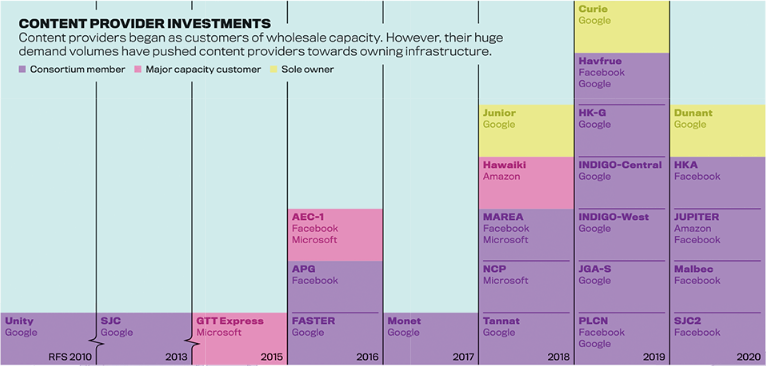
Amazon, Microsoft and Google own close to 65% market share in cloud data storage, so it’s understandable that they’d want to control the physical means of transporting that data as well.
These three companies now own 63,605 miles of submarine cable. While laying cable is a costly endeavor, it’s necessary to meet surging demand—content providers’ share of data transmission skyrocketed from around 8% to nearly 40% over the past decade.
A Bright Future for Dark Fiber
At the same time, more aging cables will be taken offline. Even though signals are no longer traveling through this network of “dark fiber”, it’s still being put to productive use. It turns out that undersea telecom cables make a very effective seismic network, helping researchers study offshore earthquakes and the geologic structures on the ocean floor.


Technology
All of the Grants Given by the U.S. CHIPS Act
Intel, TSMC, and more have received billions in subsidies from the U.S. CHIPS Act in 2024.


All of the Grants Given by the U.S. CHIPS Act
This was originally posted on our Voronoi app. Download the app for free on iOS or Android and discover incredible data-driven charts from a variety of trusted sources.
This visualization shows which companies are receiving grants from the U.S. CHIPS Act, as of April 25, 2024. The CHIPS Act is a federal statute signed into law by President Joe Biden that authorizes $280 billion in new funding to boost domestic research and manufacturing of semiconductors.
The grant amounts visualized in this graphic are intended to accelerate the production of semiconductor fabrication plants (fabs) across the United States.
Data and Company Highlights
The figures we used to create this graphic were collected from a variety of public news sources. The Semiconductor Industry Association (SIA) also maintains a tracker for CHIPS Act recipients, though at the time of writing it does not have the latest details for Micron.
| Company | Federal Grant Amount | Anticipated Investment From Company |
|---|---|---|
| 🇺🇸 Intel | $8,500,000,000 | $100,000,000,000 |
| 🇹🇼 TSMC | $6,600,000,000 | $65,000,000,000 |
| 🇰🇷 Samsung | $6,400,000,000 | $45,000,000,000 |
| 🇺🇸 Micron | $6,100,000,000 | $50,000,000,000 |
| 🇺🇸 GlobalFoundries | $1,500,000,000 | $12,000,000,000 |
| 🇺🇸 Microchip | $162,000,000 | N/A |
| 🇬🇧 BAE Systems | $35,000,000 | N/A |
BAE Systems was not included in the graphic due to size limitations
Intel’s Massive Plans
Intel is receiving the largest share of the pie, with $8.5 billion in grants (plus an additional $11 billion in government loans). This grant accounts for 22% of the CHIPS Act’s total subsidies for chip production.
From Intel’s side, the company is expected to invest $100 billion to construct new fabs in Arizona and Ohio, while modernizing and/or expanding existing fabs in Oregon and New Mexico. Intel could also claim another $25 billion in credits through the U.S. Treasury Department’s Investment Tax Credit.
TSMC Expands its U.S. Presence
TSMC, the world’s largest semiconductor foundry company, is receiving a hefty $6.6 billion to construct a new chip plant with three fabs in Arizona. The Taiwanese chipmaker is expected to invest $65 billion into the project.
The plant’s first fab will be up and running in the first half of 2025, leveraging 4 nm (nanometer) technology. According to TrendForce, the other fabs will produce chips on more advanced 3 nm and 2 nm processes.
The Latest Grant Goes to Micron
Micron, the only U.S.-based manufacturer of memory chips, is set to receive $6.1 billion in grants to support its plans of investing $50 billion through 2030. This investment will be used to construct new fabs in Idaho and New York.

-

 Education1 week ago
How Hard Is It to Get Into an Ivy League School?
-

 Technology2 weeks ago
Ranked: Semiconductor Companies by Industry Revenue Share
-

 Markets2 weeks ago
Ranked: The World’s Top Flight Routes, by Revenue
-

 Demographics2 weeks ago
Population Projections: The World’s 6 Largest Countries in 2075
-

 Markets2 weeks ago
The Top 10 States by Real GDP Growth in 2023
-

 Demographics2 weeks ago
The Smallest Gender Wage Gaps in OECD Countries
-

 Economy2 weeks ago
Where U.S. Inflation Hit the Hardest in March 2024
-

 Environment2 weeks ago
Top Countries By Forest Growth Since 2001