Misc
Ranked: Biggest Fast Food Chains in America
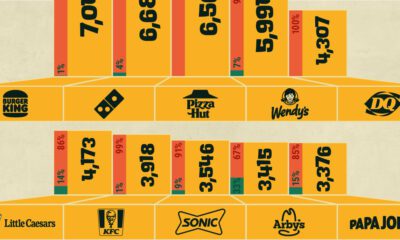
Ranked: The Biggest Fast Food Chains in America
Fast food is a supersized business in America.
The average American spends as much as $1,200 every year on fast food — and roughly a quarter of the U.S. population eats three or more fast food meals per week.
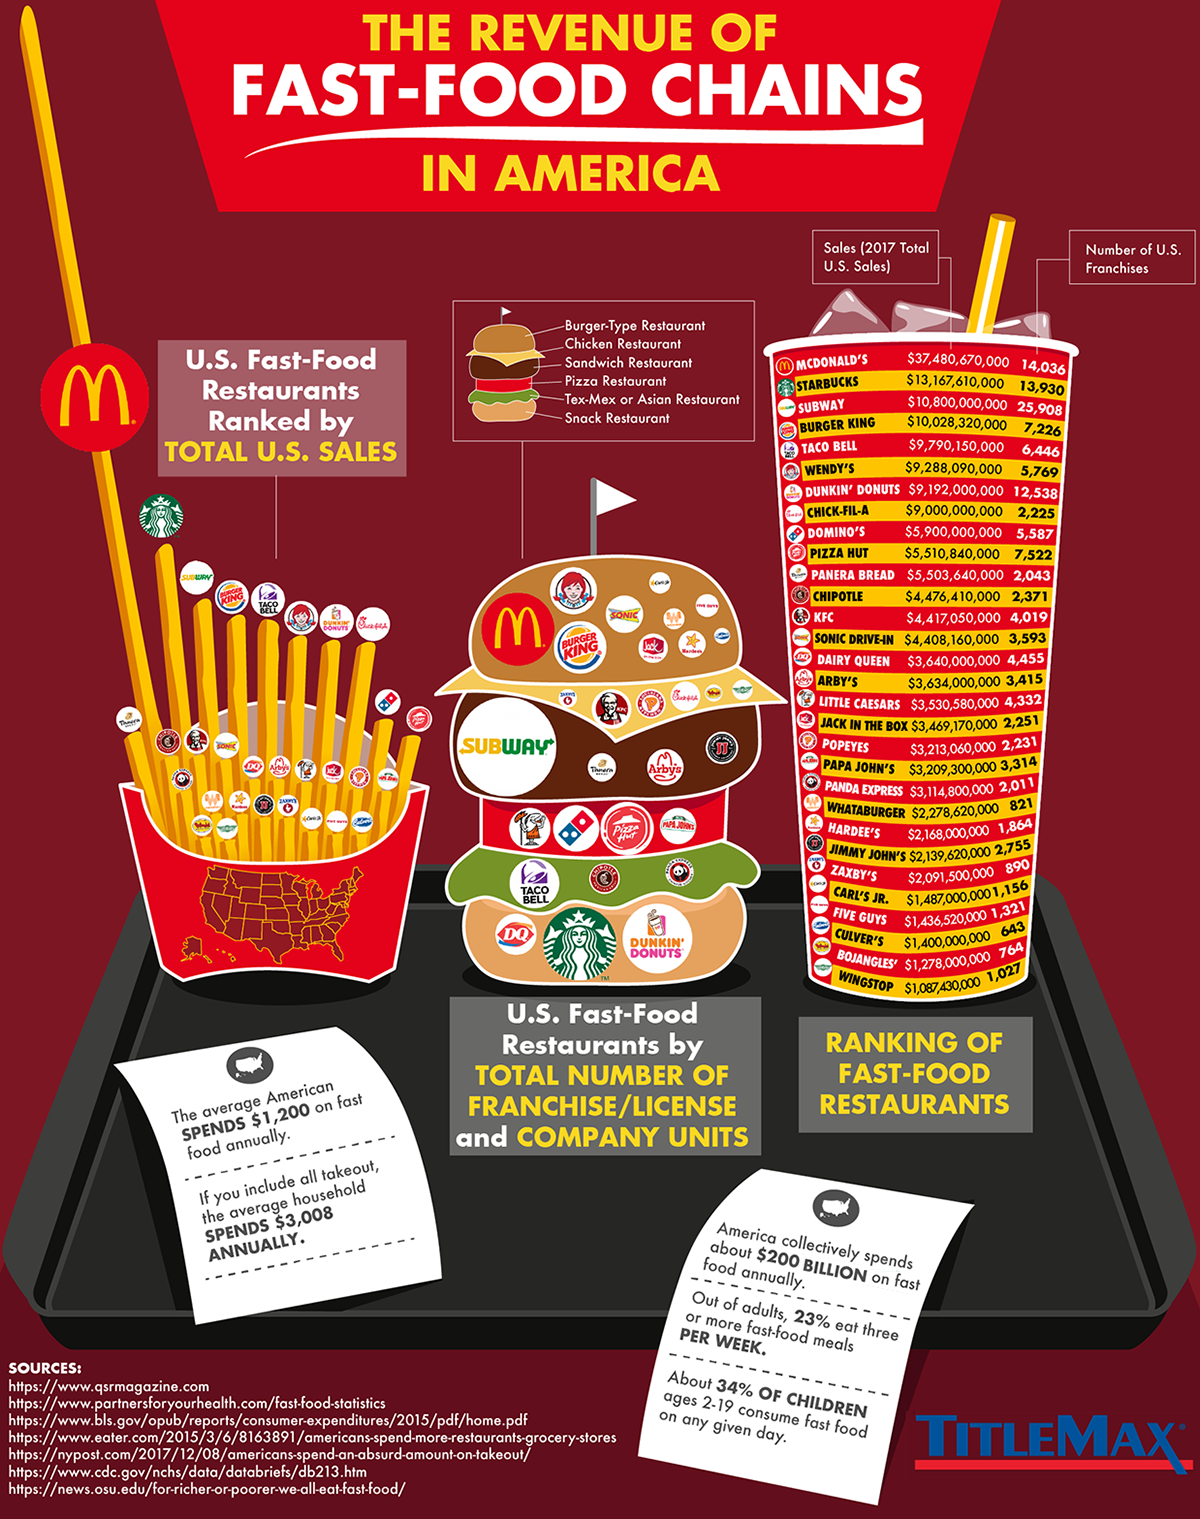
Today’s unique infographic, via TitleMax, shows just how dominant the quick serve food industry is, and which brands are leading the pack in terms of revenue and store locations.
Billions Served
All of the biggest fast food chains now top $1 billion in sales annually. McDonald’s leads the pack with almost triple the sales of the number two chain, Starbucks.
Below are the top 30 fast food chains in the United States by revenue:
| Rank | Chain | Sales (U.S., 2017) | # of Locations (U.S.) |
|---|---|---|---|
| 1 | McDonald's | $37.5B | 14,036 |
| 2 | Starbucks | $13.2B | 13,930 |
| 3 | Subway | $10.8B | 25,908 |
| 4 | Burger King | $9.8B | 7,226 |
| 5 | Taco Bell | $9.3B | 6,446 |
| 6 | Wendy's | $9.3B | 5,769 |
| 7 | Dunkin' Donuts | $5.9B | 12,538 |
| 8 | Chick-fil-A | $9.0B | 2,225 |
| 9 | Domino's | $5.9B | 5,587 |
| 10 | Pizza Hut | $5.5B | 7,522 |
| 11 | Panera Bread | $4.5B | 2,043 |
| 12 | Chipotle | $4.5B | 2,371 |
| 13 | KFC | $4.4B | 4,019 |
| 14 | Sonic Drive-In | $4.4B | 3,593 |
| 15 | Dairy Queen | $3.6B | 4,455 |
| 16 | Arby's | $3.6B | 3,415 |
| 17 | Little Caesars | $3.5B | 4,332 |
| 18 | Jack in the Box | $3.5B | 2,251 |
| 19 | Popeye's | $3.2B | 2,231 |
| 20 | Papa John's | $3.1B | 3,314 |
| 21 | Panda Express | $2.3B | 2,011 |
| 22 | Whataburger | $2.3B | 821 |
| 23 | Hardee's | $2.2B | 1,864 |
| 24 | Jimmy John's | $2.1B | 2,755 |
| 25 | Zaxby's | $2.1B | 890 |
| 26 | Carl's Jr. | $1.5B | 1,156 |
| 27 | Five Guys | $1.4B | 1,321 |
| 28 | Culver's | $1.4B | 643 |
| 29 | Bojangles' | $1.3B | 764 |
| 30 | Wingstop | $1.1B | 1,027 |
In 2017, the top 30 fast food chains rang up $172 billion in sales at over 140,000 locations across the United States. When smaller chains are also included, annual industry revenue tops a whopping $200 billion.
Location, Location
Fast food can be a profitable business, but certain chains are runaway successes when sales-per-unit are considered. Chick-fil-A’s sales average out to $4.3 million per location — 53% higher than McDonald’s, which brings in $2.8 million of sales per location.
Subway, which is known for having a low franchise fee and no exclusive territory rights, has the lowest sales-per-unit in the top 30 ($419,792).
That said, no one can compare to Subway in terms of sheer volume. The chain has over 25,000 locations, making it not only the biggest fast food chain in the country, but the most common retailer overall (even beating out dollar stores). It’s possible that America has seen peak Subway though — the number of locations has been steadily dropping since 2011.
On the opposite end of the spectrum is Starbucks. The Seattle-based coffee chain has been relentlessly expanding over the past decade.
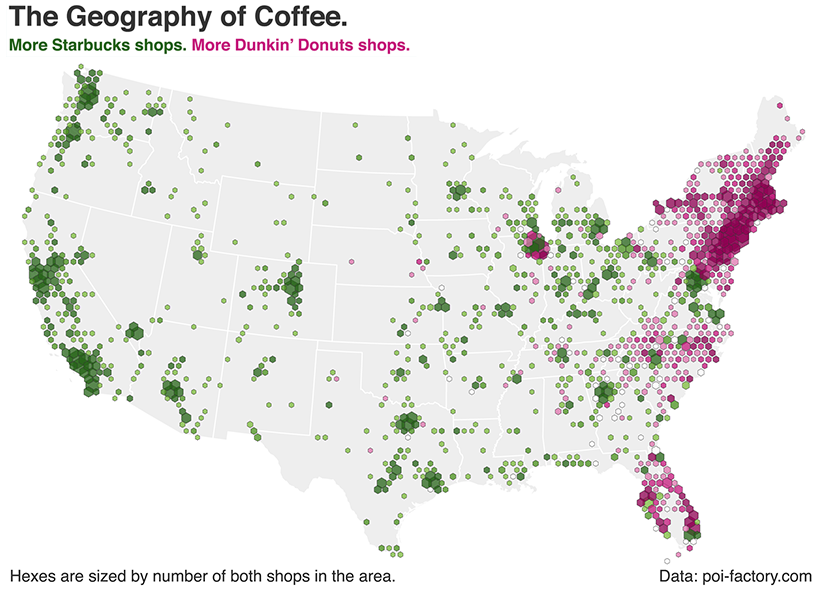
Regional Preferences
Of course, not all fast food chains have the ubiquity of Subway and McDonald’s. Many of these brands have achieved impressive sales numbers in specific regions. Whether you’re loyal to Dunkin’ Donuts, Chick-fil-A, or In-N-Out may depend heavily on where you live.
Will America’s next big fast food powerhouse come from an already-strong regional chain, or will it be the result of a new phenomenon, completely?


Misc
Visualizing the Most Common Pets in the U.S.
Lions, tigers, and bears, oh my!—these animals do not feature on this list of popular American household pets.


Visualizing The Most Common Pets in the U.S.
This was originally posted on our Voronoi app. Download the app for free on iOS or Android and discover incredible data-driven charts from a variety of trusted sources.
In this graphic, we visualized the most common American household pets, based on 2023-2024 data from the American Pet Products Association (accessed via Forbes Advisor).
Figures represent the number of households that own each pet type, rather than the actual number of each animal. The “small animal” category includes hamsters, gerbils, rabbits, guinea pigs, chinchillas, mice, rats, and ferrets.
What is the Most Popular American Household Pet?
Based on this data, dogs—one of the first domesticated animals—are the most common pets in the United States. In fact, around 65 million households own a dog, and spend an average of $900 a year on their care.
| Rank | Species | Households |
|---|---|---|
| 1 | 🐶 Dog | 65M |
| 2 | 🐱 Cat | 47M |
| 3 | 🐟 Freshwater Fish | 11M |
| 4 | 🐰 Small Animals | 7M |
| 5 | 🐦 Bird | 6M |
| 6 | 🦎 Reptile | 6M |
| 7 | 🐴 Horse | 2M |
| 8 | 🐠 Saltwater Fish | 2M |
Note: Households can own multiple pets, and are counted for all relevant categories.
Cats rank second, at 47 million households, and these smaller felines are a little less expensive to own at $700/year according to Forbes estimates.
But aside from these two juggernauts, there are plenty of other common pet types found in households across the country.
Freshwater fish can be found in 11 million households, along with small animals—rabbits, hamsters, guinea pigs—in 7 million. Meanwhile, nearly 6 million homes have birds or reptiles.
Pet Ownership is on the Rise in America
Forbes found that 66% of all American households (numbering 87 million) own at least one pet, up from 56% in 1988. One third of these (29 million) own multiple pets.
A combination of factors is driving this increase: rising incomes, delayed childbirth, and of course the impact of the pandemic which nearly cleared out animal shelters across the globe.
America’s loneliness epidemic may also be a factor. Fledgling research has shown that single-individual households with pets recorded lower rates of loneliness during the pandemic than those without a pet.

-

 Brands6 days ago
How Tech Logos Have Evolved Over Time
-

 Demographics2 weeks ago
The Smallest Gender Wage Gaps in OECD Countries
-

 Economy2 weeks ago
Where U.S. Inflation Hit the Hardest in March 2024
-

 Green2 weeks ago
Top Countries By Forest Growth Since 2001
-

 United States2 weeks ago
Ranked: The Largest U.S. Corporations by Number of Employees
-

 Maps2 weeks ago
The Largest Earthquakes in the New York Area (1970-2024)
-

 Green2 weeks ago
Ranked: The Countries With the Most Air Pollution in 2023
-

 Green2 weeks ago
Ranking the Top 15 Countries by Carbon Tax Revenue