

Nvidia is coming for Intel’s crown. Samsung is losing ground. AI is transforming the space. We break down revenue for semiconductor companies.


We compare America's top 10 companies by revenue in 1994 and 2023 to see how the business landscape has changed.
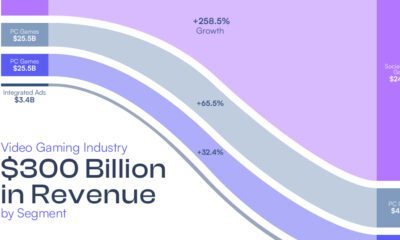

The video games industry could generate over $300 billion by 2026. Here is a break down of that revenue by source.


This graphic looks at the revenue of the world’s top carmakers and compares them to the GDP of 196 countries worldwide.
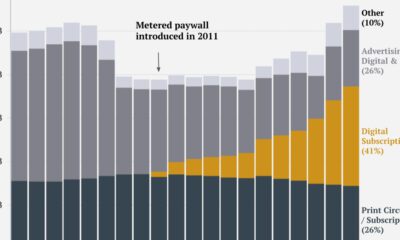

This graphic tracks the New York Times’ revenue streams over the past two decades, identifying its transition from advertising to subscription-reliant.


Which countries have the biggest online gambling markets? This graphic highlights the countries earning the highest gross revenues from online gambling.
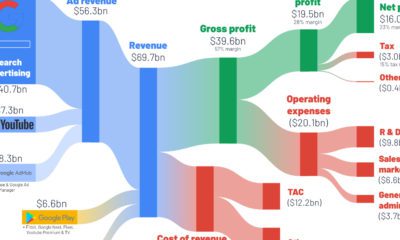

How do the big tech giants make their money? This series of graphics shows a breakdown of big tech revenue, using Q2 2022 income statements.
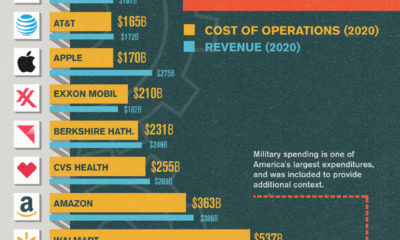

Running a Fortune 500 company is a costly endeavor. In this chart, we compare the operating costs of America's biggest names.
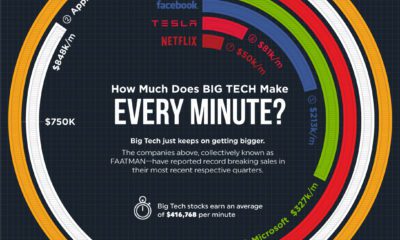

Big Tech just keeps on getting bigger. How much do the FAATMAN companies generate in revenues per minute?


This graphic compares consumers’ most loved brands before the COVID-19 pandemic to their most loved brands during the pandemic.


 Creator Program