Business
Ranked: Fast Food Brands with the Most U.S. Locations
Ranked: Fast Food Brands with the Most U.S. Locations
The fast food industry has become a behemoth in the U.S. from humble beginnings in Wichita a century ago, when the first White Castle store opened. Now, nearly 200,000 U.S. fast food brands make up an industry worth more than $300 billion.
We provide an overview of America’s fast food landscape, visualizing the top 15 companies with the most stores in the country. In this graphic, we use data from QSR Magazine, an industry magazine that focuses on the quick-service segment of the restaurant industry.
Which Fast Food Brands Have the Most Stores?
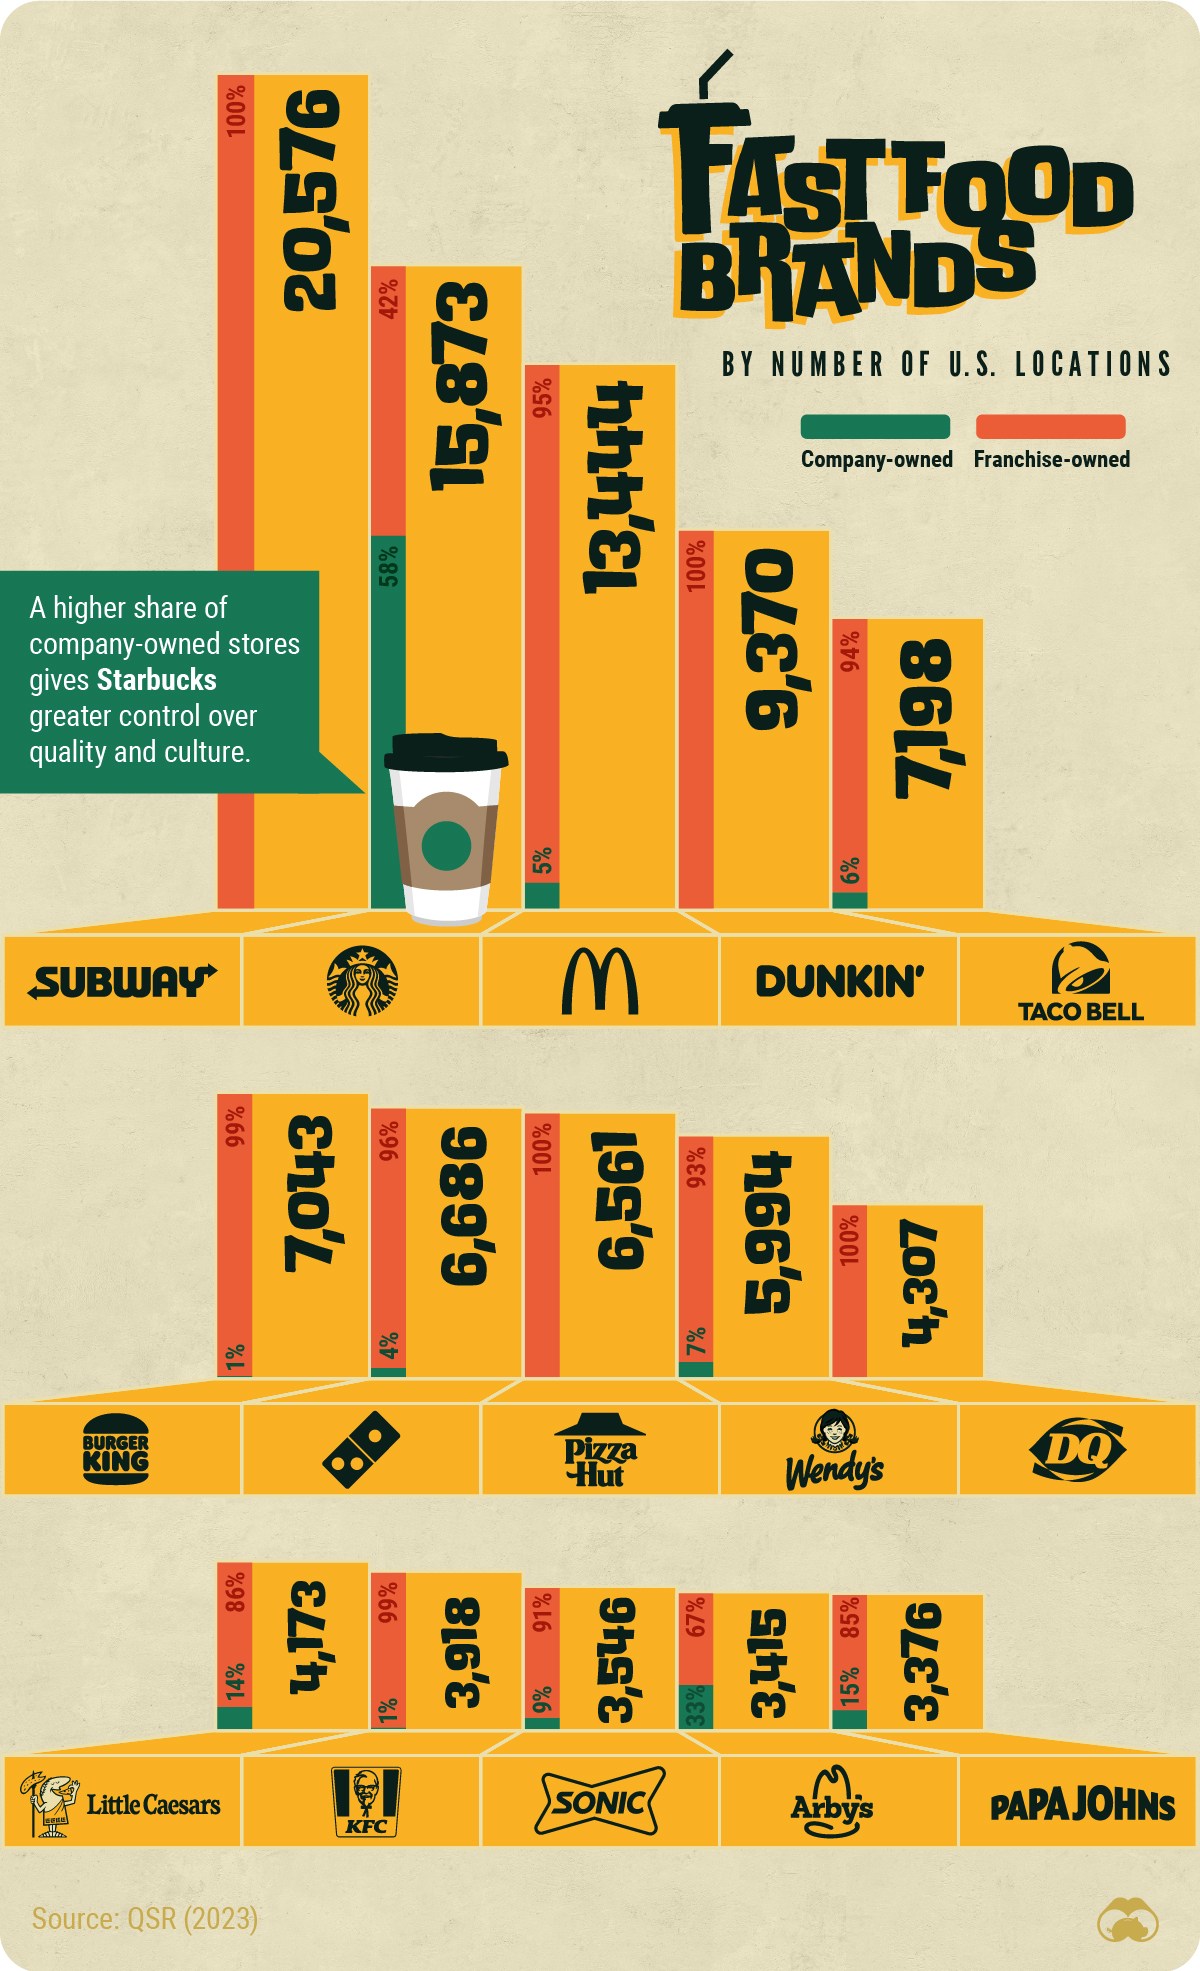
Ranked first, Subway is the only fast food brand with over 20,000 locations, even after a net reduction of 576 stores in 2022.
The previously family-run business is now owned by Roark Capital (which has substantial stake in other familiar names on this list including Arby’s and Sonic), and is mid-transformation, with 3,600 stores being remodeled in 2023.
Here’s the full breakdown of the top 50 fast food brands by number of U.S. locations in 2022.
| Rank | Company | Locations | Change in Locations (YoY) |
|---|---|---|---|
| 1 | Subway* | 20,576 | -571 |
| 2 | Starbucks* | 15,873 | +429 |
| 3 | McDonald's | 13,444 | +6 |
| 4 | Dunkin' | 9,370 | +126 |
| 5 | Taco Bell | 7,198 | +196 |
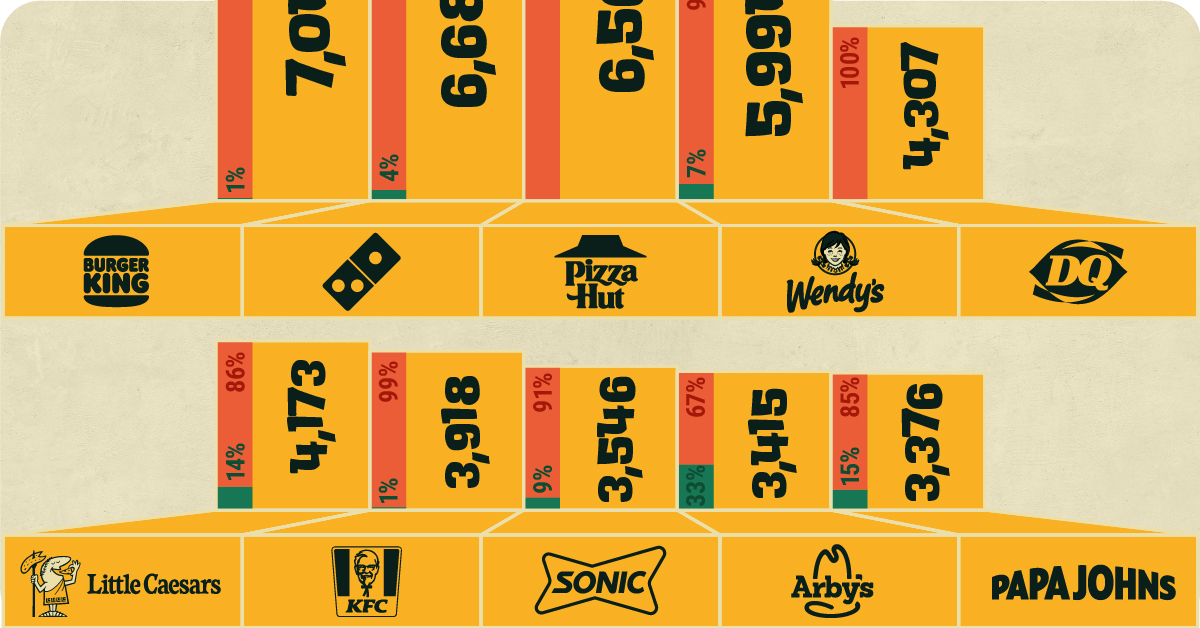
| 6 | Burger King | 7,043 | -61 |
| 7 | Domino's | 6,686 | +126 |
| 8 | Pizza Hut | 6,561 | +13 |
| 9 | Wendy's | 5,994 | +56 |
| 10 | Dairy Queen | 4,307 | -32 |
| 11 | Little Caesars* | 4,173 | -14 |
| 12 | KFC | 3,918 | -35 |
| 13 | Sonic Drive-In | 3,546 | -6 |
| 14 | Arby's | 3,415 | +6 |
| 15 | Papa Johns | 3,376 | +37 |
| 16 | Chipotle | 3,129 | +211 |
| 17 | Popeyes Louisiana Kitchen | 2,946 | +169 |
| 18 | Chick-fil-A* | 2,837 | +153 |
| 19 | Jimmy John's | 2,637 | -26 |
| 20 | Jersey Mike's | 2,397 | +297 |
| 21 | Panda Express | 2,393 | +87 |
| 22 | Baskin-Robbins | 2,253 | -54 |
| 23 | Jack In The Box | 2,180 | -38 |
| 24 | Panera Bread* | 2,102 | -33 |
| 25 | Wingstop | 1,721 | +187 |
| 26 | Hardee's | 1,707 | +45 |
| 27 | Five Guys | 1,409 | +19 |
| 28 | Tropical Smoothie Café | 1,198 | +159 |
| 29 | Firehouse Subs | 1,187 | +23 |
| 30 | Papa Murphy's | 1,168 | -72 |
| 31 | Carl's Jr. | 1,068 | +1 |
| 32 | Marco's Pizza | 1,067 | +65 |
| 33 | Whataburger | 925 | +52 |
| 34 | Zaxby's | 922 | +11 |
| 35 | Culver's | 892 | +56 |
| 36 | Church's Chicken | 812 | -91 |
| 37 | Checkers/Rally's | 806 | +28 |
| 38 | Bojangles | 788 | +15 |
| 39 | Qdoba | 728 | -11 |
| 40 | Crumbl Cookies | 688 | +363 |
| 41 | Dutch Bros | 671 | +133 |
| 42 | Raising Cane's | 646 | +79 |
| 43 | Moe's | 637 | -21 |
| 44 | Del Taco | 591 | -9 |
| 45 | McAlister's Deli | 525 | +20 |
| 46 | El Pollo Loco | 490 | +10 |
| 47 | Freddy's Frozen Custard & Steakburgers | 456 | +36 |
| 48 | In-N-Out Burger* | 379 | +12 |
| 49 | Krispy Kreme* | 352 | +44 |
| 50 | Shake Shack* | 287 | +44 |
*Figures estimated by QSR and Circana.
At second place, Starbucks has nearly 16,000 locations around the country, with California alone accounting for nearly 3,000 of them. The coffee chain is also going through a major shift as a result of post-pandemic trends. This includes a greater focus on drive-thru locations and overall speed and efficiency.
Ranked third, McDonald’s, grew its U.S. footprint for the first time in eight years, after adding six new locations. The brand has grown its global sales by nearly $20 billion since the beginning of the pandemic, even after exiting Russia in 2022.
Dunkin’ (dropped the “Donuts” in 2019) and Taco Bell round out the top-five with more than 9,000 and 7,000 locations respectively.
Notably there was only one ranking shift in the top 20 since last year, with Jersey Mike’s, a sandwich chain, moving past Panda Express to claim 20th place.
However the same list looks a little different when ordering by revenue earned in 2022.
Ranked: Fast Food Brands by 2022 Revenue
The Golden Arches take the golden crown for most revenue earned in 2022, easily beating out the competition. McDonald’s made nearly $48 billion in sales last year, 74% more than the next big brand.
Here’s the full ranking of most revenue earned by fast food brands in 2022.
| Revenue Rank | Company | Revenue (USD millions) | Change from Locations Rank |
|---|---|---|---|
| 1 | McDonald's | $48,734 | +2 |
| 2 | Starbucks* | $28,100 | 0 |
| 3 | Chick-fil-A* | $18,814 | +15 |
| 4 | Taco Bell | $13,850 | +1 |
| 5 | Wendy's | $11,694 | +4 |
| 6 | Dunkin' | $11,279 | -2 |
| 7 | Subway* | $10,372 | -6 |
| 8 | Burger King | $10,278 | -2 |
| 9 | Domino's | $8,752 | -2 |
| 10 | Chipotle | $8,600 | +6 |
| 11 | Panera Bread* | $6,787 | +13 |
| 12 | Pizza Hut | $5,500 | -4 |
| 13 | Sonic Drive-In | $5,499 | 0 |
| 14 | Panda Express | $5,149 | +7 |
| 15 | KFC | $5,100 | -3 |
| 16 | Popeyes Louisiana Kitchen | $5,001 | +1 |
| 17 | Dairy Queen | $4,579 | 0 |
| 18 | Arby's | $4,535 | -4 |
| 19 | Jack in the Box | $4,111 | +4 |
| 20 | Papa John's | $3,698 | -5 |
| 21 | Little Caesars* | $3,520 | -10 |
| 22 | Whataburger | $3,340 | +11 |
| 23 | Raising Cane's | $3,118 | +19 |
| 24 | Culver's | $2,830 | +11 |
| 25 | Jersey Mike's | $2,680 | -5 |
| 26 | Wingstop | $2,382 | -1 |
| 27 | Zaxby's | $2,380 | +7 |
| 28 | Jimmy John's | $2,364 | -9 |
| 29 | Five Guys | $2,204 | -2 |
| 30 | Hardee's | $2,020 | -4 |
| 31 | Bojangles | $1,600 | +7 |
| 32 | Carl's Jr. | $1,555 | -1 |
| 33 | Dutch Bros | $1,163 | +8 |
| 34 | Firehouse Subs | $1,154 | -5 |
| 35 | In-N-Out Burger* | $1,125 | +13 |
| 36 | Tropical Smoothie Café | $1,075 | -8 |
| 37 | El Pollo Loco | $1,039 | +9 |
| 38 | Crumbl Cookies | $1,004 | +2 |
| 39 | Qdoba | $1,002 | 0 |
| 40 | Shake Shack* | $994 | +10 |
| 41 | Krispy Kreme* | $991 | +8 |
| 42 | Marco's Pizza | $968 | -10 |
| 43 | Del Taco | $957 | +1 |
| 44 | McAlister's Deli | $956 | +1 |
| 45 | Checkers/Rally's | $858 | -8 |
| 46 | Freddy's Frozen Custard & Steakburgers | $808 | +1 |
| 47 | Church's Chicken | $765 | -11 |
| 48 | Papa Murphy's | $753 | -18 |
| 49 | Moe's | $705 | -6 |
| 50 | Baskin-Robbins | $685 | -28 |
*Figures estimated by QSR and Circana.
Starbucks holds on to the second spot, but Chick-fil-A shoots up 18 positions to third place by revenue, despite being closed on Sundays.
Raising Cane’s, which specializes in chicken fingers and Panera Bread, a bakery competitor to Starbucks, see similar upward trajectories, climbing 19 and 13 spots respectively on the revenue rankings.
On the other hand, Papa Murphy’s and Baskin Robbins have seen a steep drop, making between $600–700 million in 2022, putting them at the bottom of the sales rankings.
What’s Next for Fast Food?
QSR Magazine signals that automation is transforming the restaurant industry as businesses leverage robotics to ease staffing challenges that surged during the pandemic.
Some changes—increasing drive-thrus and apps for example—have already become commonplace but robot cooks and automated delivery vans may also soon proliferate.
With nearly eight out of 100 people in the American workforce involved in the food industry, these changes may cause significant shifts in employment patterns, potentially requiring upskilling for workers in this evolving landscape.


Brands
How Tech Logos Have Evolved Over Time
From complete overhauls to more subtle tweaks, these tech logos have had quite a journey. Featuring: Google, Apple, and more.


How Tech Logos Have Evolved Over Time
This was originally posted on our Voronoi app. Download the app for free on iOS or Android and discover incredible data-driven charts from a variety of trusted sources.
One would be hard-pressed to find a company that has never changed its logo. Granted, some brands—like Rolex, IBM, and Coca-Cola—tend to just have more minimalistic updates. But other companies undergo an entire identity change, thus necessitating a full overhaul.
In this graphic, we visualized the evolution of prominent tech companies’ logos over time. All of these brands ranked highly in a Q1 2024 YouGov study of America’s most famous tech brands. The logo changes are sourced from 1000logos.net.
How Many Times Has Google Changed Its Logo?
Google and Facebook share a 98% fame rating according to YouGov. But while Facebook’s rise was captured in The Social Network (2010), Google’s history tends to be a little less lionized in popular culture.
For example, Google was initially called “Backrub” because it analyzed “back links” to understand how important a website was. Since its founding, Google has undergone eight logo changes, finally settling on its current one in 2015.
| Company | Number of Logo Changes |
|---|---|
| 8 | |
| HP | 8 |
| Amazon | 6 |
| Microsoft | 6 |
| Samsung | 6 |
| Apple | 5* |
Note: *Includes color changes. Source: 1000Logos.net
Another fun origin story is Microsoft, which started off as Traf-O-Data, a traffic counter reading company that generated reports for traffic engineers. By 1975, the company was renamed. But it wasn’t until 2012 that Microsoft put the iconic Windows logo—still the most popular desktop operating system—alongside its name.
And then there’s Samsung, which started as a grocery trading store in 1938. Its pivot to electronics started in the 1970s with black and white television sets. For 55 years, the company kept some form of stars from its first logo, until 1993, when the iconic encircled blue Samsung logo debuted.
Finally, Apple’s first logo in 1976 featured Isaac Newton reading under a tree—moments before an apple fell on his head. Two years later, the iconic bitten apple logo would be designed at Steve Jobs’ behest, and it would take another two decades for it to go monochrome.

-

 Education1 week ago
How Hard Is It to Get Into an Ivy League School?
-

 Technology2 weeks ago
Ranked: Semiconductor Companies by Industry Revenue Share
-

 Markets2 weeks ago
Ranked: The World’s Top Flight Routes, by Revenue
-

 Demographics2 weeks ago
Population Projections: The World’s 6 Largest Countries in 2075
-

 Markets2 weeks ago
The Top 10 States by Real GDP Growth in 2023
-

 Demographics2 weeks ago
The Smallest Gender Wage Gaps in OECD Countries
-

 Economy2 weeks ago
Where U.S. Inflation Hit the Hardest in March 2024
-

 Environment2 weeks ago
Top Countries By Forest Growth Since 2001