Datastream
Ranked: The Performance of Restaurant Stocks on the NYSE
The Briefing
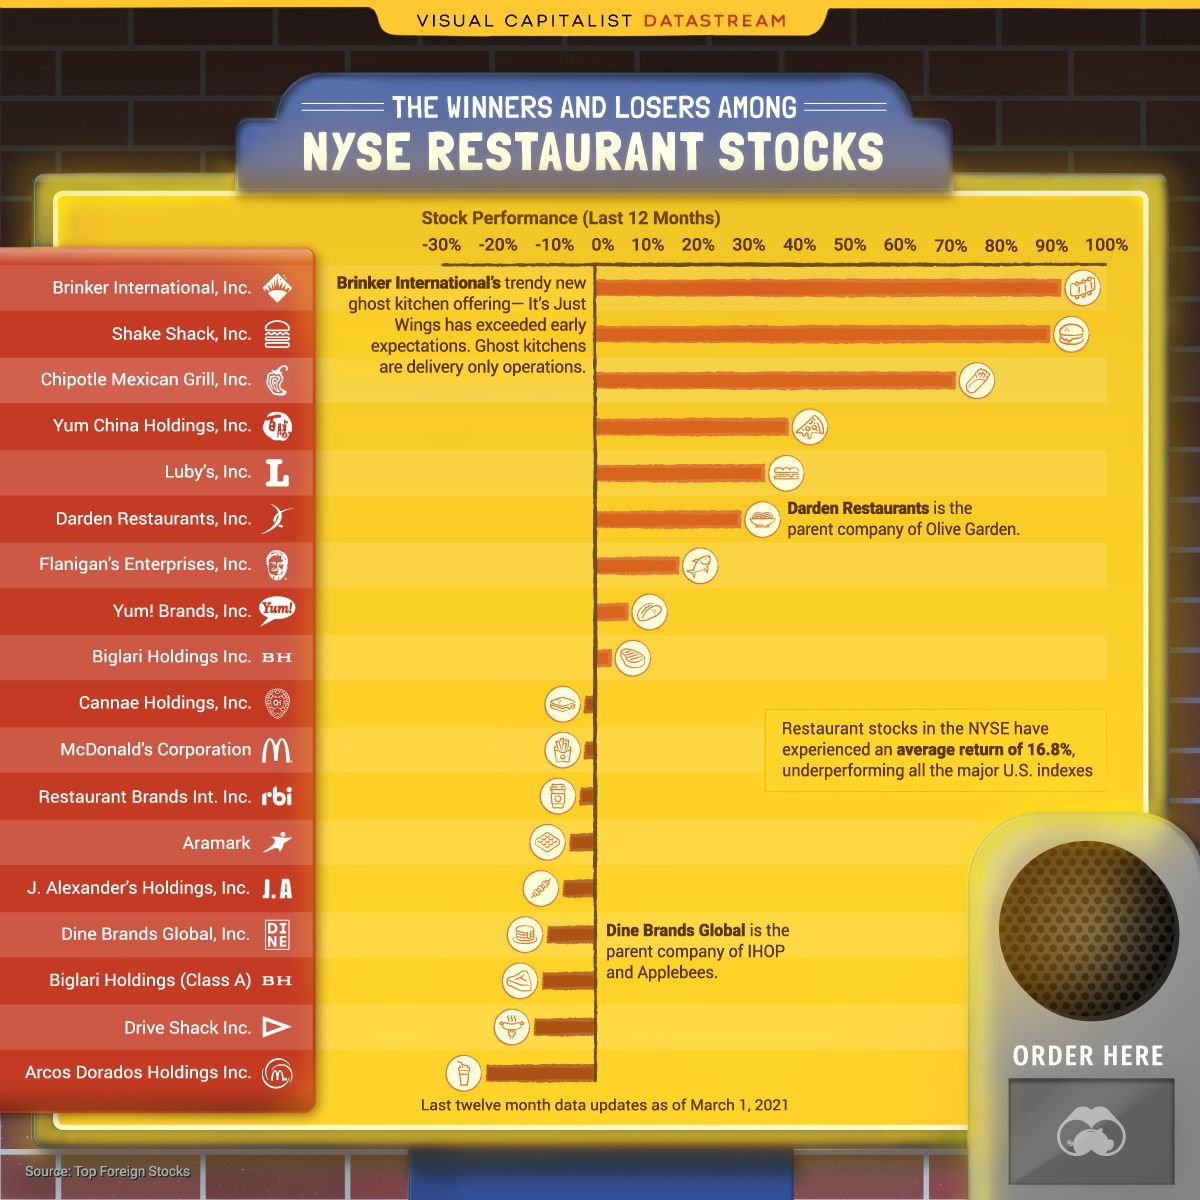
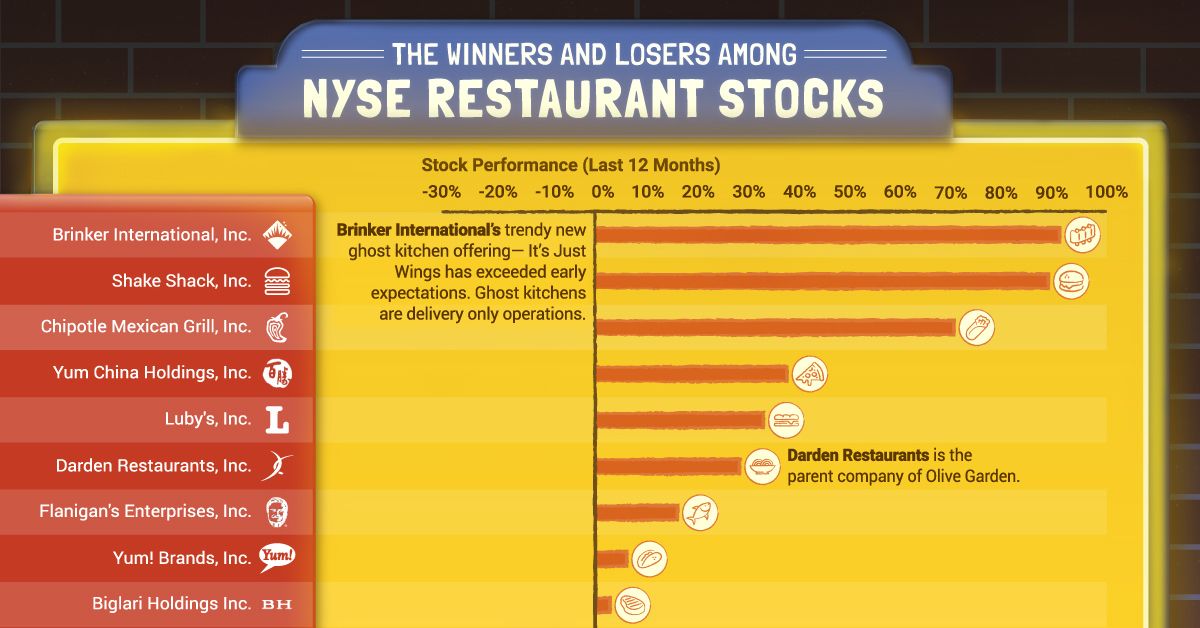
- In the last 12 months, the performance of restaurant stocks on the NYSE ranges from 90% to -21%
- The average return for restaurant stocks has been 16.8%, underperforming the NYSE Composite’s 23.8% over the same time period.
- Executing on a digital ecosystem has been a big driver of value for the best performers on the list
Restaurant Stocks on the NYSE
Restaurants, arguably more than other industries, have had to adjust swiftly to a new and unrecognizable landscape during the pandemic. And the level of preparedness towards adverse and unpredictable conditions reflects in the last 12 month (LTM) stock price performance of the 18 restaurant stocks on the NYSE.
The performance for this basket of stocks ranges from a high of 90% to a low of -21%. The companies that have rewarded shareholders are at the forefront of industry trends, doubling down on a digital ecosystem through concepts like membership programs, ghost kitchens, delivery, and mobile sales.
Winners and Losers
The vast division of stock price performance has a David and Goliath component to it in that the larger companies with deeper pockets have had the ability to invest in modern initiatives.
The top five performing stocks have an average market cap of $14 billion, while the bottom five possess an average of $630 million.
| Stock | Last 12 Month Performance | Market Cap ($M) |
|---|---|---|
| Brinker International, Inc. | 90.85% | $3,120 |
| Shake Shack, Inc. | 88.63% | $4,970 |
| Chipotle Mexican Grill, Inc. | 70.19% | $40,580 |
| Yum China Holdings, Inc. | 37.53% | $25,090 |
| Luby's, Inc. | 32.92% | $98 |
| Darden Restaurants, Inc. | 28.26% | $17,900 |
| Flanigan's Enterprises, Inc. | 16.10% | $44 |
| Yum! Brands, Inc. | 6.18% | $31,060 |
| Biglari Holdings Inc. | 2.90% | $356 |
| Cannae Holdings, Inc. | -1.87% | $3,420 |
| McDonald's Corporation | -1.88% | $153,690 |
| Restaurant Brands International, Inc. | -2.81% | $27,580 |
| Aramark | -4.82% | $9,650 |
| J. Alexander's Holdings, Inc. | -6.12% | $131 |
| Dine Brands Global, Inc | -9.25% | $1,330 |
| Biglari holdings (Class A) | -10.20% | $363 |
| Drive Shack Inc. | -11.82% | $238 |
| Arcos Dorados Holdings Inc. | -21.23% | $1,100 |
Digital Haves and Have Nots
The same types of initiatives appear to be paying off, especially for the biggest winners.
- Brinker International has exceeded expectations with its ghost kitchen virtual offering—It’s Just Wings. A ghost kitchen is a restaurant optimized strictly for delivery, with a no dine-in approach and a condensed menu, they are intended to achieve higher margins.
- Shake Shack saw 60% of shack sales go digital in Q3’20. Their digital footprint is expected to grow along with their target to open 50-60 new locations in 2021.
- Chipotle’s loyalty rewards member program reached 17 million members as of late. Furthermore, digital sales grew 177% year-over-year in their fourth quarter, and nearly 50% of revenues are now derived from digital orders.
Dine-in Drought
Those in negative territory have not had the same good fortune. They tend to be sit-down establishments suffering from drastic falls in foot traffic.
Without a pre-existing digital presence to reach customers, sales run the risk of taking a nosedive. Hospitality workers are among those hardest hit by the pandemic, and a lack of demand for hospitality labor again points to the dire circumstances for some sit-down restaurants.
Delivery Mania
For the food industry, the fall in foot traffic is partially offset by the rise in food delivery. Pure play companies in the food delivery space like DoorDash and Grubhub have fared well. Grubhub reported 622,700 Daily Average Grubs (daily deliveries) in 2020, up from 492,300 from the year prior. And for Uber, growth in the delivery segment of their business has buoyed the decline in ride hailing.
With the vaccine rollouts in play, the restaurant stocks on the NYSE may get a much-needed boost. But pandemic or not, the digital trends in the restaurant space will continue to shape the industry after COVID-19 just as it has done prior.
Where does this data come from?
Source: Top Foreign Stocks
Notes: Data is as of March 1, 2021


Datastream
Can You Calculate Your Daily Carbon Footprint?
Discover how the average person’s carbon footprint impacts the environment and learn how carbon credits can offset your carbon footprint.


The Briefing
- A person’s carbon footprint is substantial, with activities such as food consumption creating as much as 4,500 g of CO₂ emissions daily.
- By purchasing carbon credits from Carbon Streaming Corporation, you can offset your own emissions and fund positive climate action.
Your Everyday Carbon Footprint
While many large businesses and countries have committed to net-zero goals, it is essential to acknowledge that your everyday activities also contribute to global emissions.
In this graphic, sponsored by Carbon Streaming Corporation, we will explore how the choices we make and the products we use have a profound impact on our carbon footprint.
Carbon Emissions by Activity
Here are some of the daily activities and products of the average person and their carbon footprint, according to Clever Carbon.
| Household Activities & Products | CO2 Emissions (g) |
|---|---|
| 💡 Standard Light Bulb (100 watts, four hours) | 172 g |
| 📱 Mobile Phone Use (195 minutes per day)* | 189 g |
| 👕 Washing Machine (0.63 kWh) | 275 g |
| 🔥 Electric Oven (1.56 kWh) | 675 g |
| ♨️ Tumble Dryer (2.5 kWh) | 1,000 g |
| 🧻 Toilet Roll (2 ply) | 1,300 g |
| 🚿 Hot Shower (10 mins) | 2,000 g |
| 🚙 Daily Commute (one hour, by car) | 3,360 g |
| 🍽️ Average Daily Food Consumption (three meals of 600 calories) | 4,500 g |
| *Phone use based on yearly use of 69kg per the source, Reboxed | |
Your choice of transportation plays a crucial role in determining your carbon footprint. For instance, a 15 km daily commute to work on public transport generates an average of 1,464 g of CO₂ emissions. Compared to 3,360 g—twice the volume for a journey the same length by car.
By opting for more sustainable modes of transport, such as cycling, walking, or public transportation, you can significantly reduce your carbon footprint.
Addressing Your Carbon Footprint
One way to compensate for your emissions is by purchasing high-quality carbon credits.
Carbon credits are used to help fund projects that avoid, reduce or remove CO₂ emissions. This includes nature-based solutions such as reforestation and improved forest management, or technology-based solutions such as the production of biochar and carbon capture and storage (CCS).
While carbon credits offer a potential solution for individuals to help reduce global emissions, public awareness remains a significant challenge. A BCG-Patch survey revealed that only 34% of U.S. consumers are familiar with carbon credits, and only 3% have purchased them in the past.
About Carbon Streaming
By financing the creation or expansion of carbon projects, Carbon Streaming Corporation secures the rights to future carbon credits generated by these sustainable projects. You can then purchase these carbon credits to help fund climate solutions around the world and compensate for your own emissions.
Ready to get involved?
>> Learn more about purchasing carbon credits at Carbon Streaming

-

 Automotive2 weeks ago
Tesla Is Once Again the World’s Best-Selling EV Company
-

 AI1 week ago
The Stock Performance of U.S. Chipmakers So Far in 2024
-

 Misc1 week ago
Almost Every EV Stock is Down After Q1 2024
-

 Money2 weeks ago
Where Does One U.S. Tax Dollar Go?
-

 Green2 weeks ago
Ranked: Top Countries by Total Forest Loss Since 2001
-

 Markets2 weeks ago
Visualizing America’s Shortage of Affordable Homes
-

 Maps2 weeks ago
Mapped: Average Wages Across Europe
-

 Mining2 weeks ago
Charted: The Value Gap Between the Gold Price and Gold Miners