Technology
Mapped: The Fastest (and Slowest) Internet Speeds in the World
Mapped: The World’s Fastest (and Slowest) Internet Speeds
How quickly did this page load for you?
The answer depends on the device you’re using, and where in the world you’re located. Average internet speeds vary wildly from country to country.
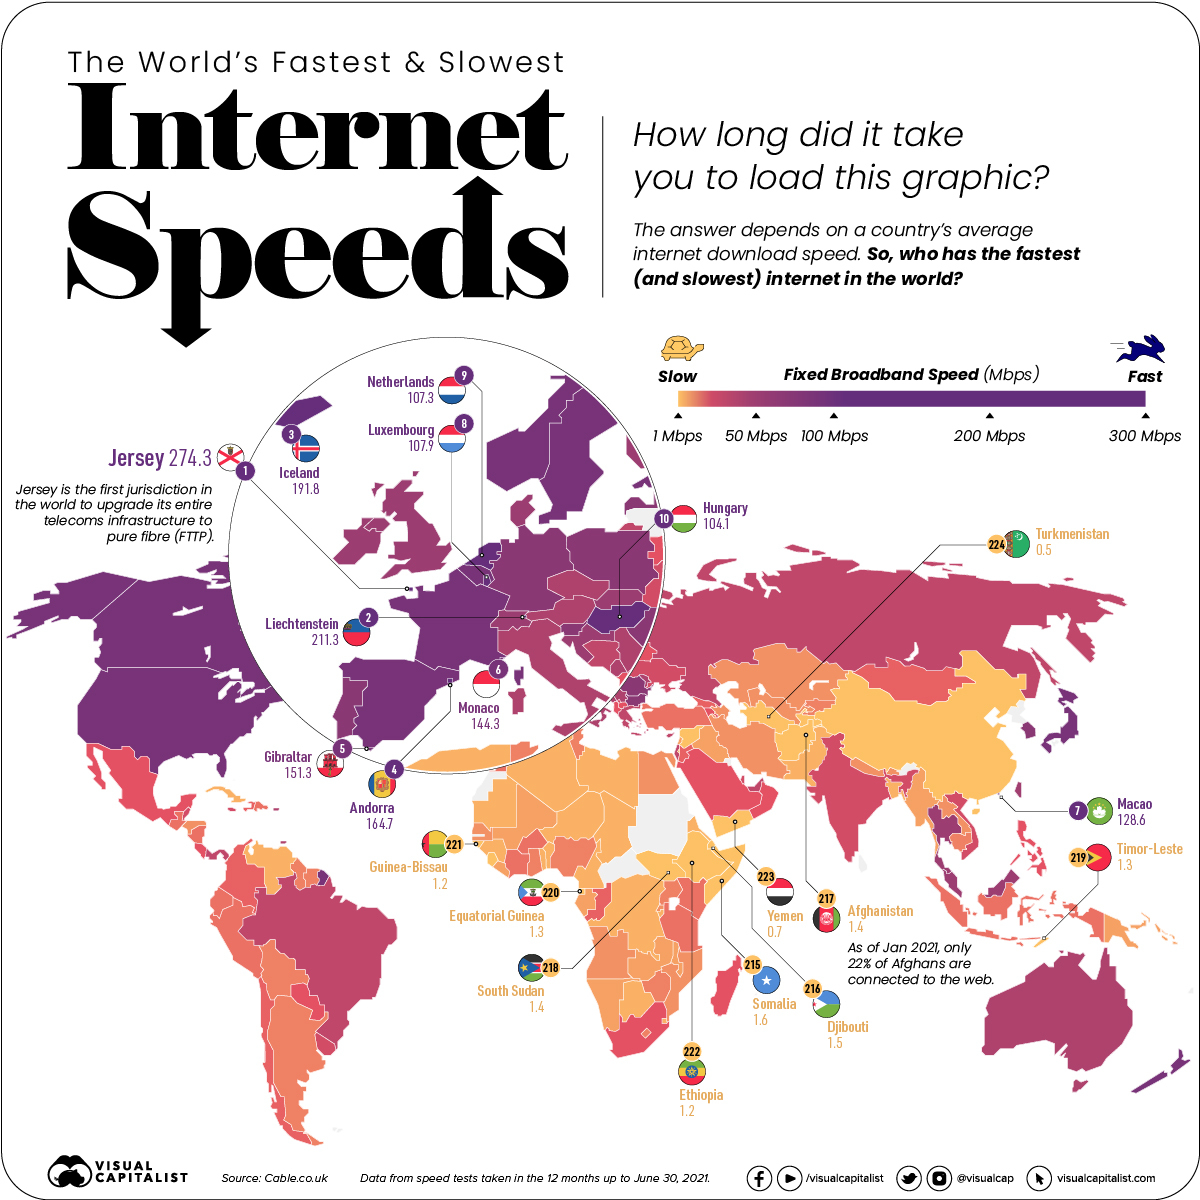
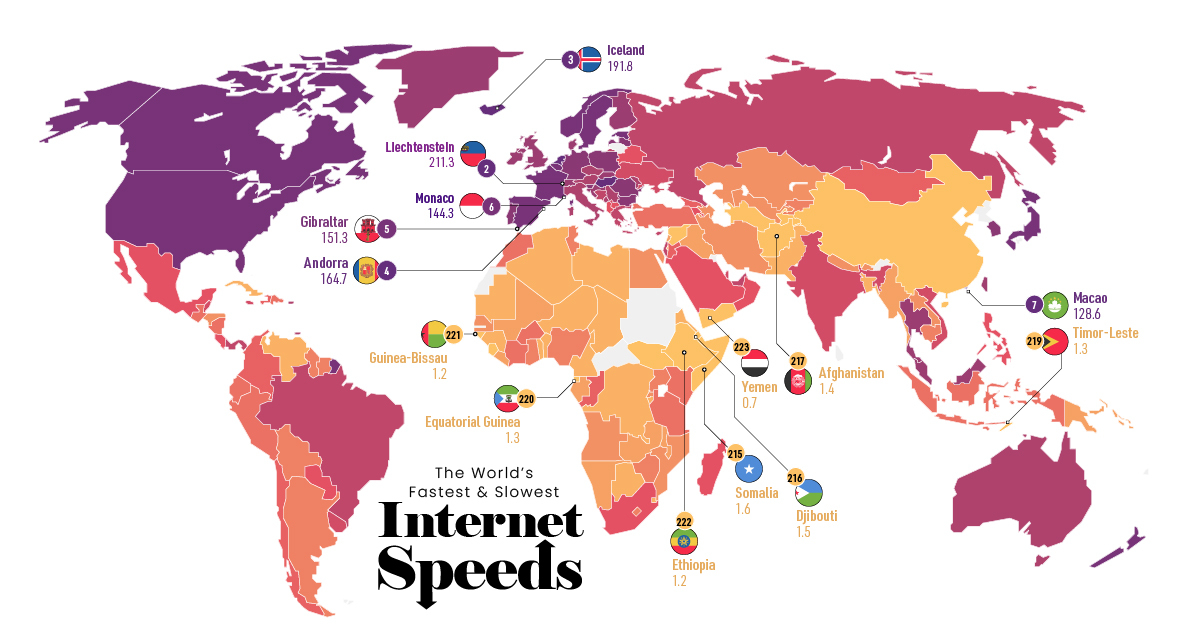
Which countries have the fastest internet connection? Using data from the Cable.co.uk, this map ranks the fastest (and slowest) internet speeds worldwide by comparing the fixed broadband speeds of over 200 countries.
What Factors Affect Internet Speed?
Before diving in, it’s important to understand the key factors that impact a country’s internet speed. Generally speaking, internet speed depends on:
- Infrastructure or the type of cabling (copper or fiber-optic) that a country’s utilizing to support their internet service. Typically, the newer the infrastructure, the faster the connection.
- Proximity/connection to submarine cables is important, as these massive undersea fiber-optic cables transmit about 97% of the world’s communication data.
- The size of a country, since landmass affects how much it costs to upgrade infrastructure. The smaller the country, the cheaper it is to upgrade cabling.
- Investment makes a difference, or how much a country’s government prioritizes internet accessibility.
Of course, other factors may influence a country’s internet speed too, such as government regulation and intentional bandwidth throttling, which is the case in countries like Turkmenistan.
Ranked: Fixed Broadband Speeds
To measure fixed broadband speeds across the globe, Cable.co.uk used more than 1.1 billion speed tests, sourced from over 200 countries.
The region with the fastest connection is Jersey, which is one of the islands that make up the British Isles. It has an average download speed of 274.27 mbps—almost 9x the overall average.
| Rank | Country | Mean download speed (Mbps) |
|---|---|---|
| 1 | 🇯🇪 Jersey | 274.27 |
| 2 | 🇱🇮 Liechtenstein | 211.26 |
| 3 | 🇮🇸 Iceland | 191.83 |
| 4 | 🇦🇩 Andorra | 164.66 |
| 5 | 🇬🇮 Gibraltar | 151.34 |
| 6 | 🇲🇨 Monaco | 144.29 |
| 7 | 🇲🇴 Macao SAR | 128.56 |
| 8 | 🇱🇺 Luxembourg | 107.94 |
| 9 | 🇳🇱 Netherlands | 107.3 |
| 10 | 🇭🇺 Hungary | 104.07 |
| 11 | 🇸🇬 Singapore | 97.61 |
| 12 | 🇧🇲 Bermuda | 96.54 |
| 13 | 🇯🇵 Japan | 96.36 |
| 14 | 🇺🇸 United States | 92.42 |
| 15 | 🇭🇰 Hong Kong SAR | 91.04 |
| 16 | 🇪🇸 Spain | 89.59 |
| 17 | 🇸🇪 Sweden | 88.98 |
| 18 | 🇳🇴 Norway | 88.67 |
| 19 | 🇫🇷 France | 85.96 |
| 20 | 🇳🇿 New Zealand | 85.95 |
| 21 | 🇲🇹 Malta | 85.2 |
| 22 | 🇪🇪 Estonia | 84.72 |
| 23 | 🇦🇽 Aland Islands | 81.31 |
| 24 | 🇨🇦 Canada | 79.96 |
| 25 | 🇧🇪 Belgium | 78.46 |
| 26 | 🇻🇦 Vatican City | 73.49 |
| 27 | 🇰🇾 Cayman Islands | 71.47 |
| 28 | 🇦🇼 Aruba | 70.66 |
| 29 | 🇷🇴 Romania | 67.4 |
| 30 | 🇸🇮 Slovenia | 67.2 |
| 31 | 🇵🇱 Poland | 63.84 |
| 32 | 🇧🇬 Bulgaria | 63.41 |
| 33 | 🇱🇻 Latvia | 63.28 |
| 34 | 🇵🇹 Portugal | 63.02 |
| 35 | 🇰🇷 Republic of Korea | 61.72 |
| 36 | 🇩🇪 Germany | 60.55 |
| 37 | 🇱🇹 Republic of Lithuania | 56.17 |
| 38 | 🇧🇧 Barbados | 55.92 |
| 39 | 🇫🇮 Finland | 55.08 |
| 40 | 🇸🇰 Slovak Republic | 54.92 |
| 41 | 🇹🇭 Thailand | 53.95 |
| 42 | 🇮🇲 Isle of Man | 52.1 |
| 43 | 🇬🇧 United Kingdom | 51.48 |
| 44 | 🇮🇪 Ireland | 51.41 |
| 45 | 🇨🇭 Switzerland | 50.83 |
| 46 | 🇭🇷 Croatia | 49.77 |
| 47 | 🇩🇰 Denmark | 49.24 |
| 48 | 🇵🇲 Saint Pierre and Miquelon | 47.92 |
| 49 | 🇹🇼 Taiwan | 46.43 |
| 50 | 🇷🇪 Réunion | 43.62 |
| 51 | 🇲🇾 Malaysia | 42.83 |
| 52 | 🇬🇱 Greenland | 41.56 |
| 53 | 🇸🇲 San Marino | 40.55 |
| 54 | 🇵🇷 Puerto Rico | 40.52 |
| 55 | 🇦🇺 Australia | 40.5 |
| 56 | 🇲🇫 Saint Martin | 40.19 |
| 57 | 🇲🇪 Montenegro | 40.14 |
| 58 | 🇧🇸 Bahamas | 39.71 |
| 59 | 🇦🇹 Austria | 37.99 |
| 60 | 🇨🇿 Czechia | 37.23 |
| 61 | 🇮🇹 Italy | 36.69 |
| 62 | 🇷🇸 Serbia | 36.59 |
| 63 | 🇲🇩 Republic of Moldova | 36.47 |
| 64 | 🇹🇨 Turks and Caicos Islands | 36.09 |
| 65 | 🇹🇹 Trinidad and Tobago | 35.81 |
| 66 | 🇷🇺 Russian Federation | 35.73 |
| 67 | 🇮🇱 Israel | 34.97 |
| 68 | 🇧🇷 Brazil | 33.34 |
| 69 | 🇳🇨 New Caledonia | 31.79 |
| 70 | 🇧🇦 Bosnia and Herzegovina | 31.72 |
| 71 | 🇬🇬 Guernsey | 31.2 |
| 72 | 🇵🇦 Panama | 30.58 |
| 73 | 🇦🇪 United Arab Emirates | 29.9 |
| 74 | 🇬🇷 Greece | 29.76 |
| 75 | 🇻🇮 Virgin Islands, U.S. | 29.34 |
| 76 | 🇨🇾 Cyprus | 28.3 |
| 77 | 🇺🇦 Ukraine | 25.26 |
| 78 | 🇶🇦 Qatar | 24.16 |
| 79 | 🇧🇿 Belize | 23.12 |
| 80 | 🇮🇳 India | 22.53 |
| 81 | 🇽🇰 Kosovo | 22.21 |
| 82 | 🇺🇾 Uruguay | 21.73 |
| 83 | 🇫🇴 Faroe Islands | 21.59 |
| 84 | 🇬🇵 Guadeloupe | 21.32 |
| 85 | 🇯🇲 Jamaica | 20.96 |
| 86 | 🇬🇺 Guam | 20.76 |
| 87 | 🇻🇳 Vietnam | 20.66 |
| 88 | 🇬🇩 Grenada | 20.49 |
| 89 | 🇨🇼 Curaçao | 20.18 |
| 90 | 🇿🇦 South Africa | 19.94 |
| 91 | 🇲🇶 Martinique | 19.88 |
| 92 | 🇧🇾 Belarus | 19.86 |
| 93 | 🇧🇶 Bonaire, Saint Eustatius and Saba | 19.6 |
| 94 | 🇵🇾 Paraguay | 19.41 |
| 95 | 🇻🇬 Virgin Islands, British | 19.4 |
| 96 | 🇦🇱 Albania | 19.36 |
| 97 | 🇨🇷 Costa Rica | 19.02 |
| 98 | 🇲🇽 Mexico | 18.83 |
| 99 | 🇸🇦 Saudi Arabia | 18.1 |
| 100 | 🇰🇼 Kuwait | 18.06 |
| 101 | 🇦🇲 Armenia | 18.05 |
| 102 | 🇵🇭 Philippines | 16.84 |
| 103 | 🇴🇲 Oman | 16.73 |
| 104 | 🇧🇭 Bahrain | 16.37 |
| 105 | 🇲🇬 Madagascar | 16.28 |
| 106 | 🇧🇳 Brunei | 15.79 |
| 107 | 🇲🇰 North Macedonia | 15.38 |
| 108 | 🇯🇴 Hashemite Kingdom of Jordan | 15.25 |
| 109 | 🇱🇨 Saint Lucia | 15.02 |
| 110 | 🇲🇳 Mongolia | 14.94 |
| 111 | 🇻🇨 Saint Vincent and the Grenadines | 14.32 |
| 112 | 🇬🇪 Georgia | 13.83 |
| 113 | 🇨🇱 Chile | 13.76 |
| 114 | 🇲🇵 Northern Mariana Islands | 13.15 |
| 115 | 🇨🇴 Colombia | 13.13 |
| 116 | 🇰🇳 Saint Kitts and Nevis | 12.96 |
| 117 | 🇩🇲 Dominica | 12.41 |
| 118 | 🇧🇱 Saint Barthélemy | 12.25 |
| 119 | 🇭🇹 Haiti | 12.12 |
| 120 | 🇨🇬 Republic of the Congo | 12.07 |
| 121 | 🇸🇨 Seychelles | 12.04 |
| 122 | 🇩🇴 Dominican Republic | 11.87 |
| 123 | 🇦🇸 American Samoa | 11.76 |
| 124 | 🇹🇷 Turkey | 11.58 |
| 125 | 🇵🇪 Peru | 11.35 |
| 126 | 🇰🇪 Kenya | 11.27 |
| 127 | 🇬🇫 French Guiana | 10.99 |
| 128 | 🇧🇫 Burkina Faso | 10.73 |
| 129 | 🇲🇦 Morocco | 10.33 |
| 130 | 🇪🇨 Ecuador | 10.25 |
| 131 | 🇸🇻 El Salvador | 9.95 |
| 132 | 🇱🇰 Sri Lanka | 9.95 |
| 133 | 🇬🇹 Guatemala | 9.85 |
| 134 | 🇳🇮 Nicaragua | 9.75 |
| 135 | 🇮🇩 Indonesia | 9.58 |
| 136 | 🇨🇮 Cote D'Ivoire | 9.54 |
| 137 | 🇫🇯 Fiji | 9.4 |
| 138 | 🇬🇾 Guyana | 9.26 |
| 139 | 🇬🇭 Ghana | 9.23 |
| 140 | 🇦🇮 Anguilla | 9 |
| 141 | 🇦🇬 Antigua and Barbuda | 8.69 |
| 142 | 🇳🇬 Nigeria | 8.68 |
| 143 | 🇦🇷 Argentina | 8.68 |
| 144 | 🇹🇿 United Republic of Tanzania | 8.6 |
| 145 | 🇲🇺 Mauritius | 8.53 |
| 146 | 🇺🇬 Uganda | 8.52 |
| 147 | 🇰🇭 Cambodia | 8.49 |
| 148 | 🇱🇸 Lesotho | 8.46 |
| 149 | 🇨🇻 Cape Verde | 7.94 |
| 150 | 🇿🇼 Zimbabwe | 7.92 |
| 151 | 🇾🇹 Mayotte | 7.7 |
| 152 | 🇵🇫 French Polynesia | 7.67 |
| 153 | 🇹🇳 Tunisia | 7.46 |
| 154 | 🇲🇻 Maldives | 7.45 |
| 155 | 🇰🇬 Kyrgyzstan | 7.44 |
| 156 | 🇸🇷 Suriname | 7.44 |
| 157 | 🇧🇴 Bolivia | 7.36 |
| 158 | 🇲🇿 Mozambique | 7.17 |
| 159 | 🇭🇳 Honduras | 7.17 |
| 160 | 🇮🇷 Iran | 7.05 |
| 161 | 🇸🇳 Senegal | 7.02 |
| 162 | 🇪🇬 Egypt | 6.94 |
| 163 | 🇳🇵 Nepal | 6.84 |
| 164 | 🇼🇸 Samoa | 6.8 |
| 165 | 🇲🇭 Marshall Islands | 6.71 |
| 166 | 🇺🇿 Uzbekistan | 6.64 |
| 167 | 🇦🇿 Azerbaijan | 6.63 |
| 168 | 🇧🇹 Bhutan | 6.44 |
| 169 | 🇷🇼 Rwanda | 6.29 |
| 170 | 🇸🇽 Sint Maarten | 6.15 |
| 171 | 🇱🇦 Lao People's Democratic Republic | 5.91 |
| 172 | 🇦🇴 Angola | 5.88 |
| 173 | 🇰🇿 Kazakhstan | 5.83 |
| 174 | 🇱🇧 Lebanon | 5.67 |
| 175 | 🇮🇶 Iraq | 5.58 |
| 176 | 🇿🇲 Zambia | 5.48 |
| 177 | 🇸🇧 Solomon Islands | 5.33 |
| 178 | 🇱🇷 Liberia | 5.23 |
| 179 | 🇵🇬 Papua New Guinea | 5.1 |
| 180 | 🇬🇦 Gabon | 4.99 |
| 181 | 🇲🇼 Malawi | 4.96 |
| 182 | 🇵🇼 Palau | 4.84 |
| 183 | 🇲🇱 Mali | 4.72 |
| 184 | 🇲🇲 Myanmar | 4.58 |
| 185 | 🇳🇦 Namibia | 4.42 |
| 186 | 🇰🇲 Comoros | 3.99 |
| 187 | 🇸🇿 Eswatini | 3.73 |
| 188 | 🇱🇾 Libya | 3.73 |
| 189 | 🇧🇼 Botswana | 3.65 |
| 190 | 🇵🇸 Palestine | 3.65 |
| 191 | 🇨🇩 DR Congo | 3.63 |
| 192 | 🇹🇬 Togo | 3.54 |
| 193 | 🇳🇪 Niger | 3.23 |
| 194 | 🇩🇿 Algeria | 3.08 |
| 195 | 🇨🇲 Cameroon | 3.04 |
| 196 | 🇨🇺 Cuba | 2.92 |
| 197 | 🇧🇩 Bangladesh | 2.9 |
| 198 | 🇻🇺 Vanuatu | 2.9 |
| 199 | 🇵🇰 Pakistan | 2.82 |
| 200 | 🇧🇮 Burundi | 2.82 |
| 201 | 🇻🇪 Venezuela | 2.62 |
| 202 | 🇧🇯 Benin | 2.59 |
| 203 | 🇲🇷 Mauritania | 2.54 |
| 204 | 🇸🇹 São Tomé and Príncipe | 2.43 |
| 205 | 🇪🇷 Eritrea | 2.41 |
| 206 | 🇬🇳 Guinea | 2.39 |
| 207 | 🇹🇩 Chad | 2.39 |
| 208 | 🇸🇱 Sierra Leone | 2.19 |
| 209 | 🇨🇳 China | 2.06 |
| 210 | 🇬🇲 Gambia | 2.04 |
| 211 | 🇹🇯 Tajikistan | 1.82 |
| 212 | 🇸🇩 Sudan | 1.8 |
| 213 | 🇸🇾 Syrian Arab Republic | 1.67 |
| 214 | 🇫🇲 Federated States of Micronesia | 1.63 |
| 215 | 🇸🇴 Somalia | 1.59 |
| 216 | 🇩🇯 Djibouti | 1.46 |
| 217 | 🇦🇫 Afghanistan | 1.41 |
| 218 | 🇸🇸 South Sudan | 1.4 |
| 219 | 🇹🇱 Democratic Republic of Timor-Leste | 1.33 |
| 220 | 🇬🇶 Equatorial Guinea | 1.3 |
| 221 | 🇬🇼 Guinea-Bissau | 1.24 |
| 222 | 🇪🇹 Ethiopia | 1.2 |
| 223 | 🇾🇪 Yemen | 0.68 |
| 224 | 🇹🇲 Turkmenistan | 0.5 |
Infrastructure is a major reason behind Jersey’s speedy internet. It’s the first jurisdiction in the world to upgrade its entire system to pure fibre (FTTP). But the region’s size also plays a factor, since its landmass and population size are both relatively small compared to the rest of the world.
Second on the list is another small region, Liechtenstein, with an average download speed of 211.26 mbps. Liechtenstein is one of the richest countries in the world per capita, and its government has invested heavily in its telecommunications infrastructure, aiming to be fully fibre optic by 2022.
Like Jersey, Liechtenstein also has a relatively small population. At the time of this article’s publication, the region is home to approximately 38,000 people. In fact, it’s worth noting that of the top ten regions, only two have populations over one million—the Netherlands, and Hungary.
At the opposite end of the spectrum, Turkmenistan has the slowest fixed broadband, with a speed of 0.5 mbps. As mentioned above, this is largely because of government regulation and intervention.
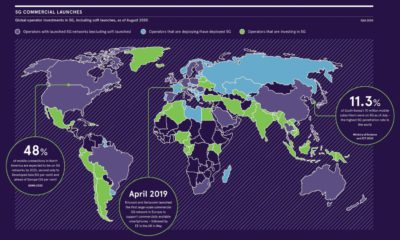
The Future is 5G
Innovation and new technologies are changing the digital landscape, and things like 5G networks are becoming more mainstream across the globe.
Because of the rapidly changing nature of this industry, the data behind this ranking is updated monthly to provide the latest look at internet speeds across the globe.
This means the bar is gradually raising when it comes to internet speed, as faster, stronger internet connections become the norm. And countries that aren’t equipped to handle these souped-up networks will lag behind even further.


Technology
All of the Grants Given by the U.S. CHIPS Act
Intel, TSMC, and more have received billions in subsidies from the U.S. CHIPS Act in 2024.


All of the Grants Given by the U.S. CHIPS Act
This was originally posted on our Voronoi app. Download the app for free on iOS or Android and discover incredible data-driven charts from a variety of trusted sources.
This visualization shows which companies are receiving grants from the U.S. CHIPS Act, as of April 25, 2024. The CHIPS Act is a federal statute signed into law by President Joe Biden that authorizes $280 billion in new funding to boost domestic research and manufacturing of semiconductors.
The grant amounts visualized in this graphic are intended to accelerate the production of semiconductor fabrication plants (fabs) across the United States.
Data and Company Highlights
The figures we used to create this graphic were collected from a variety of public news sources. The Semiconductor Industry Association (SIA) also maintains a tracker for CHIPS Act recipients, though at the time of writing it does not have the latest details for Micron.
| Company | Federal Grant Amount | Anticipated Investment From Company |
|---|---|---|
| 🇺🇸 Intel | $8,500,000,000 | $100,000,000,000 |
| 🇹🇼 TSMC | $6,600,000,000 | $65,000,000,000 |
| 🇰🇷 Samsung | $6,400,000,000 | $45,000,000,000 |
| 🇺🇸 Micron | $6,100,000,000 | $50,000,000,000 |
| 🇺🇸 GlobalFoundries | $1,500,000,000 | $12,000,000,000 |
| 🇺🇸 Microchip | $162,000,000 | N/A |
| 🇬🇧 BAE Systems | $35,000,000 | N/A |
BAE Systems was not included in the graphic due to size limitations
Intel’s Massive Plans
Intel is receiving the largest share of the pie, with $8.5 billion in grants (plus an additional $11 billion in government loans). This grant accounts for 22% of the CHIPS Act’s total subsidies for chip production.
From Intel’s side, the company is expected to invest $100 billion to construct new fabs in Arizona and Ohio, while modernizing and/or expanding existing fabs in Oregon and New Mexico. Intel could also claim another $25 billion in credits through the U.S. Treasury Department’s Investment Tax Credit.
TSMC Expands its U.S. Presence
TSMC, the world’s largest semiconductor foundry company, is receiving a hefty $6.6 billion to construct a new chip plant with three fabs in Arizona. The Taiwanese chipmaker is expected to invest $65 billion into the project.
The plant’s first fab will be up and running in the first half of 2025, leveraging 4 nm (nanometer) technology. According to TrendForce, the other fabs will produce chips on more advanced 3 nm and 2 nm processes.
The Latest Grant Goes to Micron
Micron, the only U.S.-based manufacturer of memory chips, is set to receive $6.1 billion in grants to support its plans of investing $50 billion through 2030. This investment will be used to construct new fabs in Idaho and New York.

-

 Education1 week ago
How Hard Is It to Get Into an Ivy League School?
-

 Technology2 weeks ago
Ranked: Semiconductor Companies by Industry Revenue Share
-

 Markets2 weeks ago
Ranked: The World’s Top Flight Routes, by Revenue
-

 Demographics2 weeks ago
Population Projections: The World’s 6 Largest Countries in 2075
-

 Markets2 weeks ago
The Top 10 States by Real GDP Growth in 2023
-

 Demographics2 weeks ago
The Smallest Gender Wage Gaps in OECD Countries
-

 Economy2 weeks ago
Where U.S. Inflation Hit the Hardest in March 2024
-

 Green2 weeks ago
Top Countries By Forest Growth Since 2001