Technology
Ranked: Big Tech CEO Insider Trading During the First Half of 2021
Big Tech CEO Insider Trading During The First Half of 2021
When CEOs of major companies are selling their shares, investors can’t help but notice.
After all, these decisions have a direct effect on the personal wealth of these insiders, which can say plenty about their convictions with respect to the future direction of the companies they run.
Considering that Big Tech stocks are some of the most popular holdings in today’s portfolios, and are backed by a collective $5.3 trillion in institutional investment, how do the CEOs of these organizations rank by their insider selling?
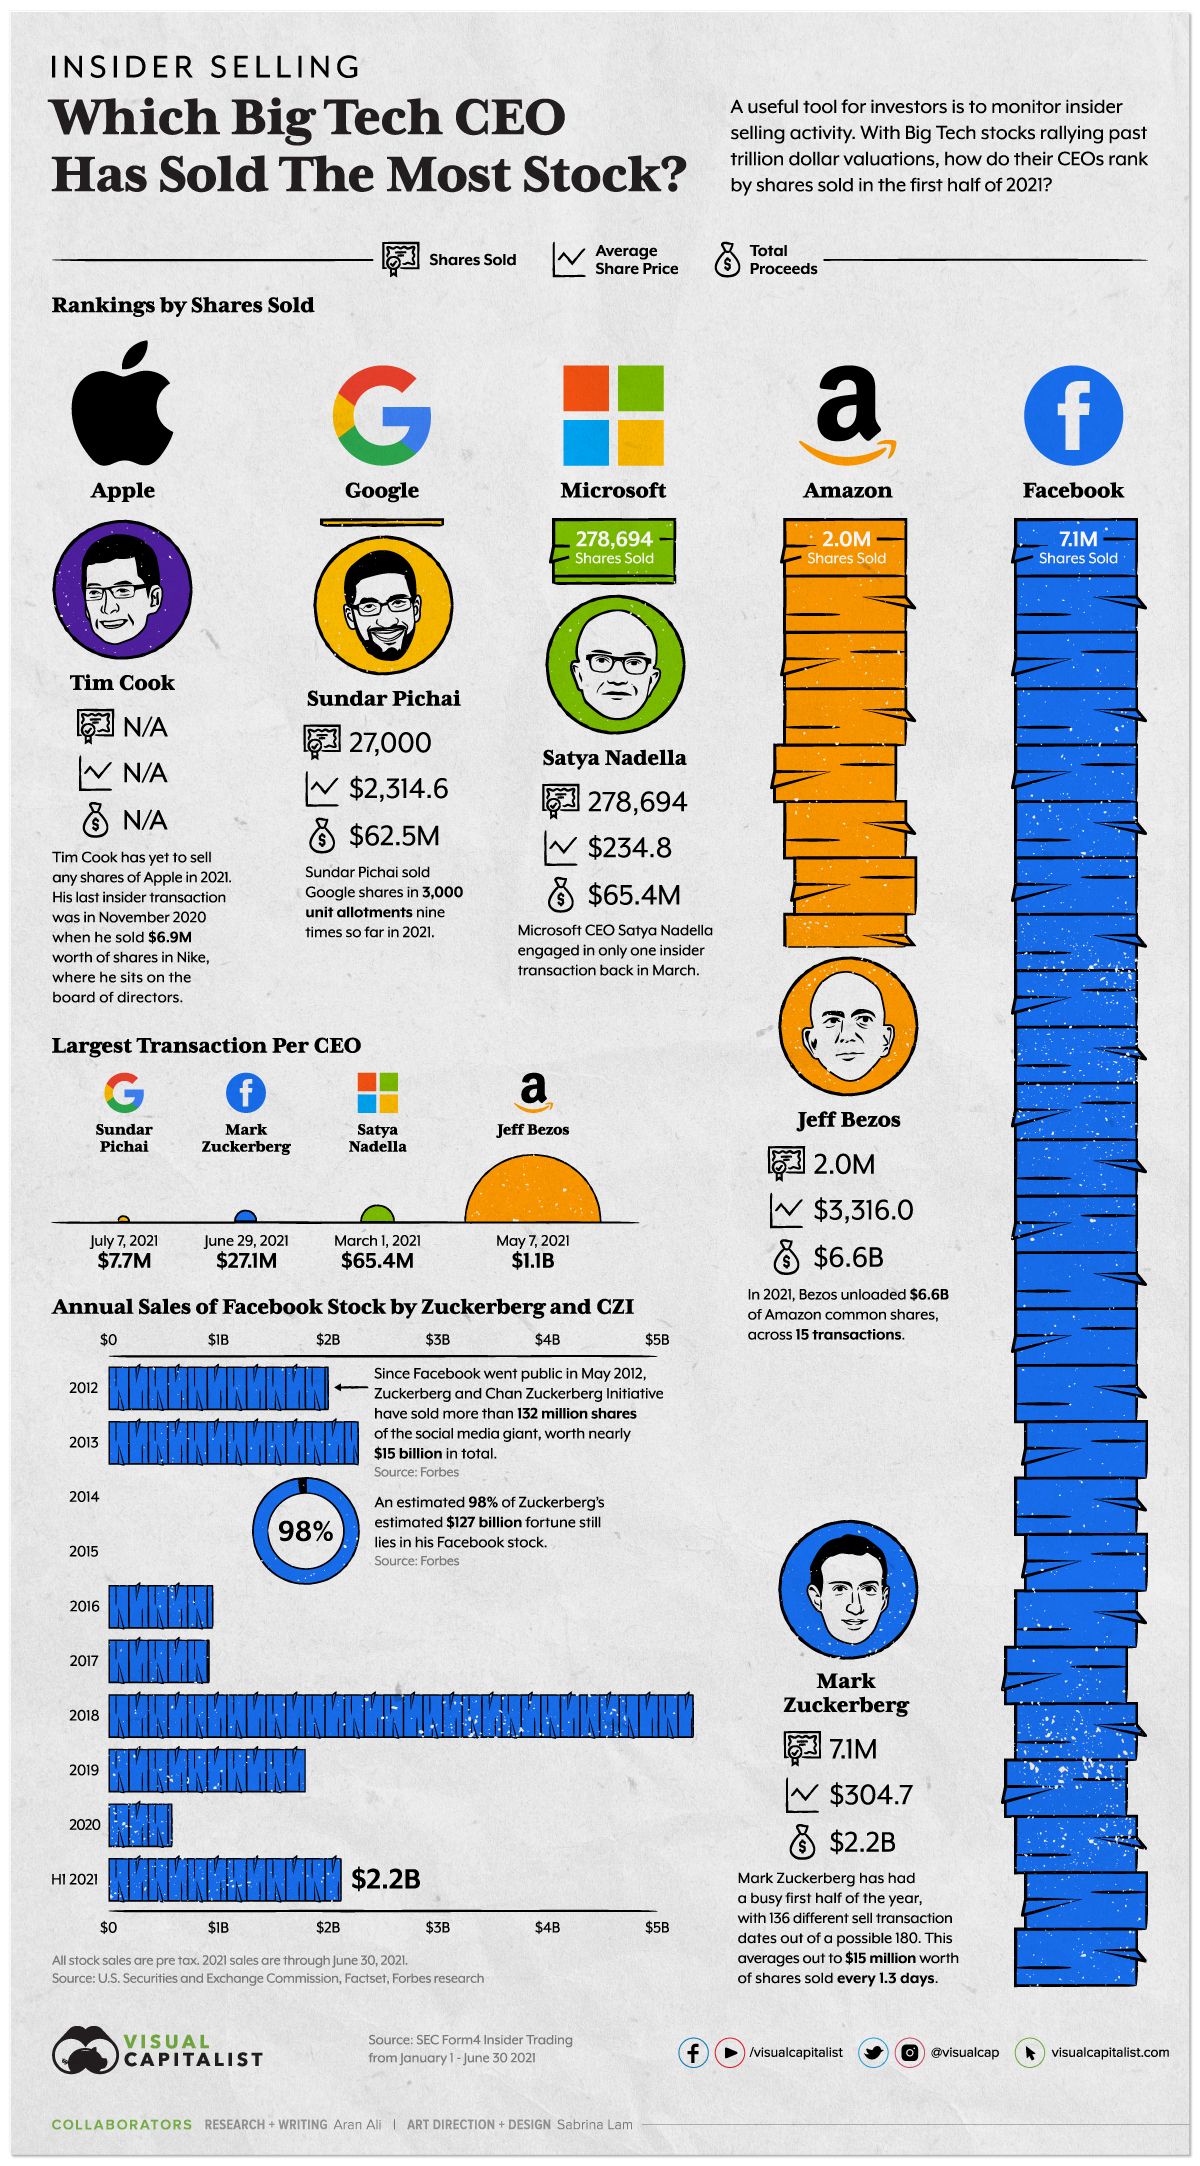
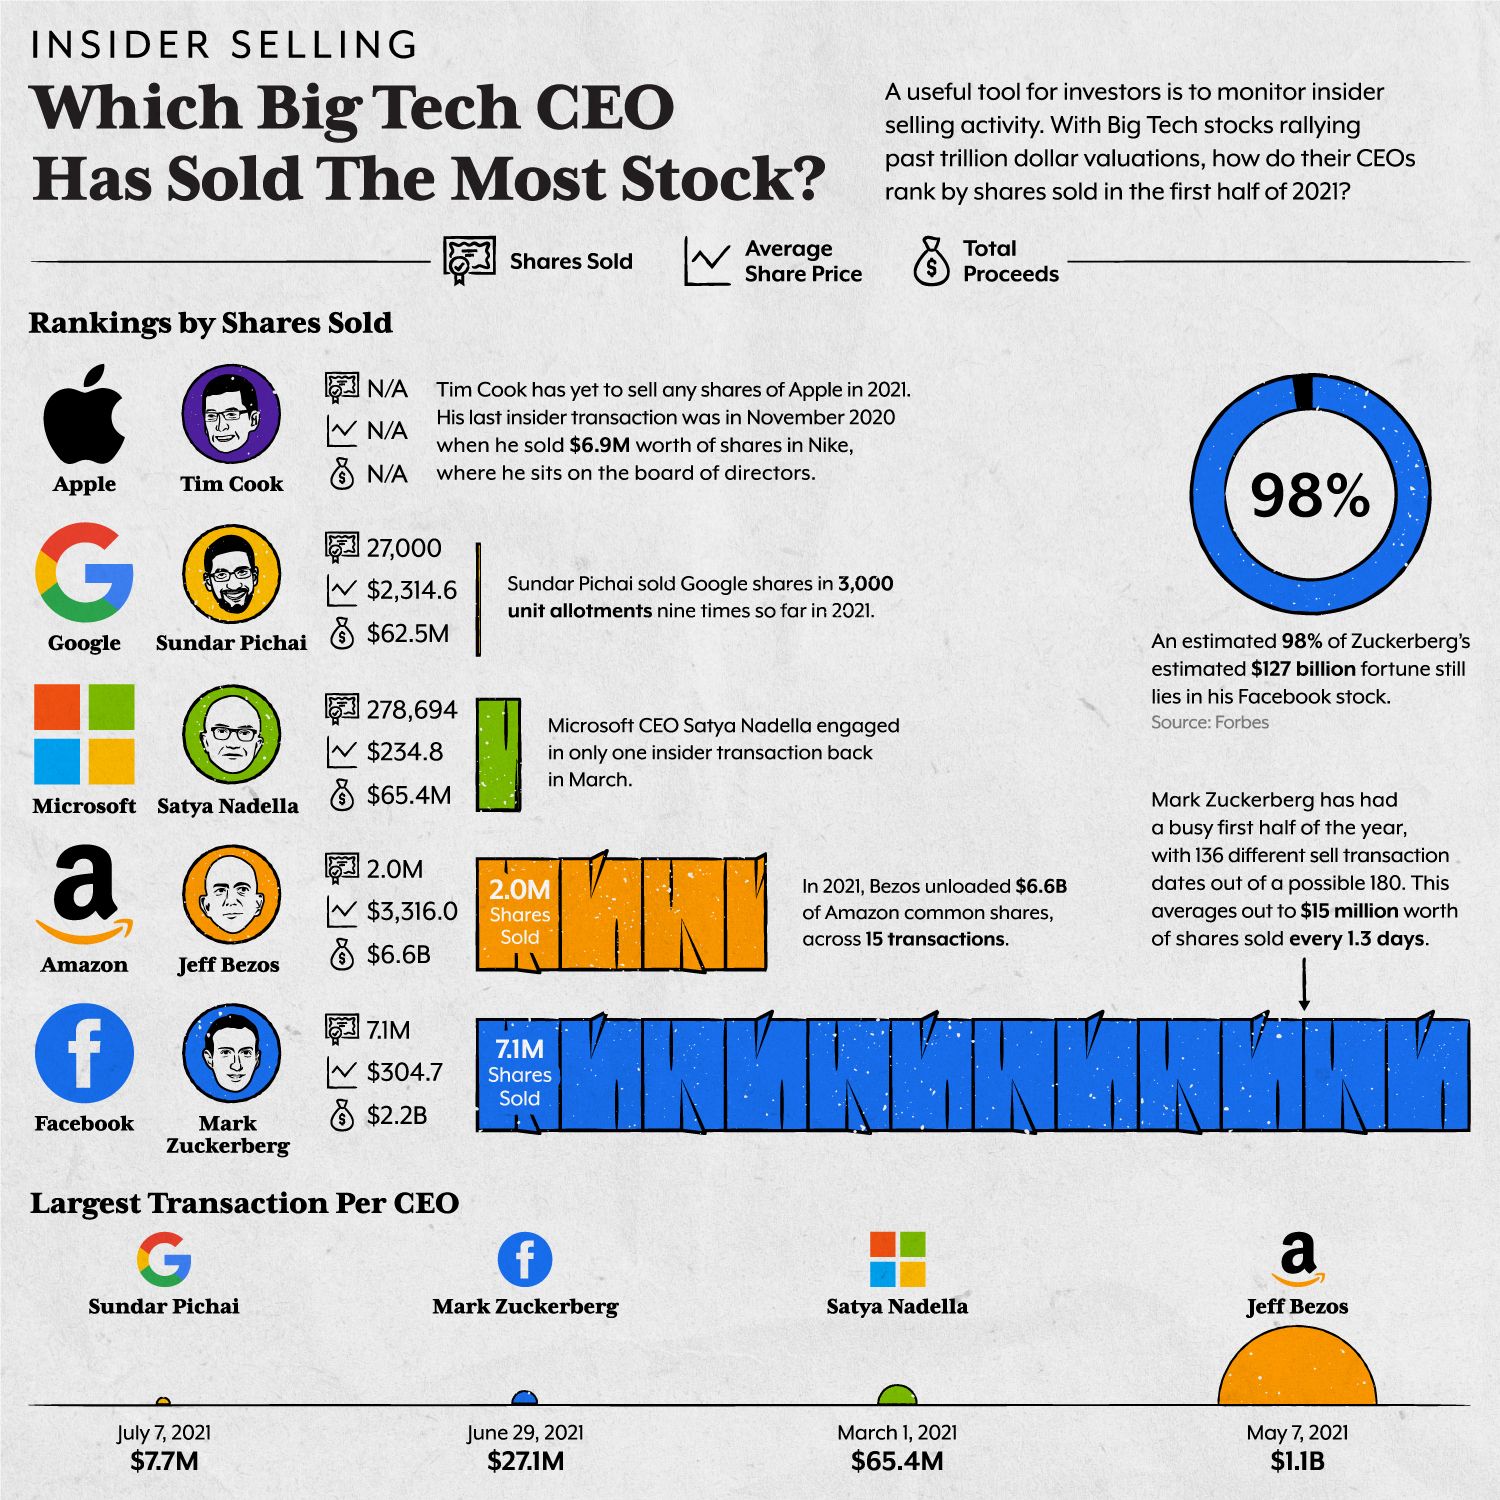
| CEO | Stock | Shares Sold H1 2021 | Value of Shares ($M) |
|---|---|---|---|
| Jeff Bezos | Amazon (AMZN) | 2.0 million | $6,600 |
| Mark Zuckerberg | Facebook (FB) | 7.1 million | $2,200 |
| Satya Nadella | Microsoft (MSFT) | 278,694 | $65 |
| Sundar Pichai | Google (GOOGL) | 27,000 | $62 |
| Tim Cook | Apple (AAPL) | 0 | $0 |
Breaking Down Insider Trading, by CEO
Let’s dive into the insider trading activity of each Big Tech CEO:
Jeff Bezos
During the first half of 2021, Jeff Bezos sold 2 million shares of Amazon worth $6.6 billion.
This activity was spread across 15 different transactions, representing an average of $440 million per transaction. Altogether, this ranks him first by CEO insider selling, by total dollar proceeds. Bezos’s time as CEO of Amazon came to an end shortly after the half way mark for the year.
Mark Zuckerberg
In second place is Mark Zuckerberg, who has been significantly busier selling than the rest.
In the first half of 2021, he unloaded 7.1 million shares of Facebook onto the open market, worth $2.2 billion. What makes these transactions interesting is the sheer quantity of them, as he sold on 136 out of 180 days. On average, that’s $12 million worth of stock sold every day.
Zuckerberg’s record year of selling in 2018 resulted in over $5 billion worth of stock sold, but over 90% of his net worth still remains in the company.
Satya Nadella
Next is Satya Nadella, who sold 278,694 shares of Microsoft, worth $234 million. Despite this, the Microsoft CEO still holds an estimated 1.6 million shares, which is the largest of any insider.
Microsoft’s stock has been on a tear for a number of years now, and belongs to an elite trillion dollar club, which consists of only six public companies.
Sundar Pichai
Fourth on the list is Sundar Pichai who has been at the helm at Google for six years now. Since the start of 2021, he’s sold 27,000 shares through nine separate transactions, worth $62.5 million. However, Pichai still has an estimated 6,407 Class A and 114,861 Class C shares.
Google is closing in on a $2 trillion valuation and is the best performing Big Tech stock, with shares rising 60% year-to-date. Their market share growth from U.S. ad revenues is a large contributing factor.
Tim Cook
Last, is Tim Cook, who just surpassed a decade as Apple CEO.
During this time, shares have rallied over 1,000% and annual sales have gone from $100 billion to $347 billion. That said, Cook has sold 0 shares of Apple during the first half of 2021. That doesn’t mean he hasn’t sold shares elsewhere, though. Cook also sits on the board of directors for Nike, and has sold $6.9 million worth of shares this year.
Measuring Insider Selling
All things equal, it’s desirable for management to have skin in the game, and be invested alongside shareholders. It can also be seen as aligning long-term interests.
A good measure of insider selling activity is in relation to the existing stake in the company. For example, selling $6.6 billion worth of shares may sound like a lot, but when there are 51.7 million Amazon shares remaining for Jeff Bezos, it actually represents a small portion and is probably not cause for panic.
If, however, executives are disclosing large transactions relative to their total stakes, it might be worth digging deeper.


Technology
All of the Grants Given by the U.S. CHIPS Act
Intel, TSMC, and more have received billions in subsidies from the U.S. CHIPS Act in 2024.


All of the Grants Given by the U.S. CHIPS Act
This was originally posted on our Voronoi app. Download the app for free on iOS or Android and discover incredible data-driven charts from a variety of trusted sources.
This visualization shows which companies are receiving grants from the U.S. CHIPS Act, as of April 25, 2024. The CHIPS Act is a federal statute signed into law by President Joe Biden that authorizes $280 billion in new funding to boost domestic research and manufacturing of semiconductors.
The grant amounts visualized in this graphic are intended to accelerate the production of semiconductor fabrication plants (fabs) across the United States.
Data and Company Highlights
The figures we used to create this graphic were collected from a variety of public news sources. The Semiconductor Industry Association (SIA) also maintains a tracker for CHIPS Act recipients, though at the time of writing it does not have the latest details for Micron.
| Company | Federal Grant Amount | Anticipated Investment From Company |
|---|---|---|
| 🇺🇸 Intel | $8,500,000,000 | $100,000,000,000 |
| 🇹🇼 TSMC | $6,600,000,000 | $65,000,000,000 |
| 🇰🇷 Samsung | $6,400,000,000 | $45,000,000,000 |
| 🇺🇸 Micron | $6,100,000,000 | $50,000,000,000 |
| 🇺🇸 GlobalFoundries | $1,500,000,000 | $12,000,000,000 |
| 🇺🇸 Microchip | $162,000,000 | N/A |
| 🇬🇧 BAE Systems | $35,000,000 | N/A |
BAE Systems was not included in the graphic due to size limitations
Intel’s Massive Plans
Intel is receiving the largest share of the pie, with $8.5 billion in grants (plus an additional $11 billion in government loans). This grant accounts for 22% of the CHIPS Act’s total subsidies for chip production.
From Intel’s side, the company is expected to invest $100 billion to construct new fabs in Arizona and Ohio, while modernizing and/or expanding existing fabs in Oregon and New Mexico. Intel could also claim another $25 billion in credits through the U.S. Treasury Department’s Investment Tax Credit.
TSMC Expands its U.S. Presence
TSMC, the world’s largest semiconductor foundry company, is receiving a hefty $6.6 billion to construct a new chip plant with three fabs in Arizona. The Taiwanese chipmaker is expected to invest $65 billion into the project.
The plant’s first fab will be up and running in the first half of 2025, leveraging 4 nm (nanometer) technology. According to TrendForce, the other fabs will produce chips on more advanced 3 nm and 2 nm processes.
The Latest Grant Goes to Micron
Micron, the only U.S.-based manufacturer of memory chips, is set to receive $6.1 billion in grants to support its plans of investing $50 billion through 2030. This investment will be used to construct new fabs in Idaho and New York.

-

 Debt1 week ago
How Debt-to-GDP Ratios Have Changed Since 2000
-

 Markets2 weeks ago
Ranked: The World’s Top Flight Routes, by Revenue
-

 Countries2 weeks ago
Population Projections: The World’s 6 Largest Countries in 2075
-

 Markets2 weeks ago
The Top 10 States by Real GDP Growth in 2023
-

 Demographics2 weeks ago
The Smallest Gender Wage Gaps in OECD Countries
-

 United States2 weeks ago
Where U.S. Inflation Hit the Hardest in March 2024
-

 Green2 weeks ago
Top Countries By Forest Growth Since 2001
-

 United States2 weeks ago
Ranked: The Largest U.S. Corporations by Number of Employees