Technology
Which Companies Belong to the Elite Trillion-Dollar Club?


Which Companies Belong to the Elite Trillion-Dollar Club?
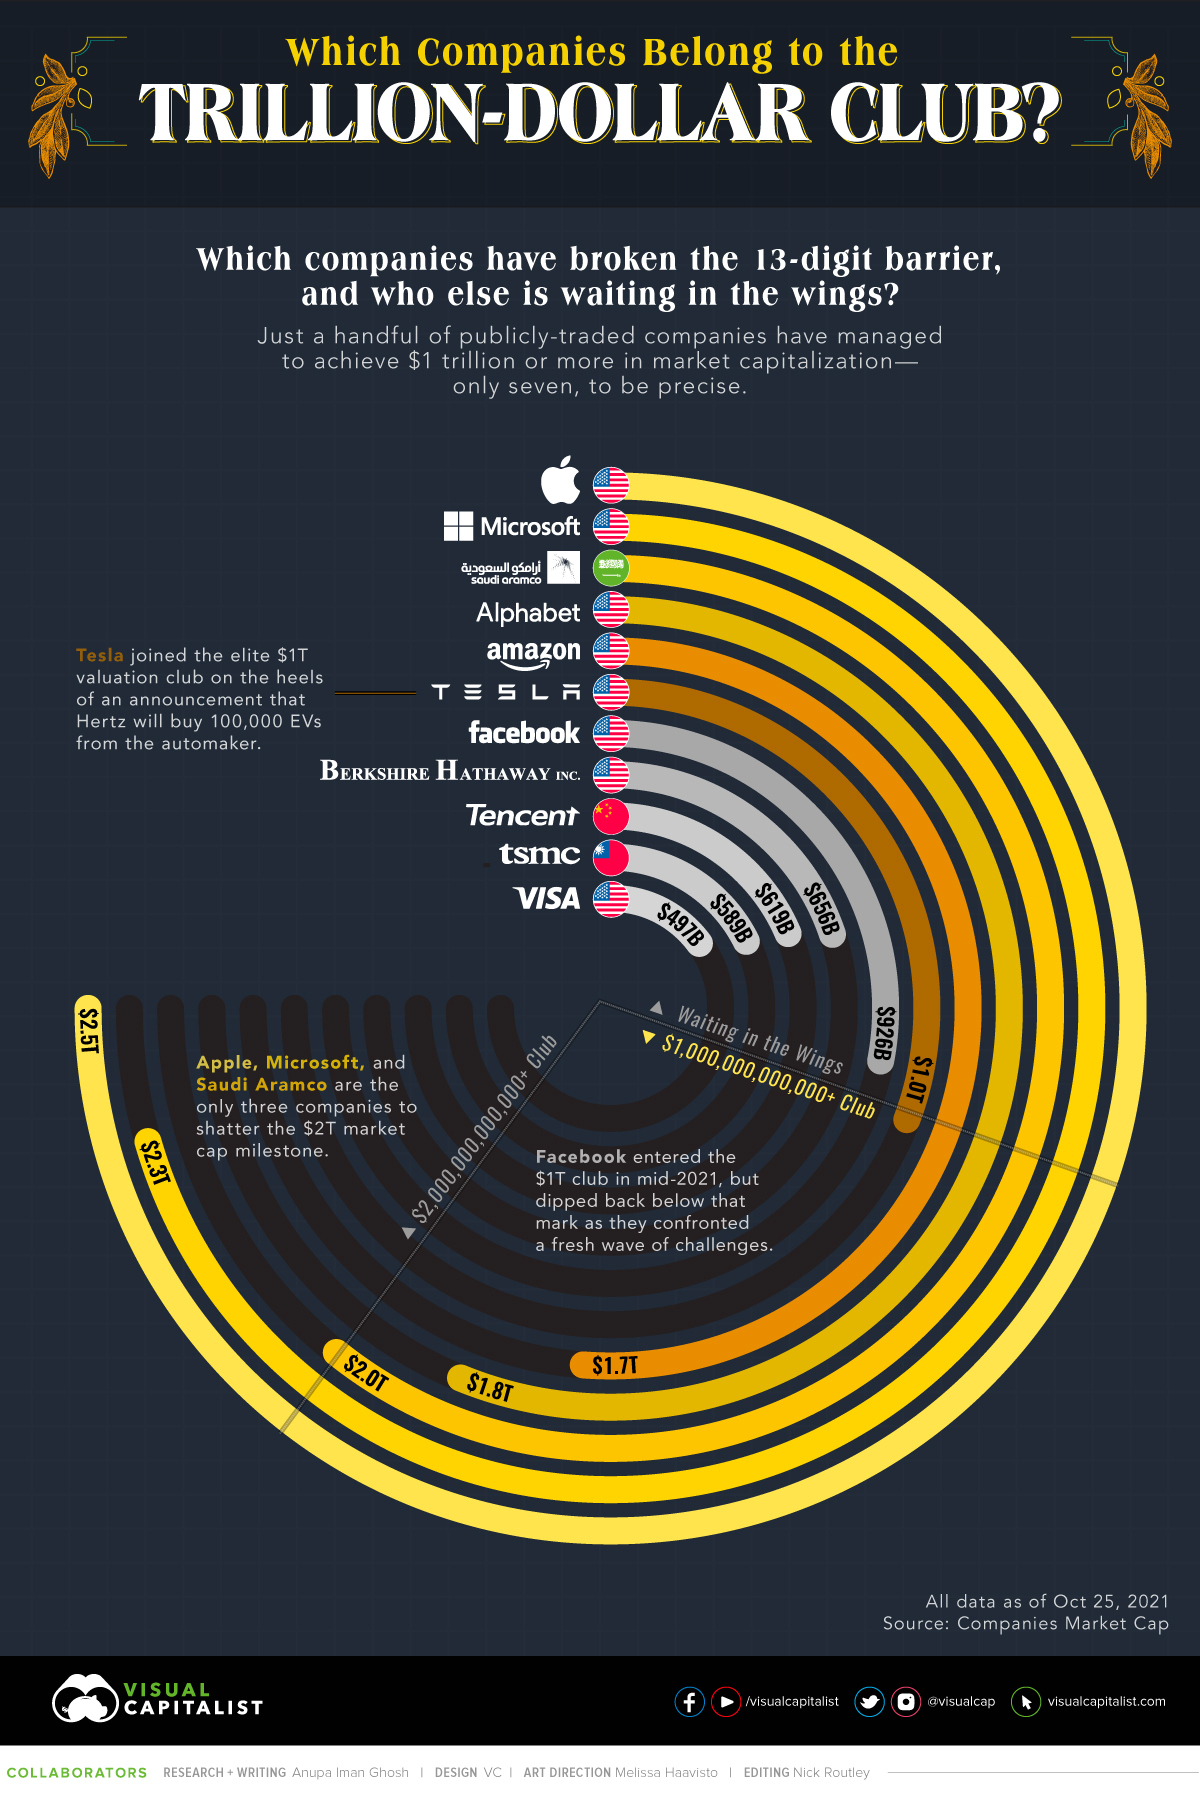
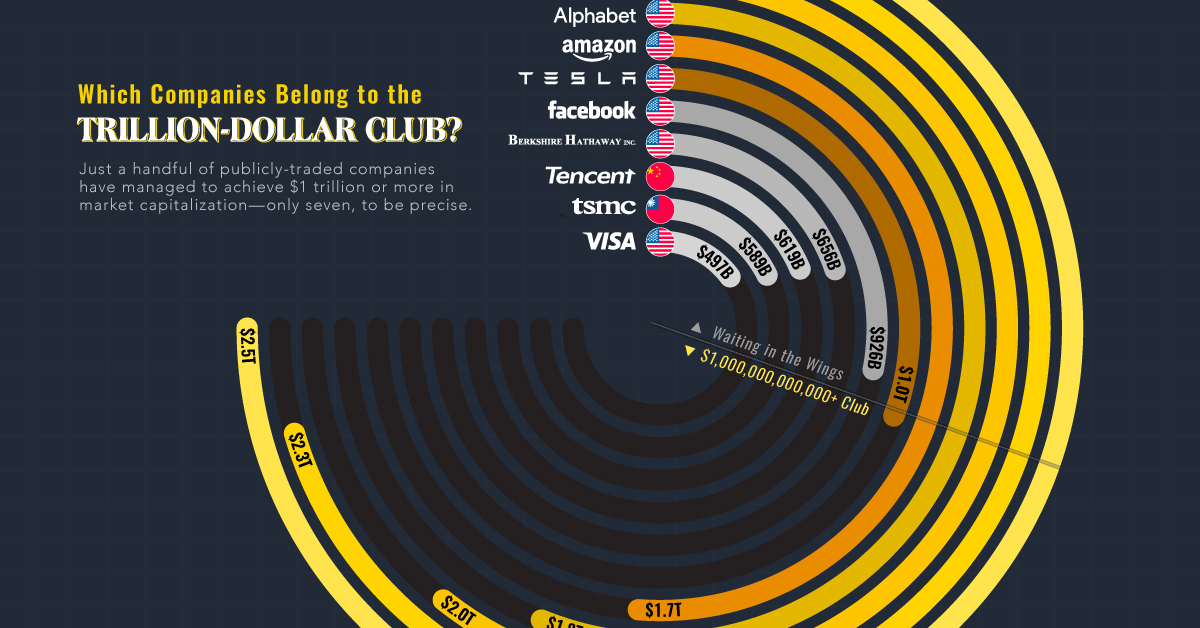
Just a handful of publicly-traded companies have managed to achieve $1 trillion or more in market capitalization—only seven, to be precise.
We pull data from Companies Market Cap to find out which familiar names are breaking the 13-digit barrier—and who else is waiting in the wings.
The Major Players in the Game
Apple, Microsoft, and Saudi Aramco are the three companies to have shattered the $2T market cap milestone to date, leaving others in the dust. Apple was also the first among its Big Tech peers to ascend to the $1 trillion landmark back in 2018.
| Company | Valuation | Country | Age of company |
|---|---|---|---|
| Apple | $2.46T | 🇺🇸 U.S. | 45 years (Founded 1976) |
| Microsoft | $2.31T | 🇺🇸 U.S. | 46 years (Founded 1975) |
| Saudi Aramco | $2.00T | 🇸🇦 Saudi Arabia | 88 years (Founded 1933) |
| Alphabet (Google) | $1.84T | 🇺🇸 U.S. | 23 years (Founded 1998) |
| Amazon | $1.68T | 🇺🇸 U.S. | 27 years (Founded 1994) |
| Tesla | $1.01T | 🇺🇸 U.S. | 18 years (Founded 2003) |
Footnote: Data is current as of October 25, 2021. Facebook is the 7th company historically to reach $1 trillion, but dipped out recently.
The largest oil and gas giant—Saudi Aramco is the only non-American company to make the trillion-dollar club. This makes it a notable outlier, as American companies typically dominate the leaderboard of the biggest corporations around the world.
Tesla Reaches $1 Trillion
Tesla reached the $1 trillion market cap for the first time due to a strong trading day on Monday October 25th. Their shares popped some 10%, off the announcement of some positive news from Hertz and Morgan Stanley.
First, Hertz, a car rental company, revealed an order for 100,000 Tesla vehicles — the largest order in the automaker’s history. Second, an auto analyst at Morgan Stanley made revisions and raised his price target on Tesla to $1,200.
Whether Tesla can stay a trillion dollar company will likely be a much discussed topic after today, as their valuation has always been a controversial one. Bearish investors frequently point to Tesla’s lack of fundamentals relative to traditional car companies. For instance, their market cap relative to cars sold:
| Company | Market Cap ($B) | Cars Sold (2020) | Value Per Car Sold | If Valued Like Tesla |
|---|---|---|---|---|
| Tesla | $1,000 | 500,000 | $2 million | $1.0 Trillion |
| Volkswagen | $148 | 9.3 million | $15,000 | $18.6 trillion |
| Toyota | $242 | 9.5 million | $25,000 | $19.0 trillion |
| Ford | $62 | 4.2 million | $14,000 | $8.4 trillion |
Based on the 500,000 cars Tesla sold in 2020, their $1 trillion market cap values them at $2 million per car sold. As an extreme example, if Volkswagen and Toyota were to be valued in a similar fashion, their market caps would be close to $19 trillion each. Larger than all of the elite trillion-dollar club combined.
Who Else Might Join the Trillion-Dollar Club?
Companies with a market capitalization above $500 billion are also few and far between. After Facebook, which until recently was part of the elite trillion-dollar club, Warren Buffet’s Berkshire Hathaway is the closest to joining the Four Comma Club. Though there’s still some ways to go, their market cap of $656 billion means shares would need to appreciate some 52%.
| Company | Valuation | Country | Age of company |
|---|---|---|---|
| $926B | 🇺🇸 U.S. | 17 years (Founded 2004) | |
| Berkshire Hathaway | $656B | 🇺🇸 U.S. | 182 years (Founded 1839) |
| TSMC | $619B | 🇹🇼 Taiwan | 34 years (Founded 1987) |
| Tencent | $589B | 🇨🇳 China | 23 years (Founded 1998) |
| Visa | $497B | 🇺🇸 U.S. | 63 years (Founded 1958) |
Visa, one of the pioneers of consumer credit in the United States, continues to innovate even 63 years after its founding. In attempts to expand the reach of its already massive payments ecosystem, Visa is experimenting with acquisitions, and even dipping its toes into cryptocurrency with some success.
Whether the next company to join the trillion-dollar club comes from the U.S., from the tech industry, or out of left field, it’s clear that it has some pretty big shoes to fill.


Technology
All of the Grants Given by the U.S. CHIPS Act
Intel, TSMC, and more have received billions in subsidies from the U.S. CHIPS Act in 2024.


All of the Grants Given by the U.S. CHIPS Act
This was originally posted on our Voronoi app. Download the app for free on iOS or Android and discover incredible data-driven charts from a variety of trusted sources.
This visualization shows which companies are receiving grants from the U.S. CHIPS Act, as of April 25, 2024. The CHIPS Act is a federal statute signed into law by President Joe Biden that authorizes $280 billion in new funding to boost domestic research and manufacturing of semiconductors.
The grant amounts visualized in this graphic are intended to accelerate the production of semiconductor fabrication plants (fabs) across the United States.
Data and Company Highlights
The figures we used to create this graphic were collected from a variety of public news sources. The Semiconductor Industry Association (SIA) also maintains a tracker for CHIPS Act recipients, though at the time of writing it does not have the latest details for Micron.
| Company | Federal Grant Amount | Anticipated Investment From Company |
|---|---|---|
| 🇺🇸 Intel | $8,500,000,000 | $100,000,000,000 |
| 🇹🇼 TSMC | $6,600,000,000 | $65,000,000,000 |
| 🇰🇷 Samsung | $6,400,000,000 | $45,000,000,000 |
| 🇺🇸 Micron | $6,100,000,000 | $50,000,000,000 |
| 🇺🇸 GlobalFoundries | $1,500,000,000 | $12,000,000,000 |
| 🇺🇸 Microchip | $162,000,000 | N/A |
| 🇬🇧 BAE Systems | $35,000,000 | N/A |
BAE Systems was not included in the graphic due to size limitations
Intel’s Massive Plans
Intel is receiving the largest share of the pie, with $8.5 billion in grants (plus an additional $11 billion in government loans). This grant accounts for 22% of the CHIPS Act’s total subsidies for chip production.
From Intel’s side, the company is expected to invest $100 billion to construct new fabs in Arizona and Ohio, while modernizing and/or expanding existing fabs in Oregon and New Mexico. Intel could also claim another $25 billion in credits through the U.S. Treasury Department’s Investment Tax Credit.
TSMC Expands its U.S. Presence
TSMC, the world’s largest semiconductor foundry company, is receiving a hefty $6.6 billion to construct a new chip plant with three fabs in Arizona. The Taiwanese chipmaker is expected to invest $65 billion into the project.
The plant’s first fab will be up and running in the first half of 2025, leveraging 4 nm (nanometer) technology. According to TrendForce, the other fabs will produce chips on more advanced 3 nm and 2 nm processes.
The Latest Grant Goes to Micron
Micron, the only U.S.-based manufacturer of memory chips, is set to receive $6.1 billion in grants to support its plans of investing $50 billion through 2030. This investment will be used to construct new fabs in Idaho and New York.

-

 Education1 week ago
How Hard Is It to Get Into an Ivy League School?
-

 Technology2 weeks ago
Ranked: Semiconductor Companies by Industry Revenue Share
-

 Markets2 weeks ago
Ranked: The World’s Top Flight Routes, by Revenue
-

 Demographics2 weeks ago
Population Projections: The World’s 6 Largest Countries in 2075
-

 Markets2 weeks ago
The Top 10 States by Real GDP Growth in 2023
-

 Demographics2 weeks ago
The Smallest Gender Wage Gaps in OECD Countries
-

 Economy2 weeks ago
Where U.S. Inflation Hit the Hardest in March 2024
-

 Green2 weeks ago
Top Countries By Forest Growth Since 2001