Markets
The History of Consumer Credit in One Giant Infographic
Consumer credit may seem like a fairly new invention – but it’s actually been around for more than 5,000 years!
In fact, many millennia before the credit score became ubiquitous, there is historical evidence that cultures around the world were borrowing for various reasons. From the writings in Hammurabi’s Code to the exchanges documented by the Ancient Romans, we know that credit was used for purposes such as getting enough silver to buy a property or for agricultural loans made to farmers.
Consumer Credit: 3,500 B.C. to Today
In today’s infographic from Equifax, we look at the long history of consumer credit – everything from the earliest writings of antiquity to the modern credit boom that started in the 20th century.


Consumer credit has evolved considerably from the early days.
Over the course of several millennia, there have been credit booms, game-changing innovations, and even periods such as the Dark Ages when the practice of charging interest (also known as “usury”) was considered immoral by some people.
A Timeline of Consumer Credit
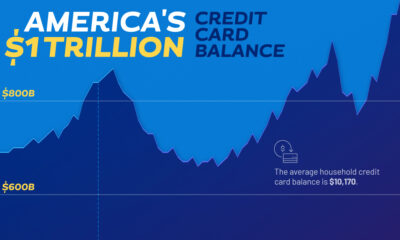
Below is a timeline of the significant events that have helped lead to the modern consumer credit boom, in which Americans now have over $12.4 trillion borrowed through mortgages, credit cards, student loans, auto loans, and other types of credit.
The Ancients and Credit
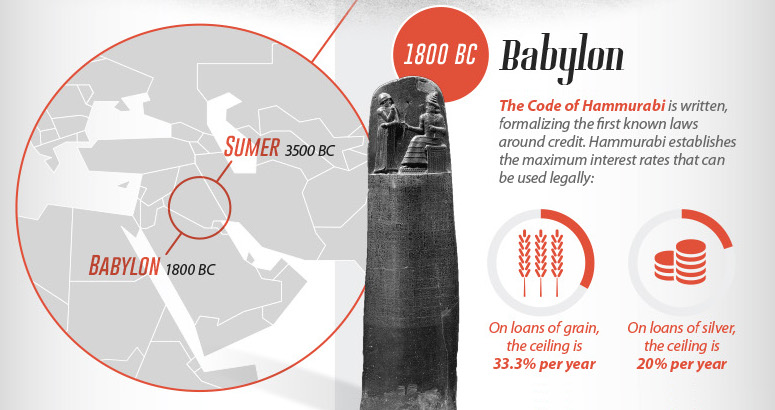
3,500 BC – Sumer
Sumer was the first urban civilization – with about 89% of its population living in cities. It is thought that here consumer loans, used for agricultural purposes, were first used.
1,800 BC – Babylon
The Code of Hammurabi was written, formalizing the first known laws around credit. Hammurabi established the maximum interest rates that could be used legally: 33.3% per year on loans of grain, and 20% per year on loans of silver. To be valid, loans had to be witnessed by a public official and recorded as a contract.
50 BC – The Roman Republic
Around this time, Cicero noted that his neighbor bought 625 acres of land for 11.5 million sesterces.
Did this person literally carry 11.5 tons of coins through the streets of Rome? No, it was done through credit and paper. Cicero writes “nomina facit, negotium conficit” – or, “he uses credit to complete the purchase”.
Moral Concerns About Lending
800 – The Dark Ages in Europe
After the collapse of the Western Roman Empire, economic activity grinded to a halt. The Church even banned usury, the practice of charging interest on loans, for all laymen under Charlemagne’s rule (768-814 AD).
1500 – The Age of Discovery
As European explorers and merchants begin trade missions to faraway lands, the need for capital and credit increases.
1545 – England
After the Reformation, the first country to establish a legal rate of interest was England in 1545 during the reign of Henry VIII. The rate was set at 10%.
1787 – England
Philosopher Jeremy Bentham writes a treatise called “A Defense of Usury”, arguing that restrictions on interest rates harm the ability to raise capital for innovation. If risky, new ventures cannot be funded, then growth becomes limited.
The Birth of Modern Consumer Credit
1803 – England
Credit reporting itself originated in England in the early 19th century. The earliest available account is that of a group of English tailors that came together to swap information on customers who failed to settle their debts.
1826 – England
The Manchester Guardian Society is formed, and later begins issuing a monthly newsletter with information about people who fail to pay their debts.
1841 – New York
The Mercantile Agency is founded, and starts systemizing rumors about the character and assets held by debtors through a network of correspondents. Massive ledgers in New York City are made, though these reports were heavily subjective and biased.
1864 – New York
The Mercantile Agency is renamed the R. G. Dun and Company on the eve of the Civil War, and finalizes an alphanumeric system for tracking creditworthiness of companies that would remain in use until the twentieth century.
1899 – Atlanta
The Retail Credit Company was founded, and begins compiling an extensive list of creditworthy customers. Later on, the company would change its name to Equifax. Today, it is the oldest of the three major credit agencies today in the United States.
The Consumer Credit Boom
1908 – Detroit
Henry Ford’s Model T makes automobiles accessible to the “great multitude” of people, but they were still too expensive to buy with cash for most families.
1919 – Detroit
GM solves this problem by loaning consumers the money they need to buy a new car. General Motors Acceptance Corporation (GMAC) is founded and popularizes the idea of installment plan financing. Consumers can now get a new car with just a 35% downpayment at time of financing.
1930 – United States
By this time, efficient U.S. factories are pumping out cheaper consumer products and appliances. Following the lead of GM, now washing machines, furniture, refrigerators, phonographs, and radios can be bought on installment plans. It’s also worth noting that in this period, 2/3 of all autos are bought on installment plans.
The First in Big Data
1950 – United States
By 1950, typical middle-class Americans already had revolving credit accounts at different merchants. Maintaining several different cards and monthly payments was inconvenient, and created a new opportunity.
At the same time, Diners Club introduces their charge card, which helps open the floodgates for other consumer credit products.
1955 – United States
Early credit reporters use millions of index cards, sorted in a massive filing system, to keep track of consumers around the country. To get the latest information, agencies would scour local newspapers for notices of arrests, promotions, marriages, and deaths, attaching this information to individual credit files.
1958 – United States
BankAmericard (now Visa) is “dropped” in Fresno, California. American Express and Mastercard soon follow, offering Americans general credit for a wide range of purchases.
1960 – United States
At a time when the technology was limited to filing cabinets, the postage meter, and the telephone, American credit bureaus issued 60 million credit reports in a single year.
1964– United States
The Association of Credit Bureaus in the U.S. conducts the first studies into the application of computer technologies to credit reporting. Accuracy of data is also improved around this time by standardizing credit application forms.
1970 – United States
The first Fair Credit Reporting Act is passed in the United States. It establishes a standard legal framework for credit reporting agencies.
1980s – United States
The three biggest credit bureaus attain universal coverage across the country.
1989 – United States
The FICO score is introduced, and quickly becomes a standard system to measure credit scores based on objective factors and data.
2006 – United States
VantageScore is created through a joint-venture between the top three credit scoring agencies. This new consumer credit-scoring model is used by 10% of the market, and 6 of the 10 largest banks use VantageScore.
Modern Credit
The Information Age has enabled a new era in consumer credit and assessing risk – and today, credit reports are used to inform decisions about housing, employment, insurance, and the cost of utilities.
Learn more about how data, the internet, and modern computing is changing credit in Part 2 of this series.


Markets
The European Stock Market: Attractive Valuations Offer Opportunities
On average, the European stock market has valuations that are nearly 50% lower than U.S. valuations. But how can you access the market?


European Stock Market: Attractive Valuations Offer Opportunities
Europe is known for some established brands, from L’Oréal to Louis Vuitton. However, the European stock market offers additional opportunities that may be lesser known.
The above infographic, sponsored by STOXX, outlines why investors may want to consider European stocks.
Attractive Valuations
Compared to most North American and Asian markets, European stocks offer lower or comparable valuations.
| Index | Price-to-Earnings Ratio | Price-to-Book Ratio |
|---|---|---|
| EURO STOXX 50 | 14.9 | 2.2 |
| STOXX Europe 600 | 14.4 | 2 |
| U.S. | 25.9 | 4.7 |
| Canada | 16.1 | 1.8 |
| Japan | 15.4 | 1.6 |
| Asia Pacific ex. China | 17.1 | 1.8 |
Data as of February 29, 2024. See graphic for full index names. Ratios based on trailing 12 month financials. The price to earnings ratio excludes companies with negative earnings.
On average, European valuations are nearly 50% lower than U.S. valuations, potentially offering an affordable entry point for investors.
Research also shows that lower price ratios have historically led to higher long-term returns.
Market Movements Not Closely Connected
Over the last decade, the European stock market had low-to-moderate correlation with North American and Asian equities.
The below chart shows correlations from February 2014 to February 2024. A value closer to zero indicates low correlation, while a value of one would indicate that two regions are moving in perfect unison.
| EURO STOXX 50 | STOXX EUROPE 600 | U.S. | Canada | Japan | Asia Pacific ex. China |
|
|---|---|---|---|---|---|---|
| EURO STOXX 50 | 1.00 | 0.97 | 0.55 | 0.67 | 0.24 | 0.43 |
| STOXX EUROPE 600 | 1.00 | 0.56 | 0.71 | 0.28 | 0.48 | |
| U.S. | 1.00 | 0.73 | 0.12 | 0.25 | ||
| Canada | 1.00 | 0.22 | 0.40 | |||
| Japan | 1.00 | 0.88 | ||||
| Asia Pacific ex. China | 1.00 |
Data is based on daily USD returns.
European equities had relatively independent market movements from North American and Asian markets. One contributing factor could be the differing sector weights in each market. For instance, technology makes up a quarter of the U.S. market, but health care and industrials dominate the broader European market.
Ultimately, European equities can enhance portfolio diversification and have the potential to mitigate risk for investors.
Tracking the Market
For investors interested in European equities, STOXX offers a variety of flagship indices:
| Index | Description | Market Cap |
|---|---|---|
| STOXX Europe 600 | Pan-regional, broad market | €10.5T |
| STOXX Developed Europe | Pan-regional, broad-market | €9.9T |
| STOXX Europe 600 ESG-X | Pan-regional, broad market, sustainability focus | €9.7T |
| STOXX Europe 50 | Pan-regional, blue-chip | €5.1T |
| EURO STOXX 50 | Eurozone, blue-chip | €3.5T |
Data is as of February 29, 2024. Market cap is free float, which represents the shares that are readily available for public trading on stock exchanges.
The EURO STOXX 50 tracks the Eurozone’s biggest and most traded companies. It also underlies one of the world’s largest ranges of ETFs and mutual funds. As of November 2023, there were €27.3 billion in ETFs and €23.5B in mutual fund assets under management tracking the index.
“For the past 25 years, the EURO STOXX 50 has served as an accurate, reliable and tradable representation of the Eurozone equity market.”
— Axel Lomholt, General Manager at STOXX
Partnering with STOXX to Track the European Stock Market
Are you interested in European equities? STOXX can be a valuable partner:
- Comprehensive, liquid and investable ecosystem
- European heritage, global reach
- Highly sophisticated customization capabilities
- Open architecture approach to using data
- Close partnerships with clients
- Part of ISS STOXX and Deutsche Börse Group
With a full suite of indices, STOXX can help you benchmark against the European stock market.
Learn how STOXX’s European indices offer liquid and effective market access.

-

 Economy3 days ago
Economic Growth Forecasts for G7 and BRICS Countries in 2024
The IMF has released its economic growth forecasts for 2024. How do the G7 and BRICS countries compare?
-

 Markets2 weeks ago
U.S. Debt Interest Payments Reach $1 Trillion
U.S. debt interest payments have surged past the $1 trillion dollar mark, amid high interest rates and an ever-expanding debt burden.
-

 United States2 weeks ago
Ranked: The Largest U.S. Corporations by Number of Employees
We visualized the top U.S. companies by employees, revealing the massive scale of retailers like Walmart, Target, and Home Depot.
-

 Markets2 weeks ago
The Top 10 States by Real GDP Growth in 2023
This graphic shows the states with the highest real GDP growth rate in 2023, largely propelled by the oil and gas boom.
-

 Markets2 weeks ago
Ranked: The World’s Top Flight Routes, by Revenue
In this graphic, we show the highest earning flight routes globally as air travel continued to rebound in 2023.
-

 Markets3 weeks ago
Ranked: The Most Valuable Housing Markets in America
The U.S. residential real estate market is worth a staggering $47.5 trillion. Here are the most valuable housing markets in the country.


-

 Debt1 week ago
How Debt-to-GDP Ratios Have Changed Since 2000
-
Markets2 weeks ago
Ranked: The World’s Top Flight Routes, by Revenue
-

 Countries2 weeks ago
Population Projections: The World’s 6 Largest Countries in 2075
-
Markets2 weeks ago
The Top 10 States by Real GDP Growth in 2023
-

 Demographics2 weeks ago
The Smallest Gender Wage Gaps in OECD Countries
-

 United States2 weeks ago
Where U.S. Inflation Hit the Hardest in March 2024
-

 Green2 weeks ago
Top Countries By Forest Growth Since 2001
-
United States2 weeks ago
Ranked: The Largest U.S. Corporations by Number of Employees