Markets
The World’s 50 Most Valuable Sports Teams
The World’s 50 Most Valuable Sports Teams
The Chart of the Week is a weekly Visual Capitalist feature on Fridays.
Every team’s general manager starts off with the same goal: to build a franchise that contends for championships year in and year out.
However, with the nature of the business being what it is, the odds are stacked against any team trying to achieve this. Out of close to 30 teams in most leagues, only one franchise can come out on top with a championship. And with unprecedented parity in most major leagues, every management decision is a crucial one. One smart draft choice or trade can put a team in a position to win, but a single mistake can also make a team a perennial bottom dweller.
Owners have a similar perspective, but they also want to build a franchise that is worth money in the long-run. To do that, they need to consider factors outside of winning: merchandise sales, sponsorships, costs, and other business decisions need to be made. They need to figure out how to capture the imagination of fans, and how to salvage the value of a franchise even when they are losing most games.
Today’s chart, using data from Forbes, is a hat tip to the teams that are lucky enough to count themselves among the most valuable in the world. Further, we also look at how the list has changed over time, and what happens to the valuations of franchises that are fortunate to be contenders on an ongoing basis.
What Makes a Team Valuable?
Multi-billion dollar sports teams don’t just grow on trees.
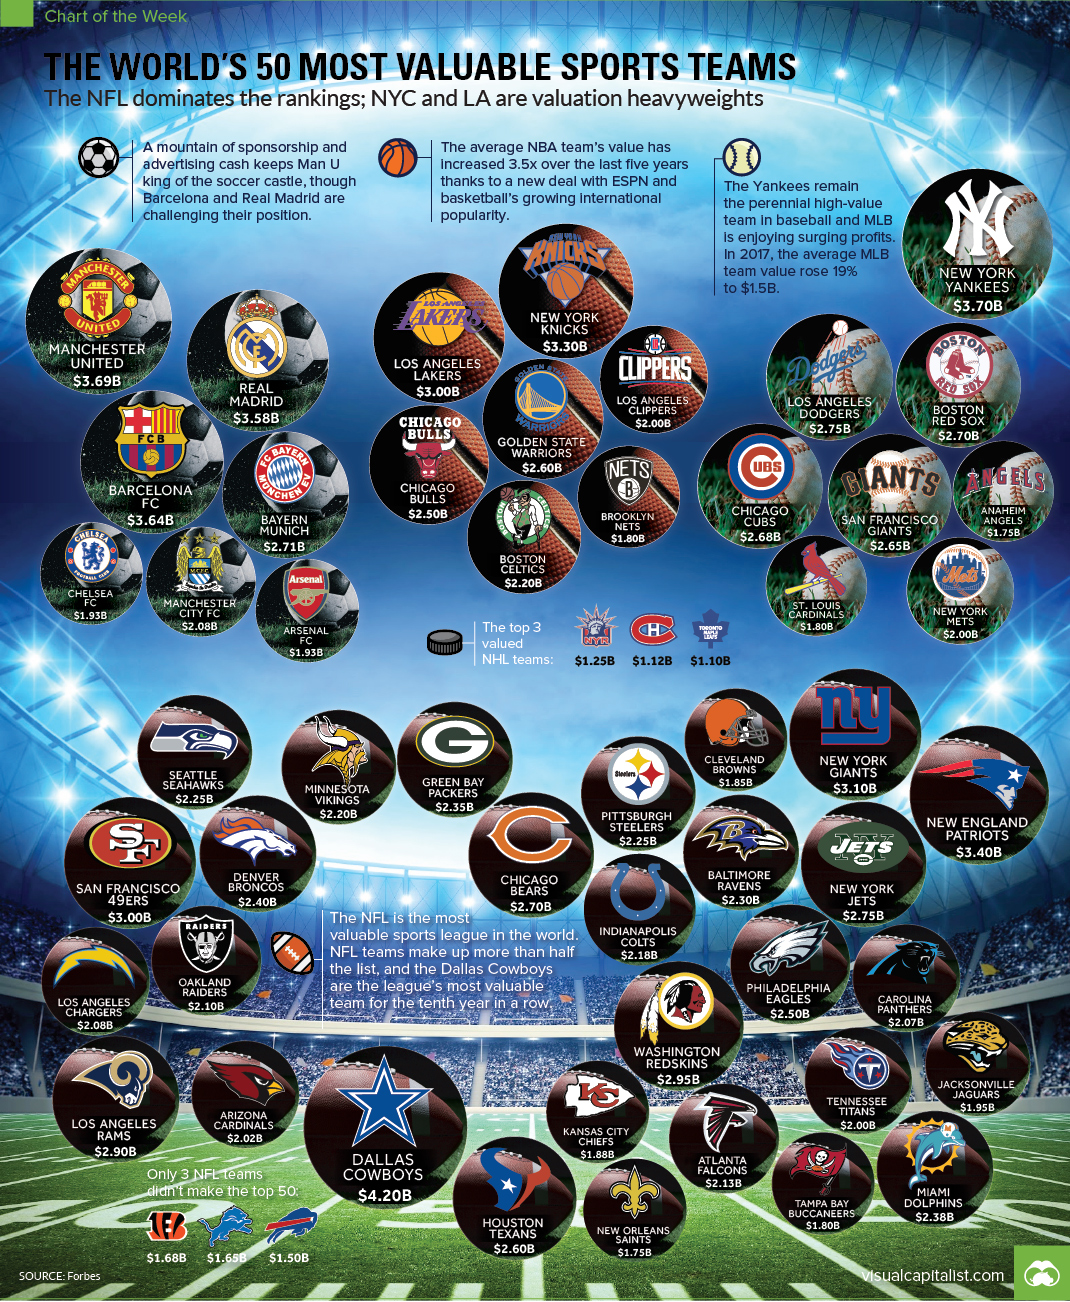
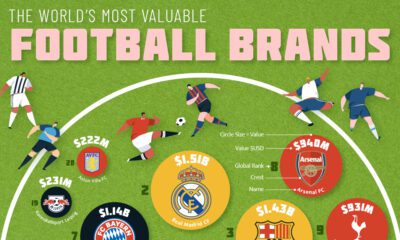
Instead, the massive value assigned to teams like the Dallas Cowboys or Manchester United is the culmination of a variety of important factors: market size, fan appeal, sport economics, international cross-over potential, profit, success, history, and many others.
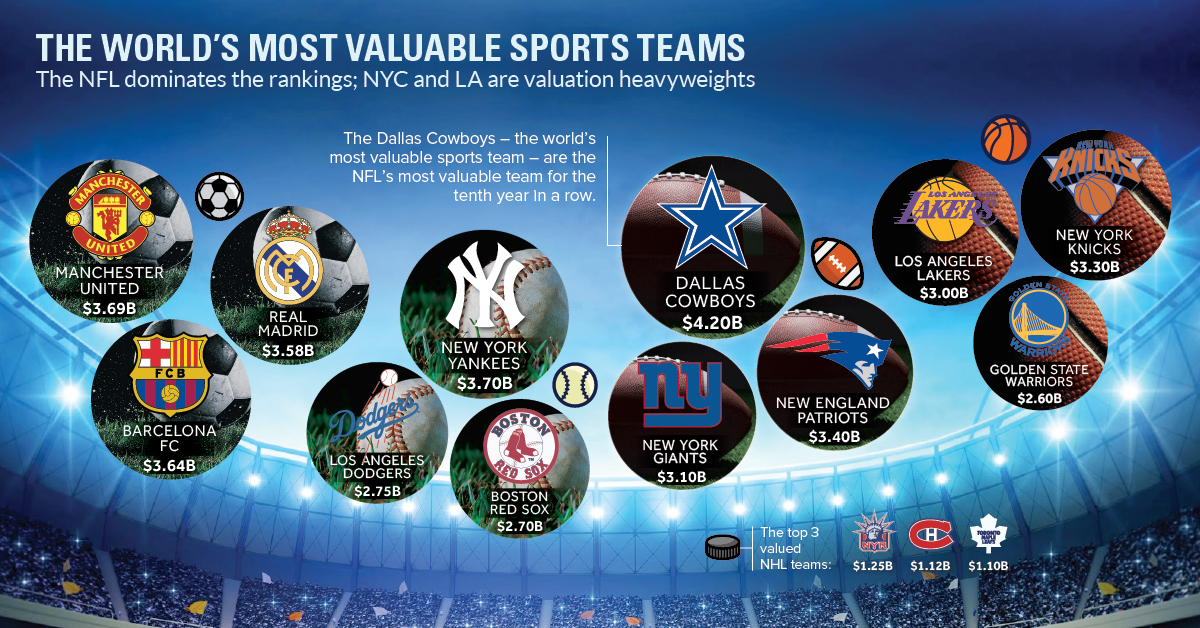
Here’s a Top 10 List of the world’s most valuable sports teams – and how that list has changed since 2010.
![]()
The ranking list has a few big takeaways on what is needed to become a valuation monster:
Market size matters:
New York and Los Angeles do very well for valuation, even without many recent championships. These places are home to millions of fans, as well as massive amounts of dollars to be made from sponsors and media rights.
Recent success helps:
The Patriots have made seven Super Bowl appearances since 2000, cementing the franchise as one of the most valuable sports teams in the world.
Recent failures hurt:
The Redskins haven’t won a playoff series since 2005 (Wildcard) – and partially as a result, they have fallen out of the Top 10 ranking for the most valuable sports teams in 2017.
History is a factor:
Manchester United hasn’t won the EPL in the last few years, but the club’s history speaks for itself. The Yankees have been mediocre in the last five years, but fans know they’ll be back eventually.
Sport economics are key:
Why are there so many NFL teams on the Top 50 list? The economics just work better, and it translates to team valuations.
Cross-over appeal:
What’s unique about Manchester United, the Yankees, or the Patriots? You’ll see people wearing their gear all around the world – they have rare cross-over appeal to international markets, and this means more dough.
Championships and Team Value
It’s clear that winning has a role in team value – but how big of a difference can it make?
Next, we’ll look at how value has changed for teams that have been particularly successful in recent years, like the Golden State Warriors, New England Patriots, and Chicago Blackhawks.
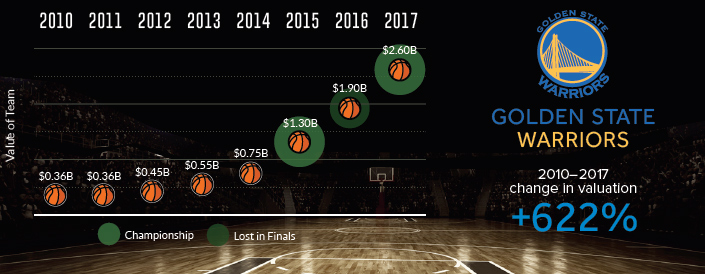
Golden State Warriors
The Warriors franchise is worth +622% more than it was back in 2010, thanks to recent success. The team has made the finals in each of the last three years – and they’ve taken home the Larry O’Brien NBA Championship Trophy twice.
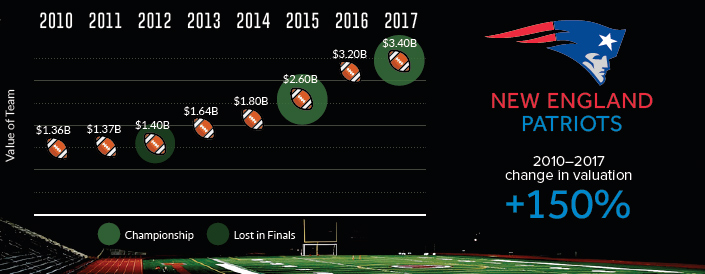
New England Patriots
Like other perennial champions, the Pats have their fair share of detractors. Team owner Robert Kraft likely doesn’t care though – his team is now worth $3.4 billion, a 150% increase in value since 2010. They also have the hardware to show for it.
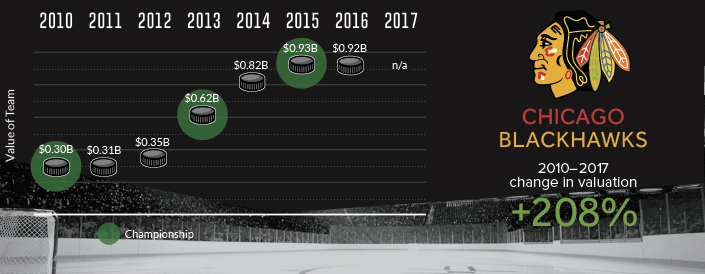
Chicago Blackhawks
Despite a storied history as an “Original 6” team in the NHL, the Blackhawks found themselves in a bit of a funk in the 2000s. That all changed in 2006 and 2007, when the Blackhawks drafted Jonathan Toews and Patrick Kane – and now the team has won three Stanley Cups since 2010.
Recent winning streaks do help – and championships translate to other value categories as well. Winning builds the team’s history and brand, converts bandwagon fans, and helps teams create an international presence.
Or as the late Al Davis often said, “Just win, baby.”
One Team Towns
To finish, here’s a final visualization that highlights the valuations of franchises in “One Team Towns” – cities in North America that each hold only one of the Big Four (NFL, NBA, MLB, NHL) franchises.
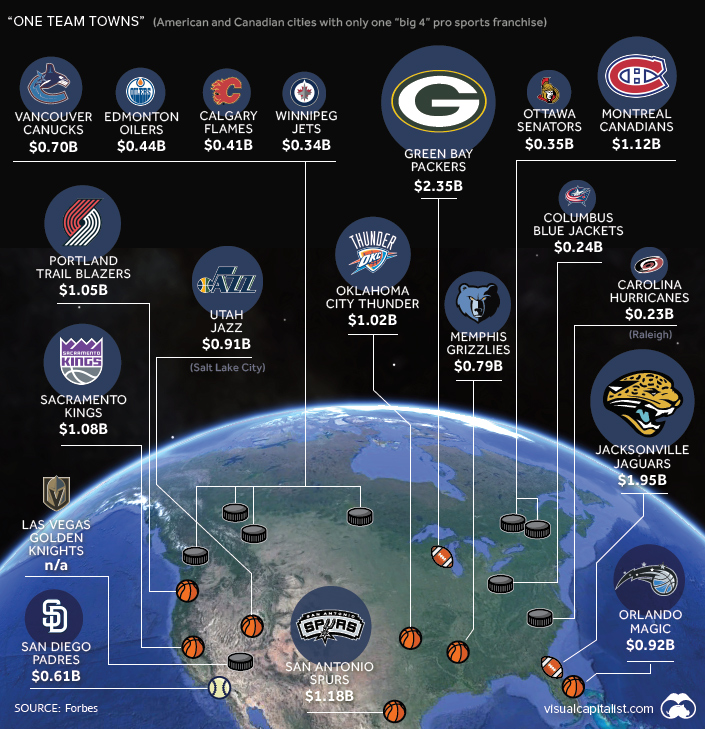
Of course, once the Raiders move to Las Vegas after their current lease expires, this map will change once again.


Economy
Economic Growth Forecasts for G7 and BRICS Countries in 2024
The IMF has released its economic growth forecasts for 2024. How do the G7 and BRICS countries compare?


G7 & BRICS Real GDP Growth Forecasts for 2024
The International Monetary Fund’s (IMF) has released its real gross domestic product (GDP) growth forecasts for 2024, and while global growth is projected to stay steady at 3.2%, various major nations are seeing declining forecasts.
This chart visualizes the 2024 real GDP growth forecasts using data from the IMF’s 2024 World Economic Outlook for G7 and BRICS member nations along with Saudi Arabia, which is still considering an invitation to join the bloc.
Get the Key Insights of the IMF’s World Economic Outlook
Want a visual breakdown of the insights from the IMF’s 2024 World Economic Outlook report?
This visual is part of a special dispatch of the key takeaways exclusively for VC+ members.
Get the full dispatch of charts by signing up to VC+.
Mixed Economic Growth Prospects for Major Nations in 2024
Economic growth projections by the IMF for major nations are mixed, with the majority of G7 and BRICS countries forecasted to have slower growth in 2024 compared to 2023.
Only three BRICS-invited or member countries, Saudi Arabia, the UAE, and South Africa, have higher projected real GDP growth rates in 2024 than last year.
| Group | Country | Real GDP Growth (2023) | Real GDP Growth (2024P) |
|---|---|---|---|
| G7 | 🇺🇸 U.S. | 2.5% | 2.7% |
| G7 | 🇨🇦 Canada | 1.1% | 1.2% |
| G7 | 🇯🇵 Japan | 1.9% | 0.9% |
| G7 | 🇫🇷 France | 0.9% | 0.7% |
| G7 | 🇮🇹 Italy | 0.9% | 0.7% |
| G7 | 🇬🇧 UK | 0.1% | 0.5% |
| G7 | 🇩🇪 Germany | -0.3% | 0.2% |
| BRICS | 🇮🇳 India | 7.8% | 6.8% |
| BRICS | 🇨🇳 China | 5.2% | 4.6% |
| BRICS | 🇦🇪 UAE | 3.4% | 3.5% |
| BRICS | 🇮🇷 Iran | 4.7% | 3.3% |
| BRICS | 🇷🇺 Russia | 3.6% | 3.2% |
| BRICS | 🇪🇬 Egypt | 3.8% | 3.0% |
| BRICS-invited | 🇸🇦 Saudi Arabia | -0.8% | 2.6% |
| BRICS | 🇧🇷 Brazil | 2.9% | 2.2% |
| BRICS | 🇿🇦 South Africa | 0.6% | 0.9% |
| BRICS | 🇪🇹 Ethiopia | 7.2% | 6.2% |
| 🌍 World | 3.2% | 3.2% |
China and India are forecasted to maintain relatively high growth rates in 2024 at 4.6% and 6.8% respectively, but compared to the previous year, China is growing 0.6 percentage points slower while India is an entire percentage point slower.
On the other hand, four G7 nations are set to grow faster than last year, which includes Germany making its comeback from its negative real GDP growth of -0.3% in 2023.
Faster Growth for BRICS than G7 Nations
Despite mostly lower growth forecasts in 2024 compared to 2023, BRICS nations still have a significantly higher average growth forecast at 3.6% compared to the G7 average of 1%.
While the G7 countries’ combined GDP is around $15 trillion greater than the BRICS nations, with continued higher growth rates and the potential to add more members, BRICS looks likely to overtake the G7 in economic size within two decades.
BRICS Expansion Stutters Before October 2024 Summit
BRICS’ recent expansion has stuttered slightly, as Argentina’s newly-elected president Javier Milei declined its invitation and Saudi Arabia clarified that the country is still considering its invitation and has not joined BRICS yet.
Even with these initial growing pains, South Africa’s Foreign Minister Naledi Pandor told reporters in February that 34 different countries have submitted applications to join the growing BRICS bloc.
Any changes to the group are likely to be announced leading up to or at the 2024 BRICS summit which takes place October 22-24 in Kazan, Russia.
Get the Full Analysis of the IMF’s Outlook on VC+
This visual is part of an exclusive special dispatch for VC+ members which breaks down the key takeaways from the IMF’s 2024 World Economic Outlook.
For the full set of charts and analysis, sign up for VC+.

-

 Markets1 week ago
U.S. Debt Interest Payments Reach $1 Trillion
-

 Markets2 weeks ago
Ranked: The Most Valuable Housing Markets in America
-

 Money2 weeks ago
Which States Have the Highest Minimum Wage in America?
-

 AI2 weeks ago
Ranked: Semiconductor Companies by Industry Revenue Share
-

 Markets2 weeks ago
Ranked: The World’s Top Flight Routes, by Revenue
-

 Countries2 weeks ago
Population Projections: The World’s 6 Largest Countries in 2075
-

 Markets2 weeks ago
The Top 10 States by Real GDP Growth in 2023
-

 Money2 weeks ago
The Smallest Gender Wage Gaps in OECD Countries