Gold
Visualizing the Real Value of the Minimum Wage
Visualizing the Real Value of the Minimum Wage
The minimum wage has often been a contentious issue, and in 2017 the debate shows no sign of wearing.
On the one hand, there are many people struggling to make ends meet, and a higher minimum wage could certainly impact the 10 million working poor spread throughout the country. Not only would it help some of these workers sustain better living standards, but some research also shows that an increase can actually help certain types of businesses, and that job losses from a higher wage are usually minimal.
From another angle, however, many economists see a higher minimum wage as any other supply and demand situation. Arbitrarily raising the price of labor limits the demand for that labor – and in places like Seattle, recent studies have shown that the minimum wage increase is hurting the people it is supposed to help.
To complicate things even further, the prospect of increased automation in the workplace is also a factor that affects these outcomes.
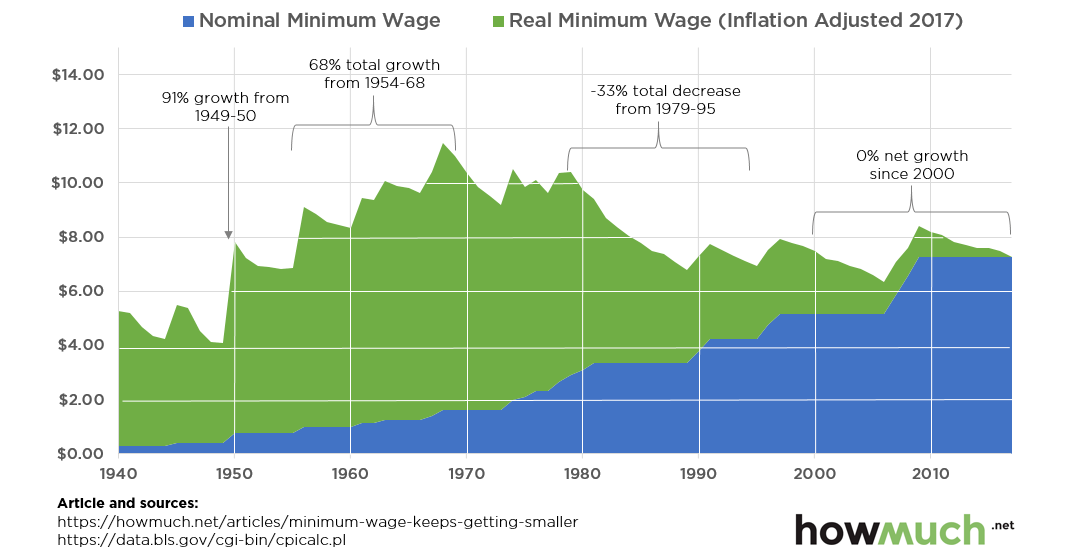
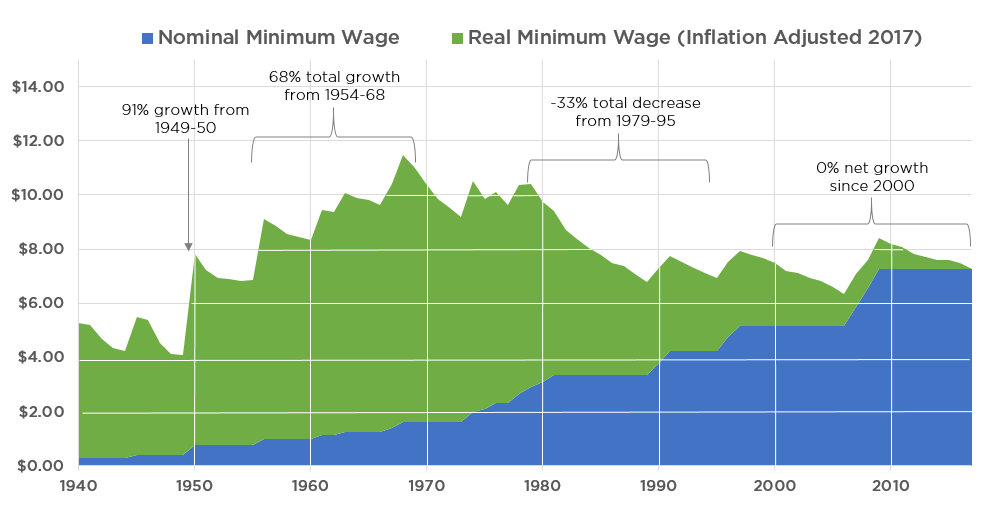
The Real Minimum Wage in Context
Putting this debate aside, today’s visualization from cost information site HowMuch.net reveals some interesting points to consider about the minimum wage, which help put the numbers in context.
By adjusting the minimum wage for the Consumer Price Index (CPI) over time, it shows that in the last 25 years there has been no real increase in the minimum wage. Inflation has quickly erased any adjustments, keeping it stagnant for years.
Further, in real terms, the minimum wage peaked in value in 1968, just before Nixon severed the connection between the dollar and gold. In the inflationary years that followed, the real minimum wage eventually dropped to $6.77, a staggering 41.0% decrease. The real wage has basically hovered between $6.50 and $8.00 ever since.
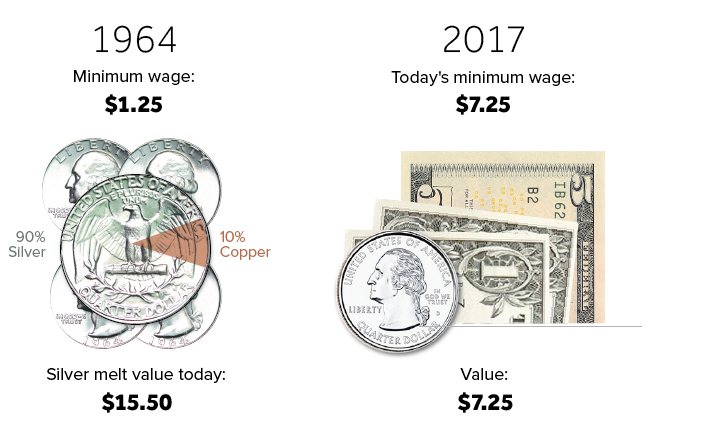
Precious metals advocates make an important point about this: the minimum wage in nominal terms in 1964 was $1.25, or five silver quarters. If you were to cash in that silver today (~$17.15 per oz), the melt value would be $15.50, which is actually double the current minimum wage.
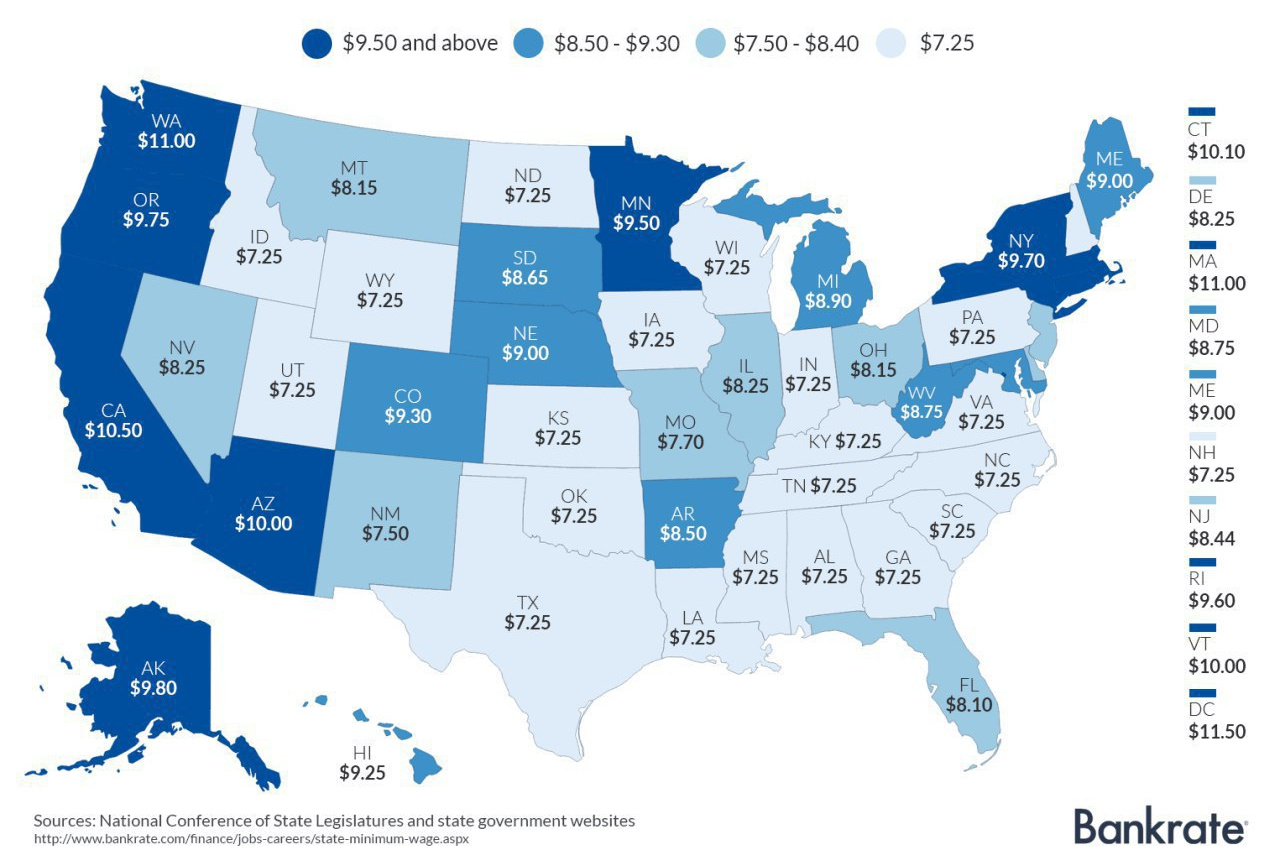
Action at State and City Levels
Today, the majority of U.S. states have higher minimum wages than the federal amount of $7.25.
States with the highest minimum wages include Washington ($11.00), Massachusetts ($11.00), California ($10.50), Vermont ($10.00), Arizona ($10.00), and Connecticut ($10.00). Washington, D.C. also has its minimum set at $11.50.
Here are the 29 states that have higher minimums, according to Bankrate.com:
And here are the upcoming schedules for the minimum wage increases in some major cities, including Los Angeles, Seattle, and New York City.
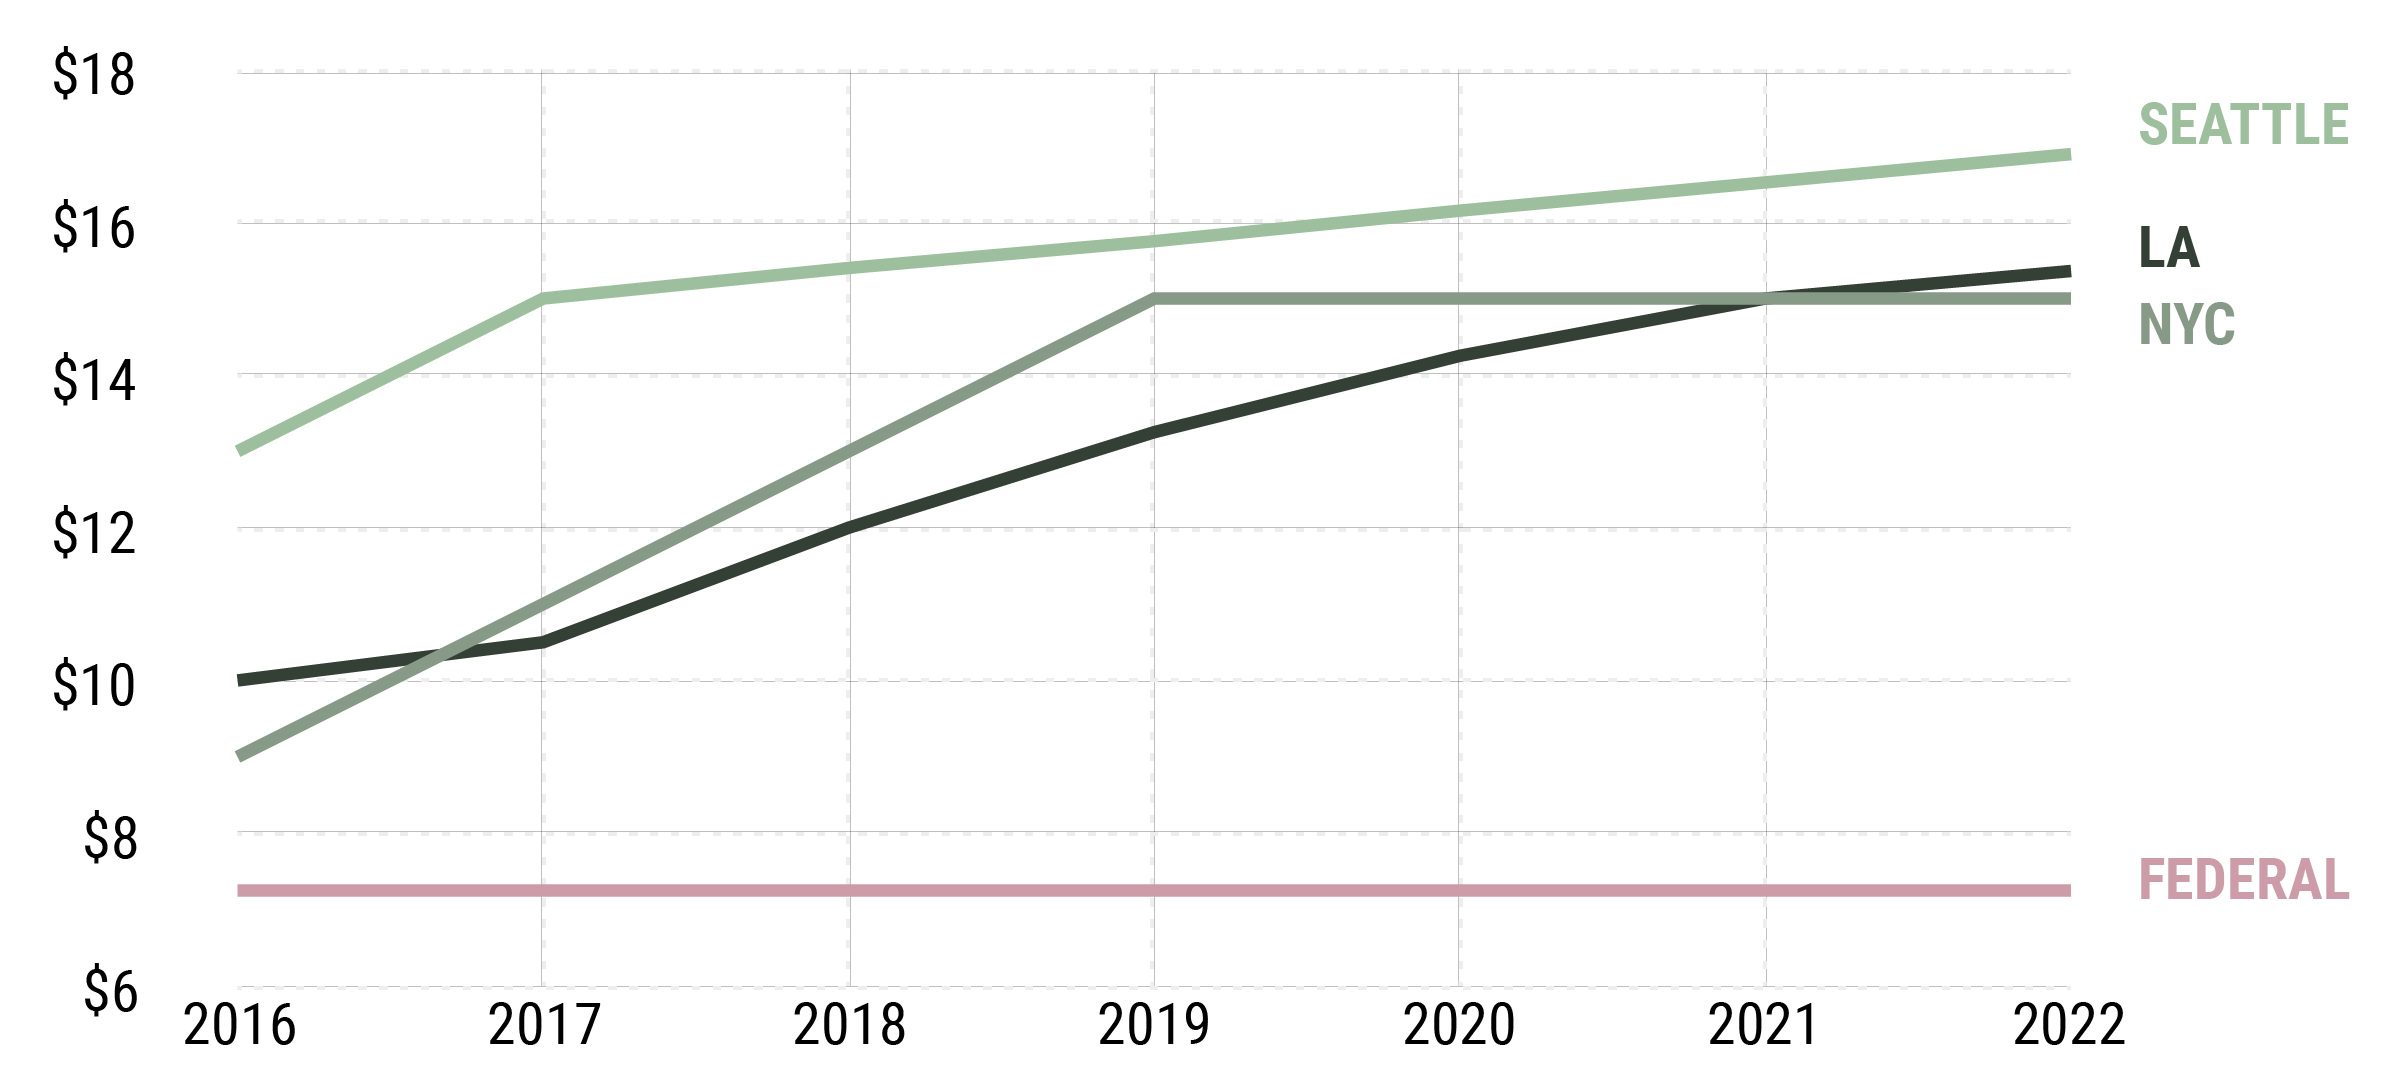
By 2025, the highly-debated Seattle minimum wage is anticipated to hit $18.00 for all types of businesses.


Mining
Gold vs. S&P 500: Which Has Grown More Over Five Years?
The price of gold has set record highs in 2024, but how has this precious metal performed relative to the S&P 500?

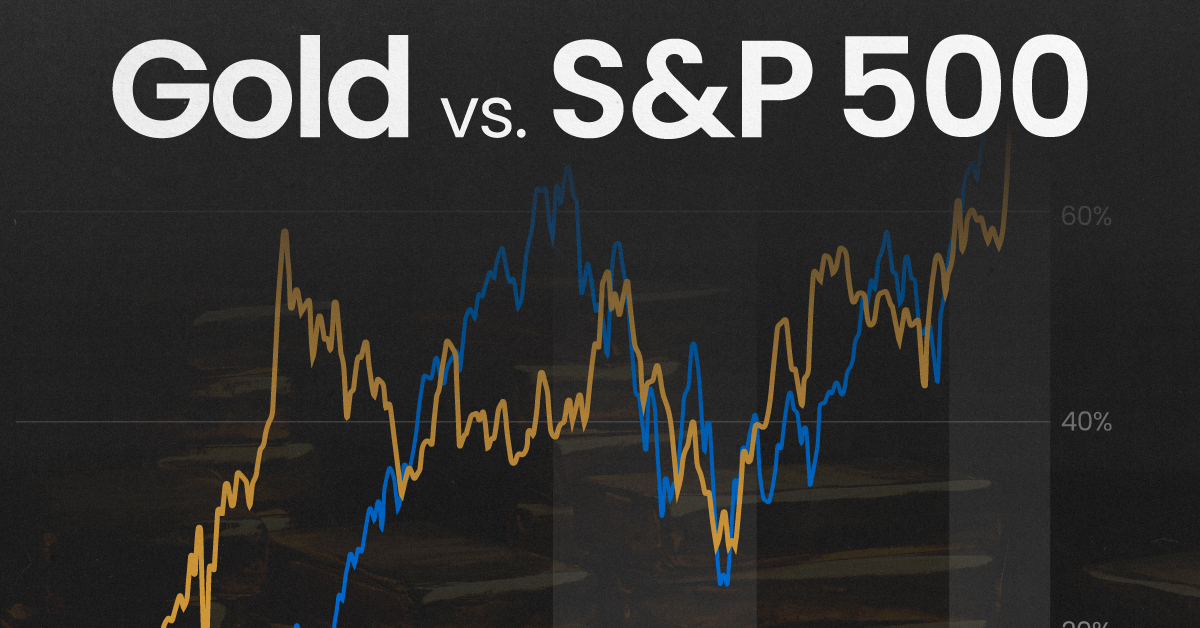
Gold vs. S&P 500: Which Has Grown More Over Five Years?
This was originally posted on our Voronoi app. Download the app for free on Apple or Android and discover incredible data-driven charts from a variety of trusted sources.
Gold is considered a unique asset due to its enduring value, historical significance, and application in various technologies like computers, spacecraft, and communications equipment.
Commonly regarded as a “safe haven asset”, gold is something investors typically buy to protect themselves during periods of global uncertainty and economic decline.
It is for this reason that gold has performed rather strongly in recent years, and especially in 2024. Persistent inflation combined with multiple wars has driven up demand for gold, helping it set a new all-time high of over $2,400 per ounce.
To put this into perspective, we visualized the performance of gold alongside the S&P 500. See the table below for performance figures as of April 12, 2024.
| Asset/Index | 1 Yr (%) | 5 Yr (%) |
|---|---|---|
| 🏆 Gold | +16.35 | +81.65 |
| 💼 S&P 500 | +25.21 | +76.22 |
Over the five-year period, gold has climbed an impressive 81.65%, outpacing even the S&P 500.
Get Your Gold at Costco
Perhaps a sign of how high the demand for gold is becoming, wholesale giant Costco is reportedly selling up to $200 million worth of gold bars every month in the United States. The year prior, sales only amounted to $100 million per quarter.
Consumers aren’t the only ones buying gold, either. Central banks around the world have been accumulating gold in very large quantities, likely as a hedge against inflation.
According to the World Gold Council, these institutions bought 1,136 metric tons in 2022, marking the highest level since 1950. Figures for 2023 came in at 1,037 metric tons.
See More Graphics on Gold
If you’re fascinated by gold, be sure to check out more Visual Capitalist content including 200 Years of Global Gold Production, by Country or Ranked: The Largest Gold Reserves by Country.

-

 Travel1 week ago
Airline Incidents: How Do Boeing and Airbus Compare?
-

 Markets2 weeks ago
Visualizing America’s Shortage of Affordable Homes
-

 Green2 weeks ago
Ranked: Top Countries by Total Forest Loss Since 2001
-

 Money2 weeks ago
Where Does One U.S. Tax Dollar Go?
-

 Misc2 weeks ago
Almost Every EV Stock is Down After Q1 2024
-

 AI2 weeks ago
The Stock Performance of U.S. Chipmakers So Far in 2024
-

 Markets2 weeks ago
Charted: Big Four Market Share by S&P 500 Audits
-

 Real Estate2 weeks ago
Ranked: The Most Valuable Housing Markets in America