Markets
How Factor Investing Works, Using Everyday Examples
Factor Investing: How You May Experience it
Why do investments perform the way they do? This is a question many investment experts have been attempting to answer for years. Luckily, factor investing can provide investors with a data-driven understanding.
In this infographic from MSCI, we use scenarios from everyday life to explain how factor investing works.
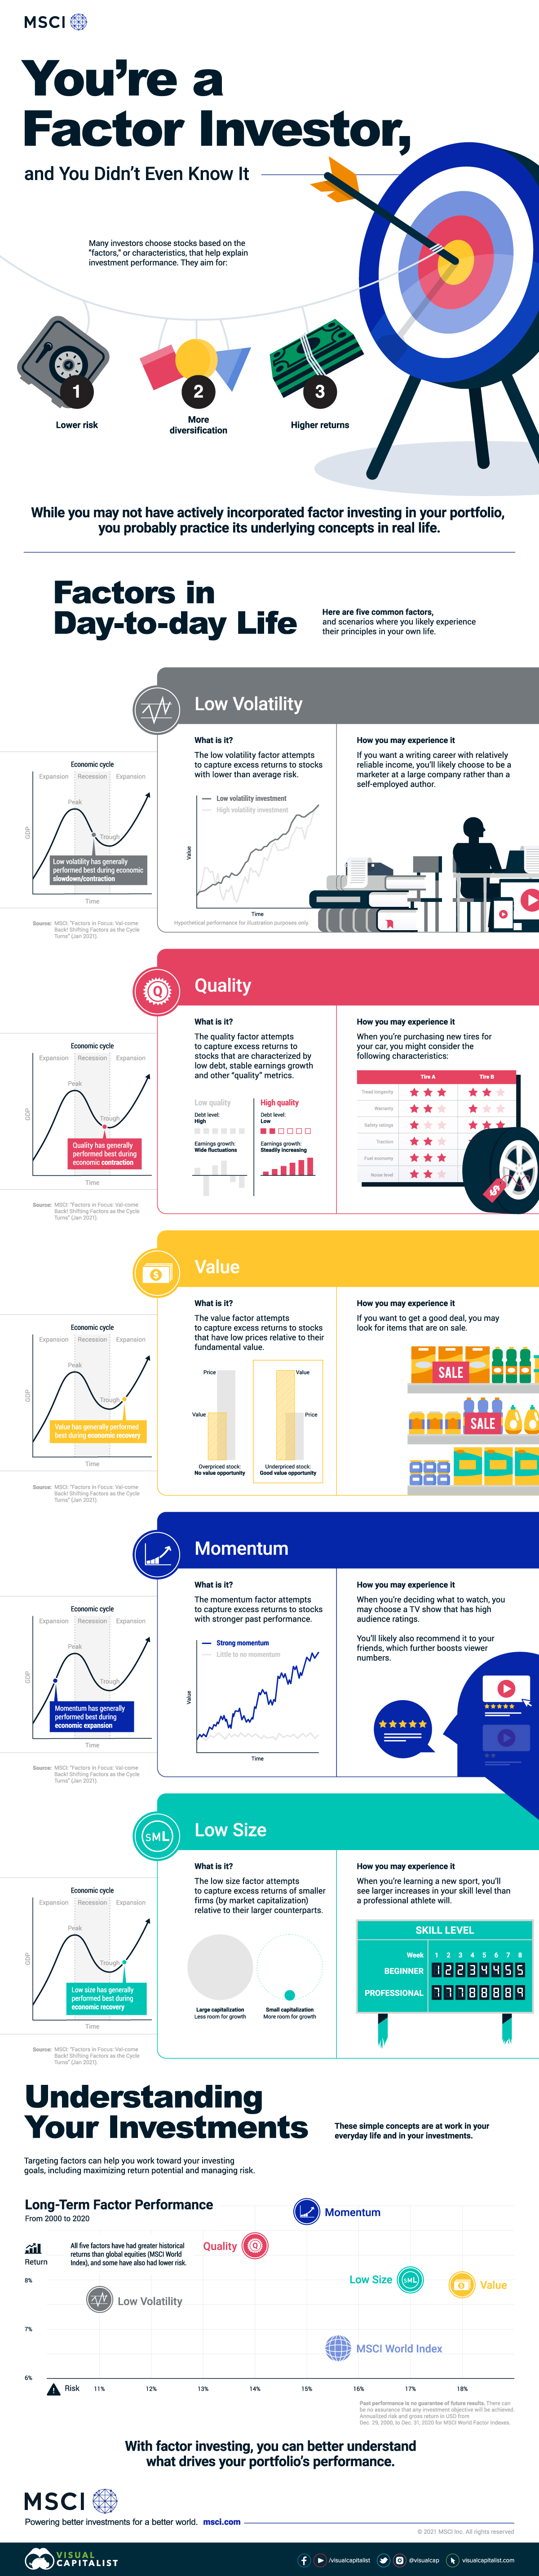
What is Factor Investing?
Simply put, investors choose stocks based on the “factors”, or characteristics, that help explain investment performance. They are typically aiming for:
- Higher returns
- Lower risk
- More diversification
While you may not have actively incorporated factor investing in your current portfolio, almost everyone will be familiar with the underlying concepts in real life. Here are five common factors and scenarios where you likely experience their principles.
1. Low Volatility Factor
The low volatility factor attempts to capture excess returns to stocks with lower than average risk. This factor has generally performed best during economic slowdowns or contractions.
How you may experience it: If you want a writing career with relatively reliable income, you’ll likely choose to be a marketer at a large company rather than a self-employed author.
2. Quality Factor
The quality factor attempts to capture excess returns in shares of companies that are characterized by low debt, stable earnings growth, and other “quality” metrics. This factor has generally performed best during economic contractions.
How you may experience it: When you’re purchasing new tires for your car, you might consider characteristics like tread longevity, traction, and fuel economy.
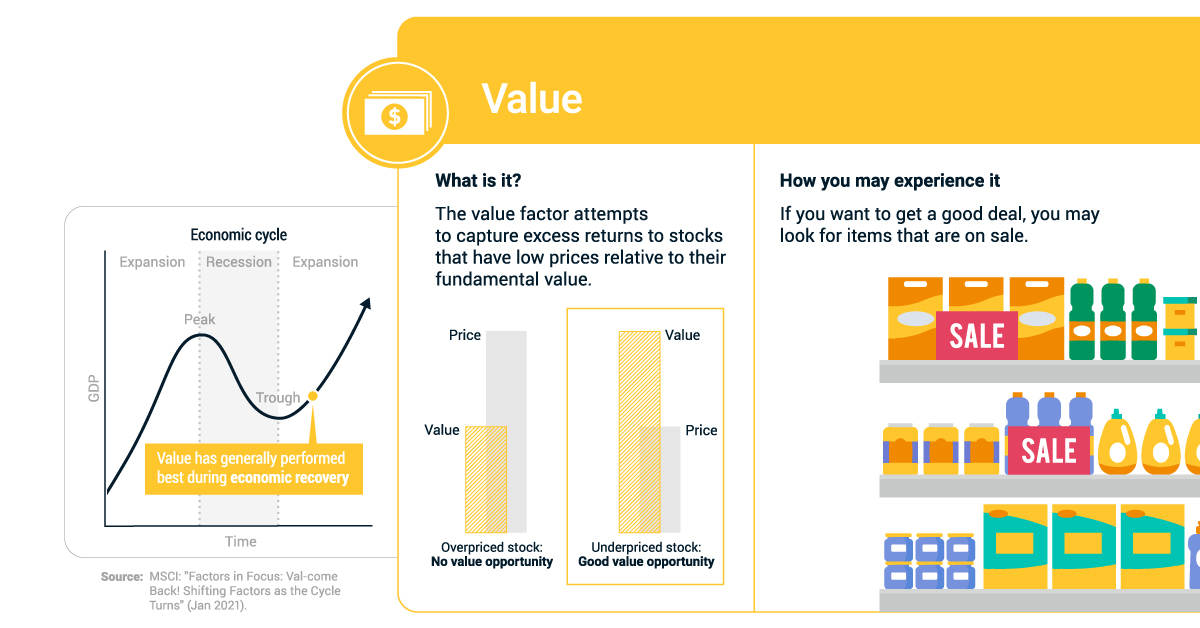
3. Value Factor
The value factor attempts to capture excess returns to stocks that have low prices relative to their fundamental value. This factor has generally performed best during economic recoveries.
How you may experience it: If you want a good deal, you may look for items that are on sale.
4. Momentum Factor
The momentum factor attempts to capture excess returns to stocks with stronger past performance. It has generally performed best during economic expansions.
How you may experience it: When you’re deciding what to watch, you may choose a TV show that has high audience ratings. You’ll likely also recommend it to your friends, which further boosts viewer numbers.
5. Low Size Factor
The low size factor attempts to capture excess returns of smaller firms (by market capitalization) relative to their larger counterparts. It has generally performed best during economic recoveries.
How you may experience it: When you’re learning a new sport, you’ll see larger increases in your skill level than a professional athlete will.
Understanding Your Investments With Factor Investing
These simple concepts are at work in your everyday life and in your investments. Targeting these factors can help you meet your investing goals, including maximizing return potential and managing risk.
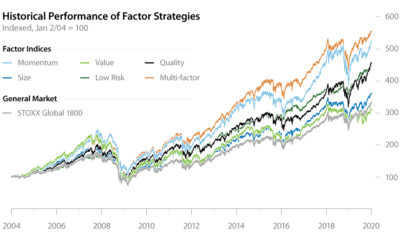
From 2000 to 2020, here’s how the risk and return of the above factors compared to the benchmark MSCI World Index.
| Return | Risk | |
|---|---|---|
| Momentum | 9.4% | 14.8% |
| Quality | 8.7% | 13.9% |
| Low Size | 8.0% | 17.0% |
| Value | 7.9% | 17.9% |
| Low Volatility | 7.6% | 11.1% |
| MSCI World Index | 6.6% | 15.6% |
Annualized risk and gross returns in USD from December 29 2000 to December 31 2020 for MSCI World Factor Indexes.
All five of the factors have had greater historical returns than the benchmark index, and some have also had lower risk.
With factor investing, you can better understand what drives your portfolio’s performance.

Markets
U.S. Debt Interest Payments Reach $1 Trillion
U.S. debt interest payments have surged past the $1 trillion dollar mark, amid high interest rates and an ever-expanding debt burden.


U.S. Debt Interest Payments Reach $1 Trillion
This was originally posted on our Voronoi app. Download the app for free on iOS or Android and discover incredible data-driven charts from a variety of trusted sources.
The cost of paying for America’s national debt crossed the $1 trillion dollar mark in 2023, driven by high interest rates and a record $34 trillion mountain of debt.
Over the last decade, U.S. debt interest payments have more than doubled amid vast government spending during the pandemic crisis. As debt payments continue to soar, the Congressional Budget Office (CBO) reported that debt servicing costs surpassed defense spending for the first time ever this year.
This graphic shows the sharp rise in U.S. debt payments, based on data from the Federal Reserve.
A $1 Trillion Interest Bill, and Growing
Below, we show how U.S. debt interest payments have risen at a faster pace than at another time in modern history:
| Date | Interest Payments | U.S. National Debt |
|---|---|---|
| 2023 | $1.0T | $34.0T |
| 2022 | $830B | $31.4T |
| 2021 | $612B | $29.6T |
| 2020 | $518B | $27.7T |
| 2019 | $564B | $23.2T |
| 2018 | $571B | $22.0T |
| 2017 | $493B | $20.5T |
| 2016 | $460B | $20.0T |
| 2015 | $435B | $18.9T |
| 2014 | $442B | $18.1T |
| 2013 | $425B | $17.2T |
| 2012 | $417B | $16.4T |
| 2011 | $433B | $15.2T |
| 2010 | $400B | $14.0T |
| 2009 | $354B | $12.3T |
| 2008 | $380B | $10.7T |
| 2007 | $414B | $9.2T |
| 2006 | $387B | $8.7T |
| 2005 | $355B | $8.2T |
| 2004 | $318B | $7.6T |
| 2003 | $294B | $7.0T |
| 2002 | $298B | $6.4T |
| 2001 | $318B | $5.9T |
| 2000 | $353B | $5.7T |
| 1999 | $353B | $5.8T |
| 1998 | $360B | $5.6T |
| 1997 | $368B | $5.5T |
| 1996 | $362B | $5.3T |
| 1995 | $357B | $5.0T |
| 1994 | $334B | $4.8T |
| 1993 | $311B | $4.5T |
| 1992 | $306B | $4.2T |
| 1991 | $308B | $3.8T |
| 1990 | $298B | $3.4T |
| 1989 | $275B | $3.0T |
| 1988 | $254B | $2.7T |
| 1987 | $240B | $2.4T |
| 1986 | $225B | $2.2T |
| 1985 | $219B | $1.9T |
| 1984 | $205B | $1.7T |
| 1983 | $176B | $1.4T |
| 1982 | $157B | $1.2T |
| 1981 | $142B | $1.0T |
| 1980 | $113B | $930.2B |
| 1979 | $96B | $845.1B |
| 1978 | $84B | $789.2B |
| 1977 | $69B | $718.9B |
| 1976 | $61B | $653.5B |
| 1975 | $55B | $576.6B |
| 1974 | $50B | $492.7B |
| 1973 | $45B | $469.1B |
| 1972 | $39B | $448.5B |
| 1971 | $36B | $424.1B |
| 1970 | $35B | $389.2B |
| 1969 | $30B | $368.2B |
| 1968 | $25B | $358.0B |
| 1967 | $23B | $344.7B |
| 1966 | $21B | $329.3B |
Interest payments represent seasonally adjusted annual rate at the end of Q4.
At current rates, the U.S. national debt is growing by a remarkable $1 trillion about every 100 days, equal to roughly $3.6 trillion per year.
As the national debt has ballooned, debt payments even exceeded Medicaid outlays in 2023—one of the government’s largest expenditures. On average, the U.S. spent more than $2 billion per day on interest costs last year. Going further, the U.S. government is projected to spend a historic $12.4 trillion on interest payments over the next decade, averaging about $37,100 per American.
Exacerbating matters is that the U.S. is running a steep deficit, which stood at $1.1 trillion for the first six months of fiscal 2024. This has accelerated due to the 43% increase in debt servicing costs along with a $31 billion dollar increase in defense spending from a year earlier. Additionally, a $30 billion increase in funding for the Federal Deposit Insurance Corporation in light of the regional banking crisis last year was a major contributor to the deficit increase.
Overall, the CBO forecasts that roughly 75% of the federal deficit’s increase will be due to interest costs by 2034.

-

 Travel1 week ago
Airline Incidents: How Do Boeing and Airbus Compare?
-

 Markets2 weeks ago
Visualizing America’s Shortage of Affordable Homes
-

 Green2 weeks ago
Ranked: Top Countries by Total Forest Loss Since 2001
-

 Money2 weeks ago
Where Does One U.S. Tax Dollar Go?
-

 Misc2 weeks ago
Almost Every EV Stock is Down After Q1 2024
-

 AI2 weeks ago
The Stock Performance of U.S. Chipmakers So Far in 2024
-

 Markets2 weeks ago
Charted: Big Four Market Share by S&P 500 Audits
-

 Real Estate2 weeks ago
Ranked: The Most Valuable Housing Markets in America