Energy
Ranked: The Largest Oil and Gas Companies in the World
![]() Subscribe to the Elements free mailing list for more like this
Subscribe to the Elements free mailing list for more like this
The Largest Oil & Gas Companies in 2021
This was originally posted on Elements. Sign up to the free mailing list to get beautiful visualizations on natural resource megatrends in your email every week.
The pandemic brought strong headwinds for the oil and gas industry, and oil majors felt the blow.
Global primary energy consumption fell by 4.5% relative to 2019 and oil demand declined by 9%. For a brief period in April 2020, the price of West Texas Intermediate (WTI) crude futures went subzero, marking the largest one-day price plunge since 1983.
Some expected the demand crash to have a lasting impact on the industry, but it’s safe to say that 2021 has proved otherwise.
Oil Resurfaces as Energy Crisis Deepens
The world is facing a shortage of energy, and peak winter is yet to hit most parts of the globe.
Pandemic-induced supply restraints from producers, in addition to rising energy demand from recovering economies, have sent nations scrambling for petroleum products. Consequently, oil prices are resurfacing to pre-pandemic levels.
As of today, prices of WTI crude futures are at their highest levels in the last five years at over $80 per barrel. Furthermore, U.S. natural gas prices hit a 7-year high of $6.5 per million British thermal units (BTU) earlier this month. Elsewhere, European benchmark natural gas futures have surged 1,300% since May 2020.
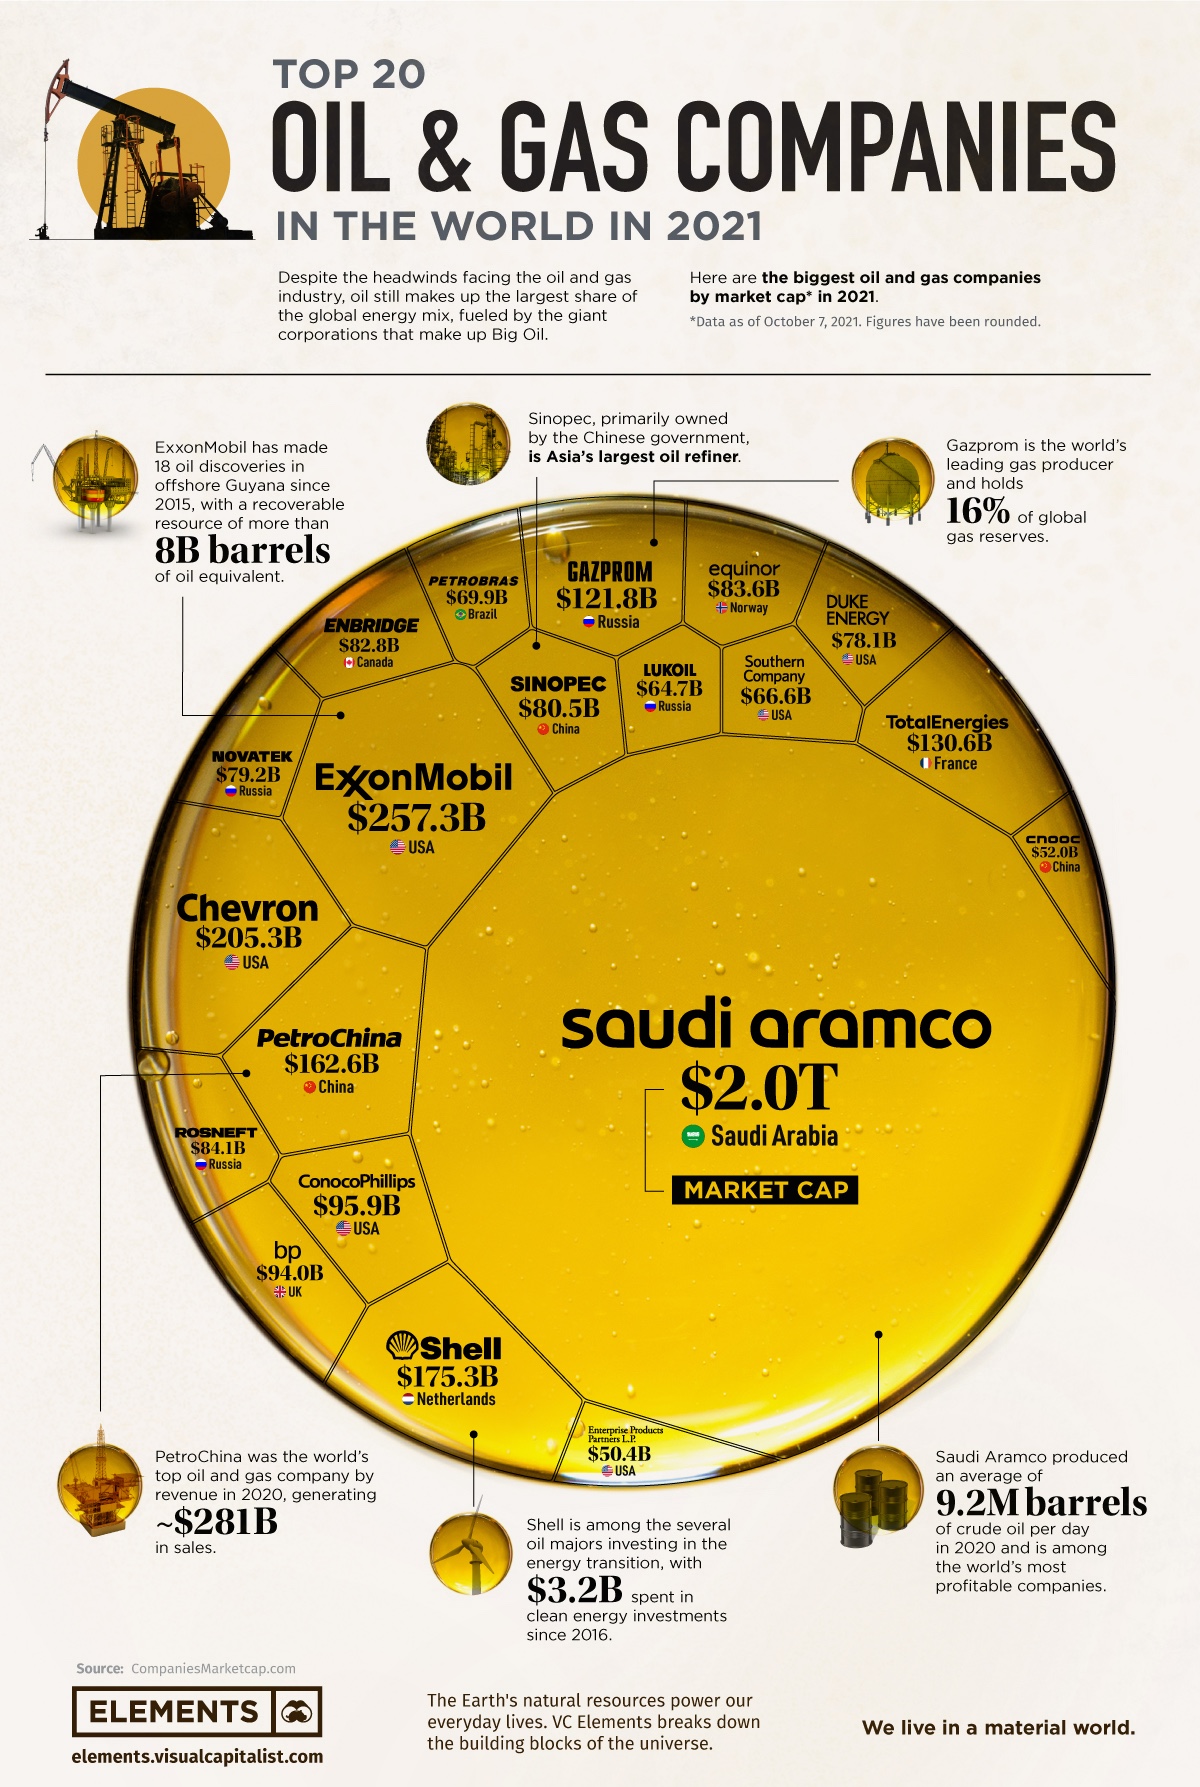
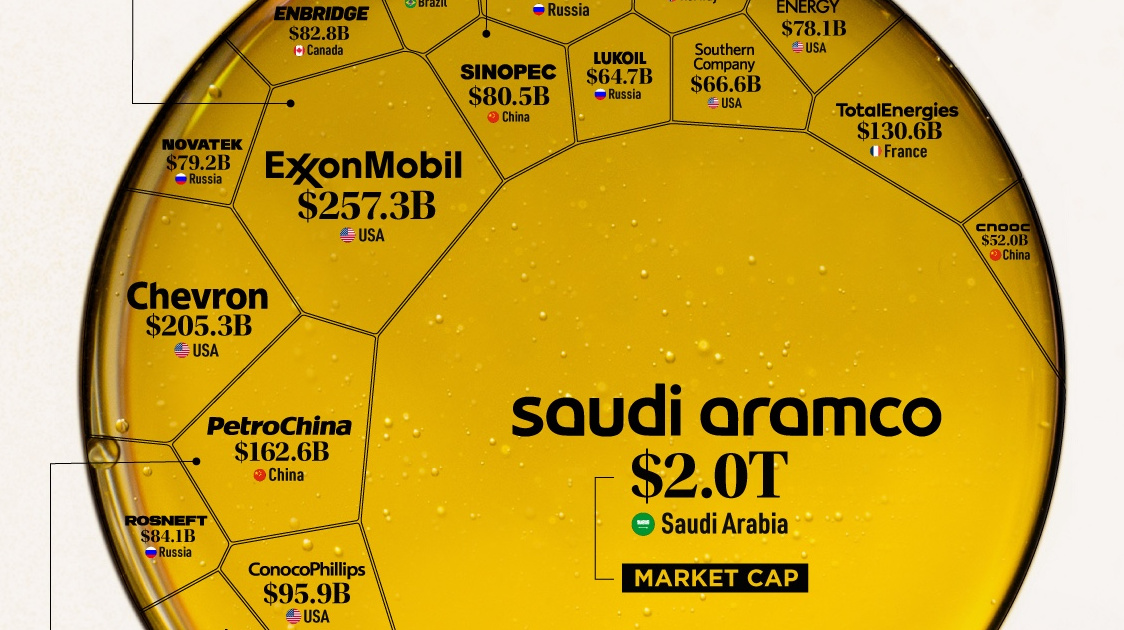
Of course, the largest oil and gas companies are riding this wave of resurgence. Using data from CompaniesMarketCap.com, the above infographic ranks the top 20 oil and gas companies by market cap as of October 7, 2021.
Big Oil: The Largest Oil and Gas Companies by Market Cap
Given that we often see their logos at gas stations, the largest oil and gas companies are generally quite well-known. Here’s how they stack up by market cap:
| Rank | Company | Market Cap* (US$, billions) | Country |
|---|---|---|---|
| 1 | Saudi Aramco | $1,979 | Saudi Arabia 🇸🇦 |
| 2 | ExxonMobil | $257.30 | U.S. 🇺🇸 |
| 3 | Chevron | $205.29 | U.S. 🇺🇸 |
| 4 | Shell | $175.28 | Netherlands 🇳🇱 |
| 5 | PetroChina | $162.55 | China 🇨🇳 |
| 6 | TotalEnergies | $130.56 | France 🇫🇷 |
| 7 | Gazprom | $121.77 | Russia 🇷🇺 |
| 8 | ConocoPhillips | $95.93 | U.S. 🇺🇸 |
| 9 | BP | $93.97 | U.K. 🇬🇧 |
| 10 | Rosneft | $84.07 | Russia 🇷🇺 |
| 11 | Equinor | $83.60 | Norway 🇳🇴 |
| 12 | Enbridge | $82.82 | Canada 🇨🇦 |
| 13 | Sinopec | $80.48 | China 🇨🇳 |
| 14 | Novatek | $79.18 | Russia 🇷🇺 |
| 15 | Duke Energy | $78.08 | U.S. 🇺🇸 |
| 16 | Petrobras | $69.91 | Brazil 🇧🇷 |
| 17 | Southern Company | $66.64 | U.S. 🇺🇸 |
| 18 | Lukoil | $64.70 | Russia 🇷🇺 |
| 19 | CNOOC | $52.04 | China 🇨🇳 |
| 20 | Enterprise Products | $50.37 | U.S. 🇺🇸 |
*As of October 7, 2021.
Saudi Aramco is one of the five companies in the trillion-dollar club as the world’s third-largest company by market cap. Its market cap is nearly equivalent to the combined valuation of the other 19 companies on the list. But what makes this figure even more astounding is the fact that the company went public less than two years ago in December 2019.
However, the oil giant’s valuation doesn’t come out of the blue. Aramco was the world’s most profitable company in 2019, raking in $88 billion in net income. Apple took this title in 2020, but high oil prices could propel Aramco back to the top in 2021.
Although Standard Oil was split up a century ago, its legacy lives on today in the form of Big Oil. ExxonMobil and Chevron—the second and third-largest companies on the list—are direct descendants of Standard Oil. Furthermore, Shell and BP both acquired assets from Standard Oil’s original portfolio on the road to becoming global oil giants.
The geographical distribution of the largest oil and gas companies shows how global the industry is. The top 20 oil and gas companies come from 10 different countries. The U.S. hosts six of them, while four are headquartered in Russia. The other 10 are located in one of China, Brazil, Saudi Arabia, or Europe.
Big Oil, Bigger Emissions
Due to the nature of fossil fuels, the biggest oil and gas companies are also among the biggest greenhouse gas (GHG) emitters.
In fact, Saudi Aramco is the world’s largest corporate GHG emitter and accounts for over 4% of the entire world’s emissions since 1965. Chevron, Gazprom, ExxonMobil, BP, and several other oil giants join Aramco on the list of top 20 GHG emitters between 1965 and 2017.
Shifting towards a low-carbon future will undoubtedly require the world to rely less on fossil fuels. But completely shunning the oil and gas industry isn’t possible at the moment, as shown by the global energy crisis.


Energy
Charted: 4 Reasons Why Lithium Could Be the Next Gold Rush
Visual Capitalist has partnered with EnergyX to show why drops in prices and growing demand may make now the right time to invest in lithium.


4 Reasons Why You Should Invest in Lithium
Lithium’s importance in powering EVs makes it a linchpin of the clean energy transition and one of the world’s most precious minerals.
In this graphic, Visual Capitalist partnered with EnergyX to explore why now may be the time to invest in lithium.
1. Lithium Prices Have Dropped
One of the most critical aspects of evaluating an investment is ensuring that the asset’s value is higher than its price would indicate. Lithium is integral to powering EVs, and, prices have fallen fast over the last year:
| Date | LiOH·H₂O* | Li₂CO₃** |
|---|---|---|
| Feb 2023 | $76 | $71 |
| March 2023 | $71 | $61 |
| Apr 2023 | $43 | $33 |
| May 2023 | $43 | $33 |
| June 2023 | $47 | $45 |
| July 2023 | $44 | $40 |
| Aug 2023 | $35 | $35 |
| Sept 2023 | $28 | $27 |
| Oct 2023 | $24 | $23 |
| Nov 2023 | $21 | $21 |
| Dec 2023 | $17 | $16 |
| Jan 2024 | $14 | $15 |
| Feb 2024 | $13 | $14 |
Note: Monthly spot prices were taken as close to the 14th of each month as possible.
*Lithium hydroxide monohydrate MB-LI-0033
**Lithium carbonate MB-LI-0029
2. Lithium-Ion Battery Prices Are Also Falling
The drop in lithium prices is just one reason to invest in the metal. Increasing economies of scale, coupled with low commodity prices, have caused the cost of lithium-ion batteries to drop significantly as well.
In fact, BNEF reports that between 2013 and 2023, the price of a Li-ion battery dropped by 82%.
| Year | Price per KWh |
|---|---|
| 2023 | $139 |
| 2022 | $161 |
| 2021 | $150 |
| 2020 | $160 |
| 2019 | $183 |
| 2018 | $211 |
| 2017 | $258 |
| 2016 | $345 |
| 2015 | $448 |
| 2014 | $692 |
| 2013 | $780 |

3. EV Adoption is Sustainable
One of the best reasons to invest in lithium is that EVs, one of the main drivers behind the demand for lithium, have reached a price point similar to that of traditional vehicle.
According to the Kelly Blue Book, Tesla’s average transaction price dropped by 25% between 2022 and 2023, bringing it in line with many other major manufacturers and showing that EVs are a realistic transport option from a consumer price perspective.
| Manufacturer | September 2022 | September 2023 |
|---|---|---|
| BMW | $69,000 | $72,000 |
| Ford | $54,000 | $56,000 |
| Volkswagon | $54,000 | $56,000 |
| General Motors | $52,000 | $53,000 |
| Tesla | $68,000 | $51,000 |
4. Electricity Demand in Transport is Growing
As EVs become an accessible transport option, there’s an investment opportunity in lithium. But possibly the best reason to invest in lithium is that the IEA reports global demand for the electricity in transport could grow dramatically by 2030:
| Transport Type | 2022 | 2025 | 2030 |
|---|---|---|---|
| Buses 🚌 | 23,000 GWh | 50,000 GWh | 130,000 GWh |
| Cars 🚙 | 65,000 GWh | 200,000 GWh | 570,000 GWh |
| Trucks 🛻 | 4,000 GWh | 15,000 GWh | 94,000 GWh |
| Vans 🚐 | 6,000 GWh | 16,000 GWh | 72,000 GWh |
The Lithium Investment Opportunity
Lithium presents a potentially classic investment opportunity. Lithium and battery prices have dropped significantly, and recently, EVs have reached a price point similar to other vehicles. By 2030, the demand for clean energy, especially in transport, will grow dramatically.
With prices dropping and demand skyrocketing, now is the time to invest in lithium.
EnergyX is poised to exploit lithium demand with cutting-edge lithium extraction technology capable of extracting 300% more lithium than current processes.

-

 Lithium4 days ago
Ranked: The Top 10 EV Battery Manufacturers in 2023
Asia dominates this ranking of the world’s largest EV battery manufacturers in 2023.
-

 Energy1 week ago
The World’s Biggest Nuclear Energy Producers
China has grown its nuclear capacity over the last decade, now ranking second on the list of top nuclear energy producers.
-

 Energy1 month ago
The World’s Biggest Oil Producers in 2023
Just three countries accounted for 40% of global oil production last year.
-

 Energy1 month ago
How Much Does the U.S. Depend on Russian Uranium?
Currently, Russia is the largest foreign supplier of nuclear power fuel to the U.S.
-

 Uranium2 months ago
Charted: Global Uranium Reserves, by Country
We visualize the distribution of the world’s uranium reserves by country, with 3 countries accounting for more than half of total reserves.
-

 Energy3 months ago
Visualizing the Rise of the U.S. as Top Crude Oil Producer
Over the last decade, the United States has established itself as the world’s top producer of crude oil, surpassing Saudi Arabia and Russia.


-

 Education1 week ago
How Hard Is It to Get Into an Ivy League School?
-

 Technology2 weeks ago
Ranked: Semiconductor Companies by Industry Revenue Share
-

 Markets2 weeks ago
Ranked: The World’s Top Flight Routes, by Revenue
-

 Demographics2 weeks ago
Population Projections: The World’s 6 Largest Countries in 2075
-

 Markets2 weeks ago
The Top 10 States by Real GDP Growth in 2023
-

 Demographics2 weeks ago
The Smallest Gender Wage Gaps in OECD Countries
-

 Economy2 weeks ago
Where U.S. Inflation Hit the Hardest in March 2024
-

 Environment2 weeks ago
Top Countries By Forest Growth Since 2001