Energy
Which Countries Have the World’s Largest Proven Oil Reserves?


The Countries With the Largest Proven Oil Reserves
Oil is a natural resource formed by the decay of organic matter over millions of years, and like many other natural resources, it can only be extracted from reserves where it already exists. The only difference between oil and every other natural resource is that oil is well and truly the lifeblood of the global economy.
The world derives over a third of its total energy production from oil, more than any other source by far. As a result, the countries that control the world’s oil reserves often have disproportionate geopolitical and economic power.
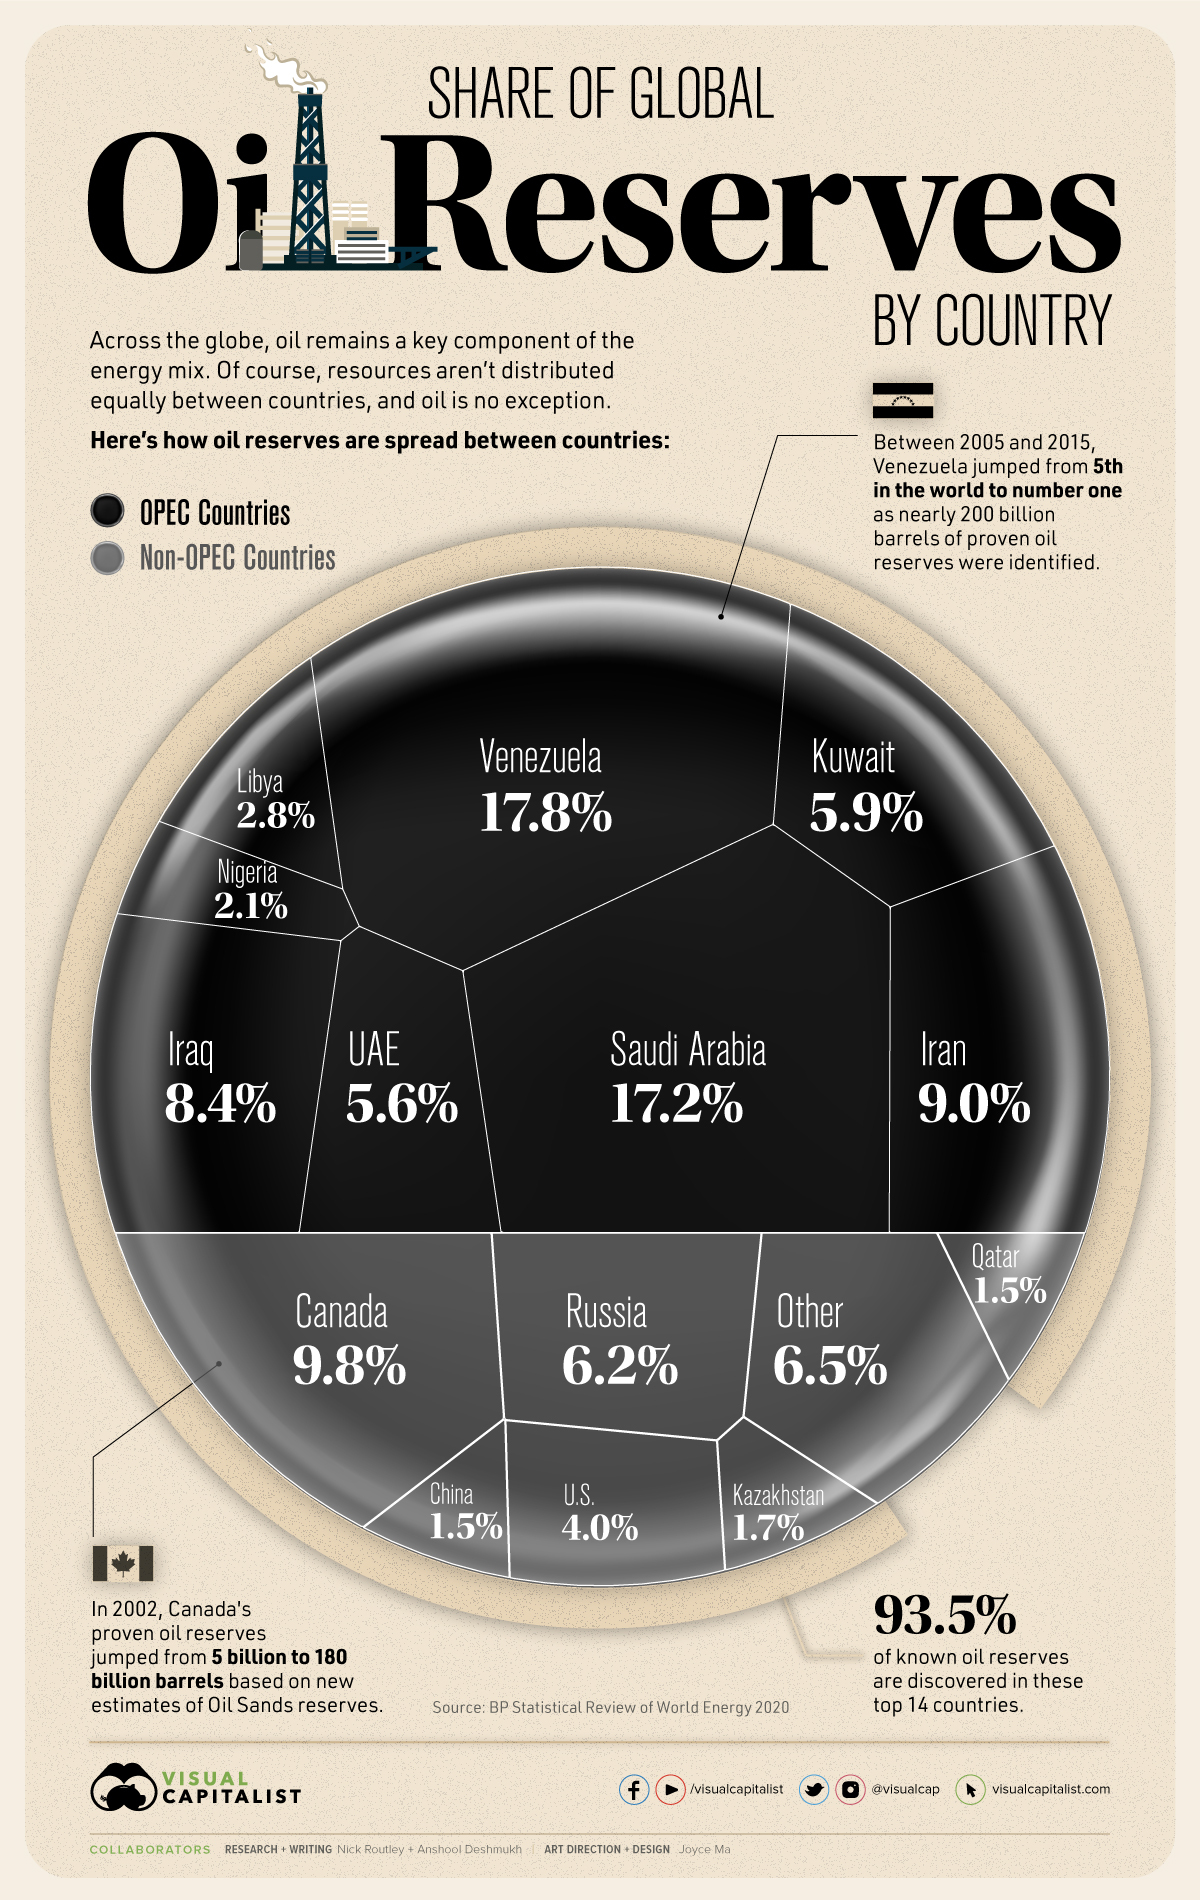
According to the BP Statistical Review of World Energy 2020, 14 countries make up 93.5% of the proven oil reserves globally. The countries on this list span five continents and control anywhere from 25.2 billion barrels of oil to 304 billion barrels of oil.
Proven Oil Reserves, by Country
At the end of 2019, the world had 1.73 trillion barrels of oil reserves. Here are the 14 countries with at least a 1% share of global proven oil reserves:
| Rank | Country | Oil Reserves (billion barrels) | Share of Global Reserves |
|---|---|---|---|
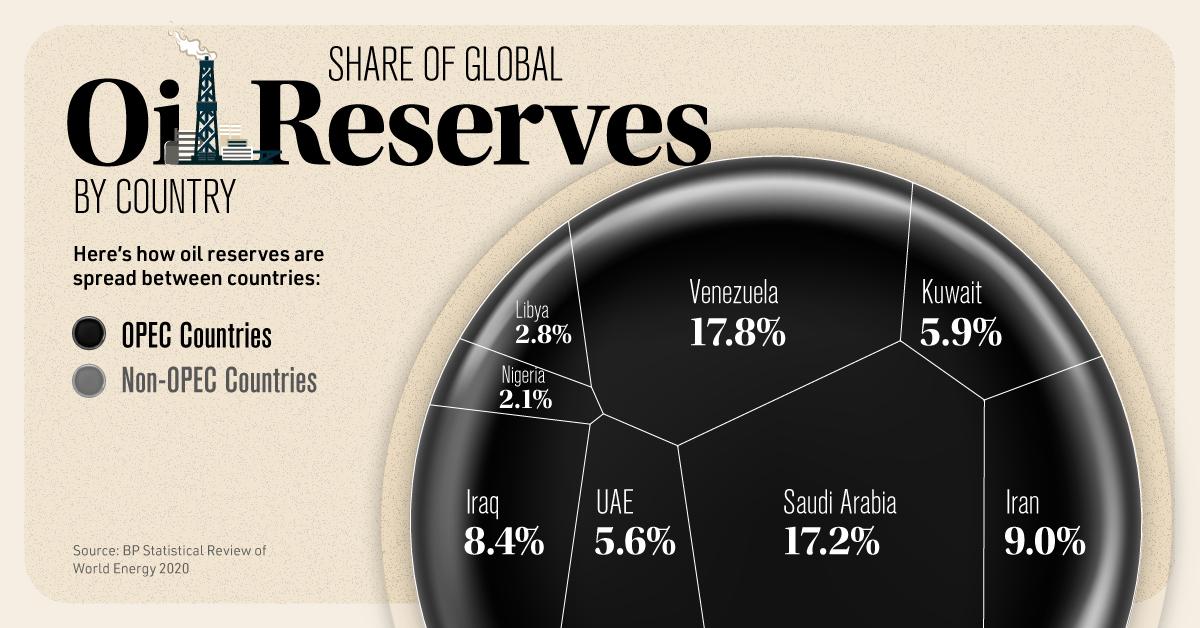
| #1 | 🇻🇪 Venezuela | 304 | 17.8% |
| #2 | 🇸🇦 Saudi Arabia | 298 | 17.2% |
| #3 | 🇨🇦 Canada | 170 | 9.8% |
| #4 | 🇮🇷 Iran | 156 | 9.0% |
| #5 | 🇮🇶 Iraq | 145 | 8.4% |
| #6 | 🇷🇺 Russia | 107 | 6.2% |
| #7 | 🇰🇼 Kuwait | 102 | 5.9% |
| #8 | 🇦🇪 UAE | 98 | 5.6% |
| #9 | 🇺🇸 United States | 69 | 4.0% |
| #10 | 🇱🇾 Libya | 48 | 2.8% |
| #11 | 🇳🇬 Nigeria | 37 | 2.1% |
| #12 | 🇰🇿 Kazakhstan | 30 | 1.7% |
| #13 | 🇨🇳 China | 26.2 | 1.5% |
| #14 | 🇶🇦 Qatar | 25.2 | 1.5% |
While these countries are found all over the globe, a few countries have much larger amounts than others. Venezuela is the leading country in terms of oil reserves, with over 304 billion barrels of oil beneath its surface. Saudi Arabia is a close second with 298 billion, and Canada is third with 170 billion barrels of oil reserves.
Oil Reserves vs. Oil Production
A country with large amounts of reserves does not always translate to strong production numbers for petroleum, oil, and by-products. Oil reserves simply serve as an estimate of the amount of economically recoverable crude oil in a particular region. To qualify, these reserves must have the potential of being extracted under current technological constraints.
While countries like the U.S. and Russia are low on the list of oil reserves, they rank highly in terms of oil production. More than 95 million barrels of oil were produced globally every day in 2019, and the U.S., Saudi Arabia, and Russia are among the world’s top oil-producing countries, respectively.
Oil Sands Contributing to Growing Reserves
Venezuela has long been an oil-producing country with heavy economic reliance on oil exports. However, in 2011, Venezuela’s energy and oil ministry announced an unprecedented increase in proven oil reserves as oil sands in the Orinoco Belt territory were certified.
The nearly 200 billion barrels of proven oil reserves identified between 2005 and 2015, pushed Venezuela from fifth in the world to number one. As a result, South and Central America’s proven oil reserves more than doubled between 2008 and 2011.
In 2002, Canada’s proven oil reserves jumped from 5 billion to 180 billion barrels based on new oil sands estimates.
Canada accounts for almost 10% of the world’s proven oil reserves at 170 billion barrels, with an estimated 166.3 billion located in Alberta’s oil sands, and the rest found in conventional, offshore, and tight oil formations.
Large Reserves in OPEC Nations
The Organization of the Petroleum Exporting Countries (OPEC) is an intergovernmental global petroleum and oil distribution agency headquartered in Vienna, Austria.
The majority of countries with the largest oil reserves in the world are members of OPEC. Now composed of 14 member states, OPEC holds nearly 70% of crude oil reserves worldwide.
Most OPEC countries are in the Middle East, the region with the largest oil reserves, holding nearly half of the global share.
Regional Shifts
Though most of the proven oil reserves in the world were historically considered to be centered in the Middle East, in the past three decades their share of global oil reserves has dropped, from over 60% in 1992 to about 48% in 2019.
One of the main reasons for this drop was constant oil production and greater reserves discovered in the Americas. By 2012, Central and South America’s share had more than doubled and has remained just under 20% in the years since.
While oil sands ushered in a new era of global oil reserve domination, as the world shifts away from oil consumption and towards green energy and electrification, these reserves might not matter as much in the future as they once did.


Energy
Charted: 4 Reasons Why Lithium Could Be the Next Gold Rush
Visual Capitalist has partnered with EnergyX to show why drops in prices and growing demand may make now the right time to invest in lithium.


4 Reasons Why You Should Invest in Lithium
Lithium’s importance in powering EVs makes it a linchpin of the clean energy transition and one of the world’s most precious minerals.
In this graphic, Visual Capitalist partnered with EnergyX to explore why now may be the time to invest in lithium.
1. Lithium Prices Have Dropped
One of the most critical aspects of evaluating an investment is ensuring that the asset’s value is higher than its price would indicate. Lithium is integral to powering EVs, and, prices have fallen fast over the last year:
| Date | LiOH·H₂O* | Li₂CO₃** |
|---|---|---|
| Feb 2023 | $76 | $71 |
| March 2023 | $71 | $61 |
| Apr 2023 | $43 | $33 |
| May 2023 | $43 | $33 |
| June 2023 | $47 | $45 |
| July 2023 | $44 | $40 |
| Aug 2023 | $35 | $35 |
| Sept 2023 | $28 | $27 |
| Oct 2023 | $24 | $23 |
| Nov 2023 | $21 | $21 |
| Dec 2023 | $17 | $16 |
| Jan 2024 | $14 | $15 |
| Feb 2024 | $13 | $14 |
Note: Monthly spot prices were taken as close to the 14th of each month as possible.
*Lithium hydroxide monohydrate MB-LI-0033
**Lithium carbonate MB-LI-0029
2. Lithium-Ion Battery Prices Are Also Falling
The drop in lithium prices is just one reason to invest in the metal. Increasing economies of scale, coupled with low commodity prices, have caused the cost of lithium-ion batteries to drop significantly as well.
In fact, BNEF reports that between 2013 and 2023, the price of a Li-ion battery dropped by 82%.
| Year | Price per KWh |
|---|---|
| 2023 | $139 |
| 2022 | $161 |
| 2021 | $150 |
| 2020 | $160 |
| 2019 | $183 |
| 2018 | $211 |
| 2017 | $258 |
| 2016 | $345 |
| 2015 | $448 |
| 2014 | $692 |
| 2013 | $780 |

3. EV Adoption is Sustainable
One of the best reasons to invest in lithium is that EVs, one of the main drivers behind the demand for lithium, have reached a price point similar to that of traditional vehicle.
According to the Kelly Blue Book, Tesla’s average transaction price dropped by 25% between 2022 and 2023, bringing it in line with many other major manufacturers and showing that EVs are a realistic transport option from a consumer price perspective.
| Manufacturer | September 2022 | September 2023 |
|---|---|---|
| BMW | $69,000 | $72,000 |
| Ford | $54,000 | $56,000 |
| Volkswagon | $54,000 | $56,000 |
| General Motors | $52,000 | $53,000 |
| Tesla | $68,000 | $51,000 |
4. Electricity Demand in Transport is Growing
As EVs become an accessible transport option, there’s an investment opportunity in lithium. But possibly the best reason to invest in lithium is that the IEA reports global demand for the electricity in transport could grow dramatically by 2030:
| Transport Type | 2022 | 2025 | 2030 |
|---|---|---|---|
| Buses 🚌 | 23,000 GWh | 50,000 GWh | 130,000 GWh |
| Cars 🚙 | 65,000 GWh | 200,000 GWh | 570,000 GWh |
| Trucks 🛻 | 4,000 GWh | 15,000 GWh | 94,000 GWh |
| Vans 🚐 | 6,000 GWh | 16,000 GWh | 72,000 GWh |
The Lithium Investment Opportunity
Lithium presents a potentially classic investment opportunity. Lithium and battery prices have dropped significantly, and recently, EVs have reached a price point similar to other vehicles. By 2030, the demand for clean energy, especially in transport, will grow dramatically.
With prices dropping and demand skyrocketing, now is the time to invest in lithium.
EnergyX is poised to exploit lithium demand with cutting-edge lithium extraction technology capable of extracting 300% more lithium than current processes.

-

 Lithium4 days ago
Ranked: The Top 10 EV Battery Manufacturers in 2023
Asia dominates this ranking of the world’s largest EV battery manufacturers in 2023.
-

 Energy1 week ago
The World’s Biggest Nuclear Energy Producers
China has grown its nuclear capacity over the last decade, now ranking second on the list of top nuclear energy producers.
-

 Energy1 month ago
The World’s Biggest Oil Producers in 2023
Just three countries accounted for 40% of global oil production last year.
-

 Energy1 month ago
How Much Does the U.S. Depend on Russian Uranium?
Currently, Russia is the largest foreign supplier of nuclear power fuel to the U.S.
-

 Uranium2 months ago
Charted: Global Uranium Reserves, by Country
We visualize the distribution of the world’s uranium reserves by country, with 3 countries accounting for more than half of total reserves.
-

 Energy3 months ago
Visualizing the Rise of the U.S. as Top Crude Oil Producer
Over the last decade, the United States has established itself as the world’s top producer of crude oil, surpassing Saudi Arabia and Russia.


-

 Education1 week ago
How Hard Is It to Get Into an Ivy League School?
-

 Technology2 weeks ago
Ranked: Semiconductor Companies by Industry Revenue Share
-

 Markets2 weeks ago
Ranked: The World’s Top Flight Routes, by Revenue
-

 Demographics2 weeks ago
Population Projections: The World’s 6 Largest Countries in 2075
-

 Markets2 weeks ago
The Top 10 States by Real GDP Growth in 2023
-

 Demographics2 weeks ago
The Smallest Gender Wage Gaps in OECD Countries
-

 Economy2 weeks ago
Where U.S. Inflation Hit the Hardest in March 2024
-

 Green2 weeks ago
Top Countries By Forest Growth Since 2001