Energy
Mapped: The World’s Biggest Oil Discoveries Since 1868


Mapped: The World’s Biggest Oil Discoveries Since 1868
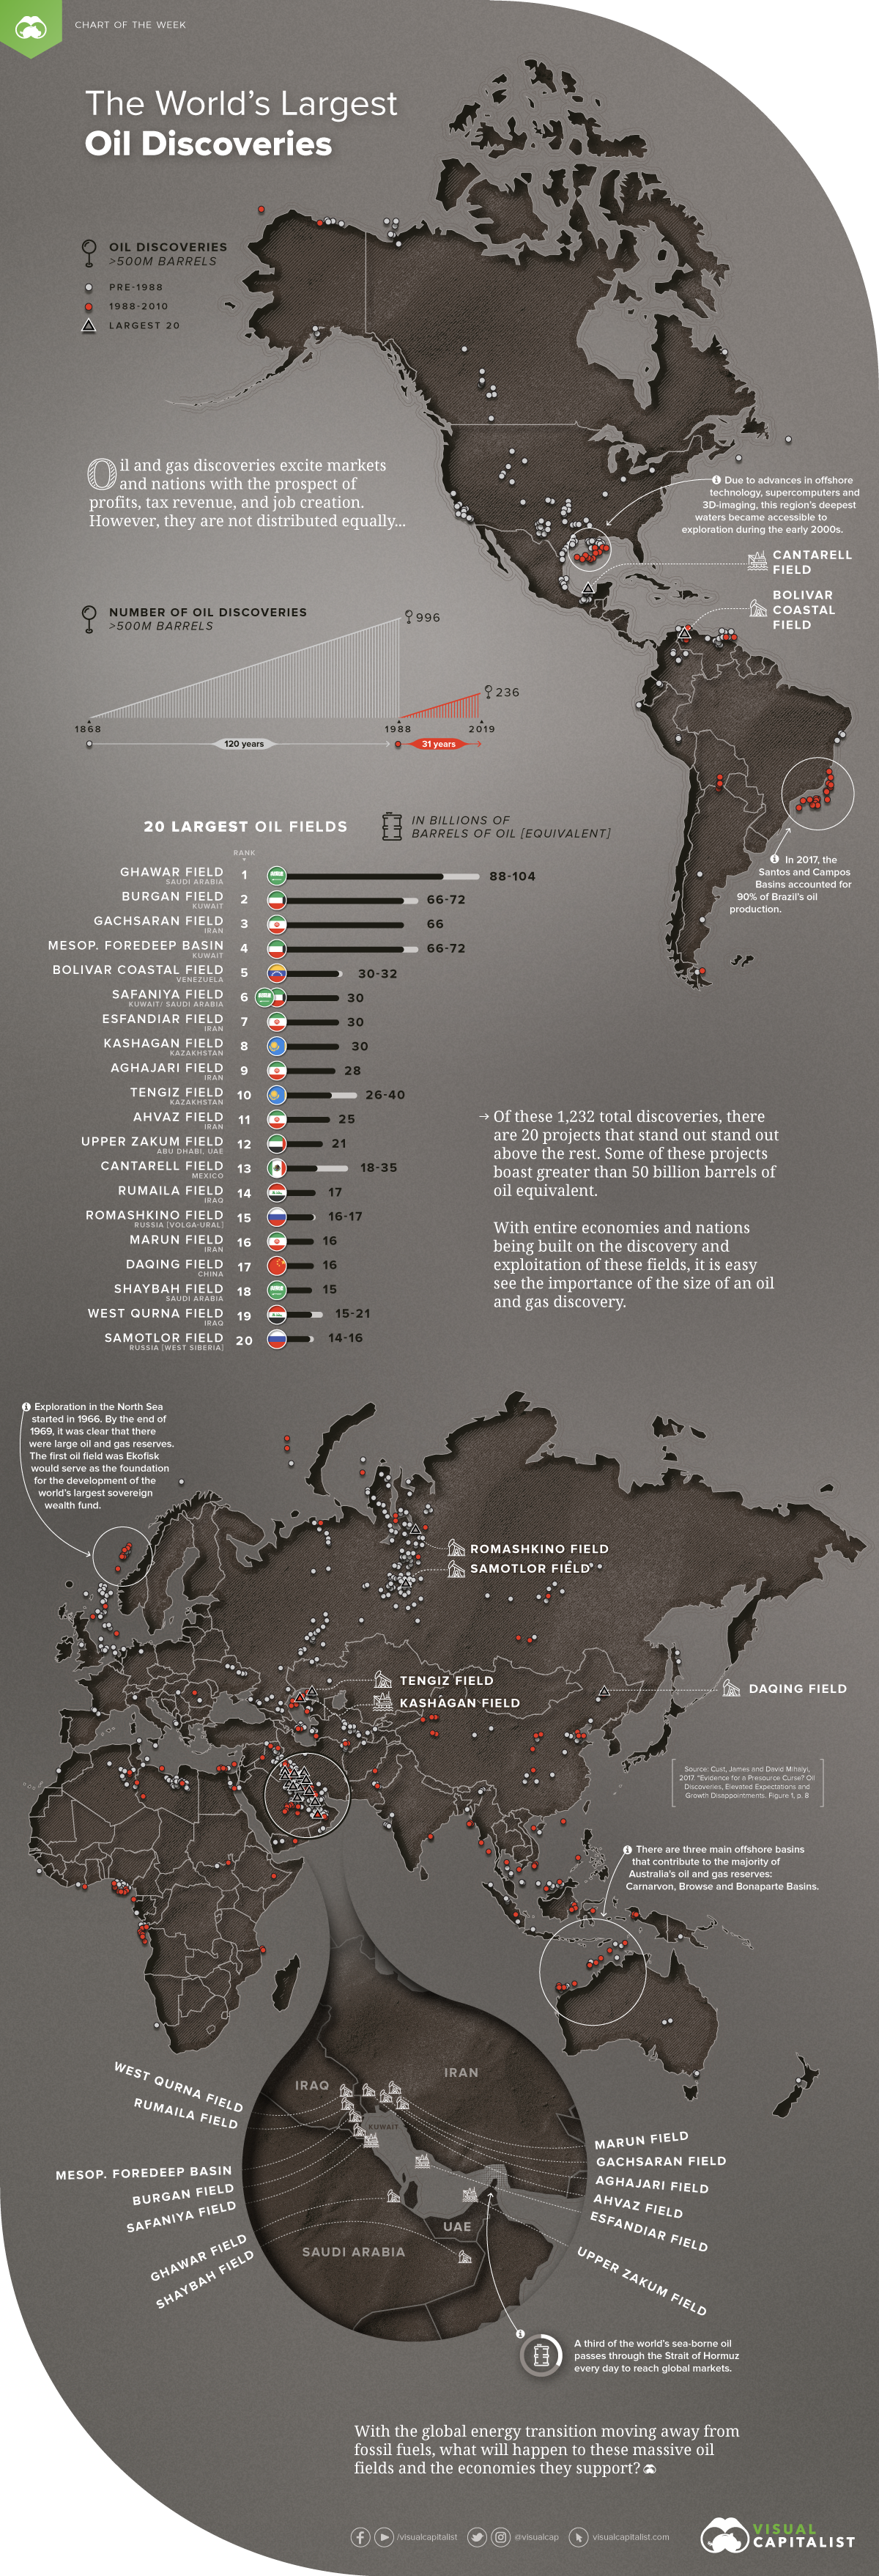
Oil and gas discoveries excite markets and nations with the prospect of profits, tax revenues, and jobs. However, geological processes did not distribute them equally throughout the Earth’s crust and their mere presence does not guarantee a windfall for whatever nation under which they lie.
Entire economies and nations have been built on the discovery and exploitation of oil and gas, while some nations have misused this wealth─or projected growth just never materialized.
Today’s chart comes to us from research compiled by World Bank economist Jim Cust and Natural Resource Governance Institute economist David Mihalyi and it plots major oil discoveries since 1868.
The 20 Biggest Oil Discoveries
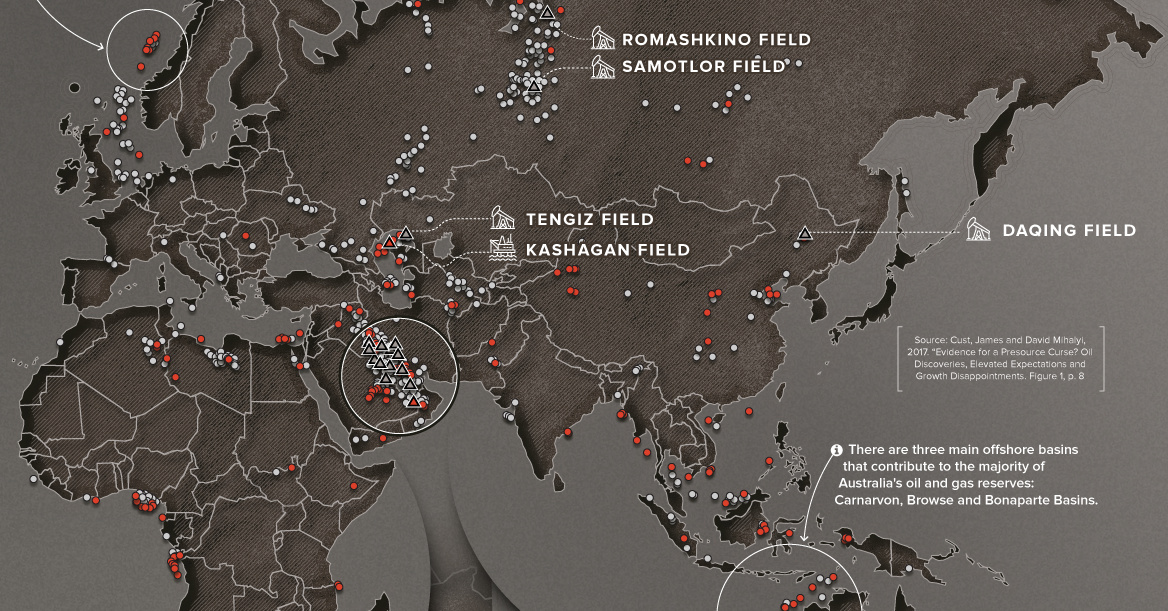
This map includes 1,232 discoveries of recoverable reserves over 500 million barrels of oil equivalent (BOE) From 1868 to 2010.
The discoveries cluster in certain parts of the world, covering 46 countries, and are of significant magnitude for each country’s economy. The average discovery is worth 1.4% of a country’s GDP today, based on the cash value from their production or net present value (NPV).
Of the total 1,232 discoveries, these are the 20 largest oil and gas fields:
| Field | Onshore/Offshore | Location | Discovery | Production start | Recoverable oil, past and future (billion barrels) |
|---|---|---|---|---|---|
| Ghawar Field | Onshore | Saudi Arabia | 1948 | 1951 | 88-104 |
| Burgan Field | Onshore | Kuwait | 1937 | 1948 | 66-72 |
| Gachsaran Field | Onshore | Iran | 1927 | 1930 | 66 |
| Mesopotamian Foredeep Basin | Onshore | Kuwait | n/a | n/a | 66-72 |
| Bolivar Coastal Field | Onshore | Venezuela | 1917 | 1922 | 30-32 |
| Safaniya Field | Offshore | Kuwait/Saudi Arabia | 1951 | 1957 | 30 |
| Esfandiar Field | Offshore | Iran | 1965 | n/a | 30 |
| Kashagan Field | Offshore | Kazakhstan | 2000 | 2013 | 30 |
| Aghajari Field | Onshore | Iran | 1938 | 1940 | 28 |
| Tengiz Field | Onshore | Kazakhstan | 1979 | 1993 | 26-40 |
| Ahvaz Field | Onshore | Iran | 1953 | 1954 | 25 |
| Upper Zakum Field | Offshore | Abu Dhabi, UAE | 1963 | 1967 | 21 |
| Cantarell Field | Offshore | Mexico | 1976 | 1981 | 18-35 |
| Rumaila Field | Onshore | Iraq | 1953 | 1954 | 17 |
| Romashkino Field | Onshore | Russia Volga-Ural | 1948 | 1949 | 16-17 |
| Marun Field | Onshore | Iran | 1963 | 1966 | 16 |
| Daqing Field | Onshore | China | 1959 | 1960 | 16 |
| Shaybah Field | Onshore | Saudi Arabia | 1998 | 1998 | 15 |
| West Qurna Field | Onshore | Iraq | 1973 | 2012 | 15-21 |
| Samotlor Field | Onshore | Russia, West Siberia | 1965 | 1969 | 14-16 |
The location of these deposits reveals a certain pattern to geopolitical flashpoints and their importance to the global economy.
While these discoveries have brought immense advantages in the form of cheap fuel and massive revenues, they have also altered and challenged how nations govern their natural wealth.
The Future of Resource Wealth: A Curse or a Blessing?
A ‘presource curse’ could follow in the wake of the discovery, whereby predictions of projected growth and feelings of euphoria turn into disappointment.
An oil discovery can impose detrimental consequences on an economy long before a single barrel leaves the ground. Ideally, a discovery should increase the economic output of a country that claims the oil. However, after major discoveries, the projected growth sometimes does not always materialize as predicted.
Getting from discovery to sustained prosperity depends on a number of steps. Countries must secure investment to develop a project to production, and government policy must respond by preparing the economy for an inflow of investment and foreign currency. However, this is a challenging prospect, as the appetite for these massive projects appears to be waning.
In a world working towards reducing its dependence on fossil fuels, what will happen to countries that depend on oil wealth when demand begins to dwindle?
Countries can no longer assume their oil and gas resources will translate into reliable wealth — instead, it is how you manage what you have now that counts.


Energy
Charted: 4 Reasons Why Lithium Could Be the Next Gold Rush
Visual Capitalist has partnered with EnergyX to show why drops in prices and growing demand may make now the right time to invest in lithium.


4 Reasons Why You Should Invest in Lithium
Lithium’s importance in powering EVs makes it a linchpin of the clean energy transition and one of the world’s most precious minerals.
In this graphic, Visual Capitalist partnered with EnergyX to explore why now may be the time to invest in lithium.
1. Lithium Prices Have Dropped
One of the most critical aspects of evaluating an investment is ensuring that the asset’s value is higher than its price would indicate. Lithium is integral to powering EVs, and, prices have fallen fast over the last year:
| Date | LiOH·H₂O* | Li₂CO₃** |
|---|---|---|
| Feb 2023 | $76 | $71 |
| March 2023 | $71 | $61 |
| Apr 2023 | $43 | $33 |
| May 2023 | $43 | $33 |
| June 2023 | $47 | $45 |
| July 2023 | $44 | $40 |
| Aug 2023 | $35 | $35 |
| Sept 2023 | $28 | $27 |
| Oct 2023 | $24 | $23 |
| Nov 2023 | $21 | $21 |
| Dec 2023 | $17 | $16 |
| Jan 2024 | $14 | $15 |
| Feb 2024 | $13 | $14 |
Note: Monthly spot prices were taken as close to the 14th of each month as possible.
*Lithium hydroxide monohydrate MB-LI-0033
**Lithium carbonate MB-LI-0029
2. Lithium-Ion Battery Prices Are Also Falling
The drop in lithium prices is just one reason to invest in the metal. Increasing economies of scale, coupled with low commodity prices, have caused the cost of lithium-ion batteries to drop significantly as well.
In fact, BNEF reports that between 2013 and 2023, the price of a Li-ion battery dropped by 82%.
| Year | Price per KWh |
|---|---|
| 2023 | $139 |
| 2022 | $161 |
| 2021 | $150 |
| 2020 | $160 |
| 2019 | $183 |
| 2018 | $211 |
| 2017 | $258 |
| 2016 | $345 |
| 2015 | $448 |
| 2014 | $692 |
| 2013 | $780 |

3. EV Adoption is Sustainable
One of the best reasons to invest in lithium is that EVs, one of the main drivers behind the demand for lithium, have reached a price point similar to that of traditional vehicle.
According to the Kelly Blue Book, Tesla’s average transaction price dropped by 25% between 2022 and 2023, bringing it in line with many other major manufacturers and showing that EVs are a realistic transport option from a consumer price perspective.
| Manufacturer | September 2022 | September 2023 |
|---|---|---|
| BMW | $69,000 | $72,000 |
| Ford | $54,000 | $56,000 |
| Volkswagon | $54,000 | $56,000 |
| General Motors | $52,000 | $53,000 |
| Tesla | $68,000 | $51,000 |
4. Electricity Demand in Transport is Growing
As EVs become an accessible transport option, there’s an investment opportunity in lithium. But possibly the best reason to invest in lithium is that the IEA reports global demand for the electricity in transport could grow dramatically by 2030:
| Transport Type | 2022 | 2025 | 2030 |
|---|---|---|---|
| Buses 🚌 | 23,000 GWh | 50,000 GWh | 130,000 GWh |
| Cars 🚙 | 65,000 GWh | 200,000 GWh | 570,000 GWh |
| Trucks 🛻 | 4,000 GWh | 15,000 GWh | 94,000 GWh |
| Vans 🚐 | 6,000 GWh | 16,000 GWh | 72,000 GWh |
The Lithium Investment Opportunity
Lithium presents a potentially classic investment opportunity. Lithium and battery prices have dropped significantly, and recently, EVs have reached a price point similar to other vehicles. By 2030, the demand for clean energy, especially in transport, will grow dramatically.
With prices dropping and demand skyrocketing, now is the time to invest in lithium.
EnergyX is poised to exploit lithium demand with cutting-edge lithium extraction technology capable of extracting 300% more lithium than current processes.

-

 Lithium4 days ago
Ranked: The Top 10 EV Battery Manufacturers in 2023
Asia dominates this ranking of the world’s largest EV battery manufacturers in 2023.
-

 Energy1 week ago
The World’s Biggest Nuclear Energy Producers
China has grown its nuclear capacity over the last decade, now ranking second on the list of top nuclear energy producers.
-

 Energy1 month ago
The World’s Biggest Oil Producers in 2023
Just three countries accounted for 40% of global oil production last year.
-

 Energy1 month ago
How Much Does the U.S. Depend on Russian Uranium?
Currently, Russia is the largest foreign supplier of nuclear power fuel to the U.S.
-

 Uranium2 months ago
Charted: Global Uranium Reserves, by Country
We visualize the distribution of the world’s uranium reserves by country, with 3 countries accounting for more than half of total reserves.
-

 Energy3 months ago
Visualizing the Rise of the U.S. as Top Crude Oil Producer
Over the last decade, the United States has established itself as the world’s top producer of crude oil, surpassing Saudi Arabia and Russia.


-

 Education1 week ago
How Hard Is It to Get Into an Ivy League School?
-

 Technology2 weeks ago
Ranked: Semiconductor Companies by Industry Revenue Share
-

 Markets2 weeks ago
Ranked: The World’s Top Flight Routes, by Revenue
-

 Demographics2 weeks ago
Population Projections: The World’s 6 Largest Countries in 2075
-

 Markets2 weeks ago
The Top 10 States by Real GDP Growth in 2023
-

 Demographics2 weeks ago
The Smallest Gender Wage Gaps in OECD Countries
-

 Economy2 weeks ago
Where U.S. Inflation Hit the Hardest in March 2024
-

 Green2 weeks ago
Top Countries By Forest Growth Since 2001