Energy
Mapped: The 1.2 Billion People Without Access to Electricity
For anyone reading this article, the benefits of electricity need not be explained.
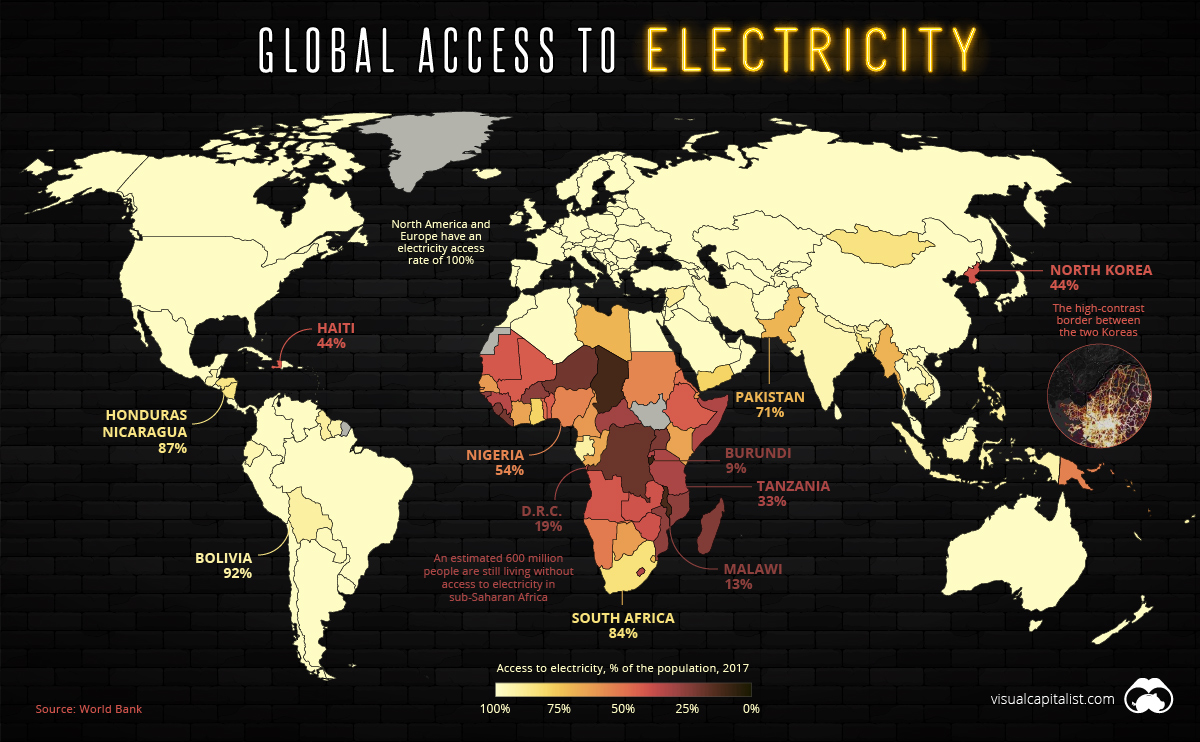
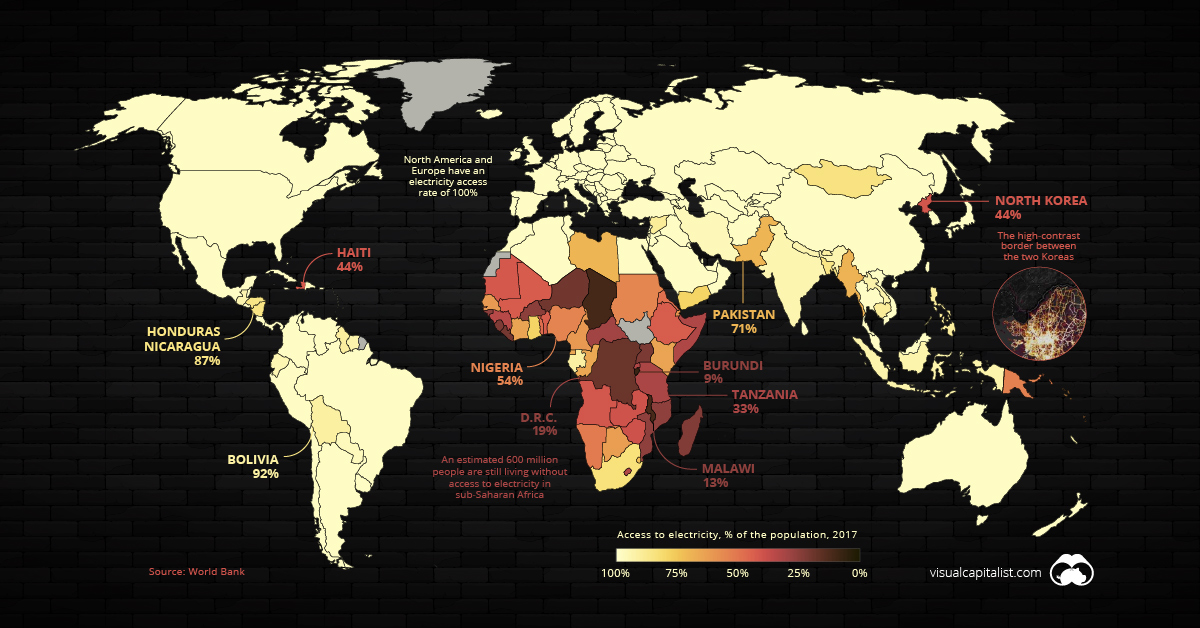
Access to electricity is now an afterthought in most parts of the world, so it may come as a surprise to learn that 16% of the world’s population — an estimated 1.2 billion people — are still living without this basic necessity. Lack of access to electricity, or “energy poverty”, is the ultimate economic hindrance as it prevents people from participating in the modern economy.
Where are people still living in the dark, and how are these energy challenges being addressed? Let’s dive in.
Where the Grid Reaches, and Beyond
At this point in time, a majority of countries have 100% electricity access rates, and many more have rates above 95%. This includes most of the world’s high-population countries, such as China, Brazil, and the United States.
India is fast approaching that benchmark for access. The massive country has made great strides in a short amount of time, jumping from a 70% to 93% access rate in a single decade.
Meanwhile, North Korea is an obvious outlier in East Asia. The Hermit Kingdom’s lack of electrification isn’t just conspicuous in the data — it’s even visible from space. The border between the two Koreas is clearly visible where the dark expanse of North Korea runs up against the glow of South Korea’s urban areas.
It’s been estimated that more than half of North Korea’s people are living in energy poverty.
Africa’s Access to Electricity
In 1995, a mere 20% of sub-Saharan Africa’s population had access to power. While today’s figure is above 40%, that still means roughly 600 million people in the region are living without access to electricity.
Not surprisingly, energy poverty disproportionately impacts rural Africans. Nearly all of the countries with the lowest levels of electricity access have rural-majority populations:
| Global Rank | Country | Electricity Access | Rural Population |
|---|---|---|---|
| #197 | 🇧🇮 Burundi | 9% | 87% |
| #196 | 🇹🇩 Chad | 11% | 77% |
| #195 | 🇲🇼 Malawi | 13% | 83% |
| #194 | 🇨🇩 D.R.C. | 19% | 56% |
| #193 | 🇳🇪 Niger | 20% | 84% |
| #192 | 🇱🇷 Liberia | 21% | 49% |
| #191 | 🇺🇬 Uganda | 22% | 77% |
| #190 | 🇸🇱 Sierra Leone | 23% | 58% |
| #189 | 🇲🇬 Madagascar | 24% | 63% |
| #188 | 🇧🇫 Burkina Faso | 25% | 71% |
Nonexistent and unreliable electricity isn’t just an issue confined to rural Africa. Even Nigeria — Africa’s largest economy — has an electrification rate of just 54%.
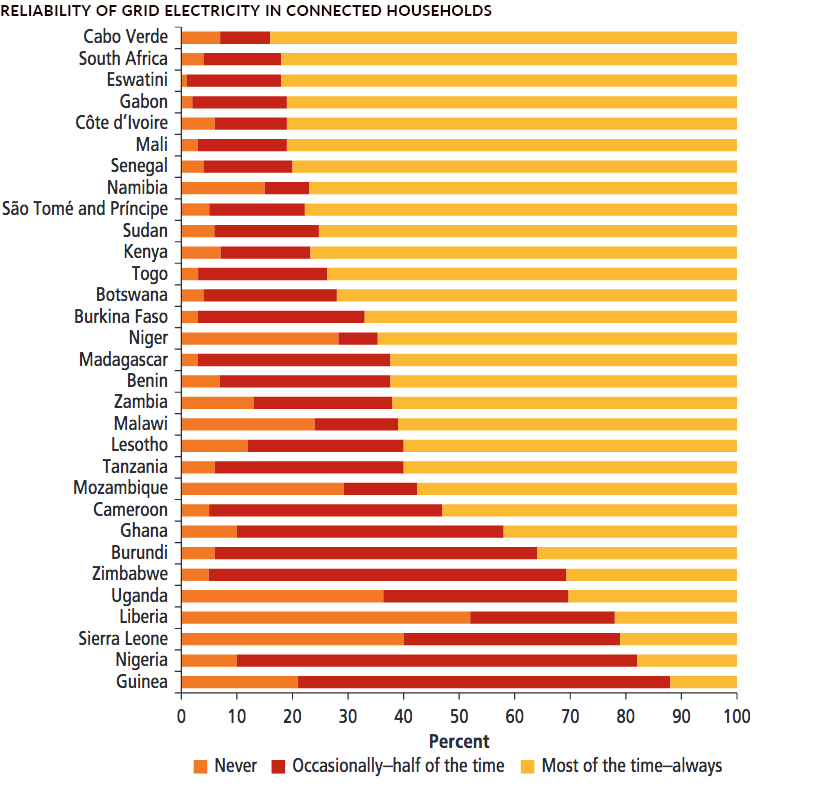
Where there is an electrical grid, instability is also causing problems. A recent survey found that a majority of Nigerian tech firms face 30 or more power outages per month, and more than half ranked electricity as a “major” or “severe” constraint to doing business.
This is pattern that is repeated in a number of countries in Africa:
Mini-Grids, Big Impact
It has taken an average of 25 years for countries to move from 20% to 80% access, so history suggests that it may be a number of years before sub-Saharan Africa fully catches up with other parts of the world. That said, Vietnam was able to close that gap in only nine years.
Traditional utility companies continue to make inroads in the region, but it might be a smaller-scale solution that brings electricity to people in harder-to-reach rural villages.
Between 2009 and 2015, solar PV module prices fell by 80%, ushering in a new era of affordability. Solar powered mini-grids don’t just have the potential to bring electricity to new markets, it can also replace the diesel-powered generators commonly used in Africa.
For the 600 million people in sub-Saharan Africa who are still unable to fully participate in the modern world, these innovations can’t come soon enough.


Energy
Charted: 4 Reasons Why Lithium Could Be the Next Gold Rush
Visual Capitalist has partnered with EnergyX to show why drops in prices and growing demand may make now the right time to invest in lithium.


4 Reasons Why You Should Invest in Lithium
Lithium’s importance in powering EVs makes it a linchpin of the clean energy transition and one of the world’s most precious minerals.
In this graphic, Visual Capitalist partnered with EnergyX to explore why now may be the time to invest in lithium.
1. Lithium Prices Have Dropped
One of the most critical aspects of evaluating an investment is ensuring that the asset’s value is higher than its price would indicate. Lithium is integral to powering EVs, and, prices have fallen fast over the last year:
| Date | LiOH·H₂O* | Li₂CO₃** |
|---|---|---|
| Feb 2023 | $76 | $71 |
| March 2023 | $71 | $61 |
| Apr 2023 | $43 | $33 |
| May 2023 | $43 | $33 |
| June 2023 | $47 | $45 |
| July 2023 | $44 | $40 |
| Aug 2023 | $35 | $35 |
| Sept 2023 | $28 | $27 |
| Oct 2023 | $24 | $23 |
| Nov 2023 | $21 | $21 |
| Dec 2023 | $17 | $16 |
| Jan 2024 | $14 | $15 |
| Feb 2024 | $13 | $14 |
Note: Monthly spot prices were taken as close to the 14th of each month as possible.
*Lithium hydroxide monohydrate MB-LI-0033
**Lithium carbonate MB-LI-0029
2. Lithium-Ion Battery Prices Are Also Falling
The drop in lithium prices is just one reason to invest in the metal. Increasing economies of scale, coupled with low commodity prices, have caused the cost of lithium-ion batteries to drop significantly as well.
In fact, BNEF reports that between 2013 and 2023, the price of a Li-ion battery dropped by 82%.
| Year | Price per KWh |
|---|---|
| 2023 | $139 |
| 2022 | $161 |
| 2021 | $150 |
| 2020 | $160 |
| 2019 | $183 |
| 2018 | $211 |
| 2017 | $258 |
| 2016 | $345 |
| 2015 | $448 |
| 2014 | $692 |
| 2013 | $780 |

3. EV Adoption is Sustainable
One of the best reasons to invest in lithium is that EVs, one of the main drivers behind the demand for lithium, have reached a price point similar to that of traditional vehicle.
According to the Kelly Blue Book, Tesla’s average transaction price dropped by 25% between 2022 and 2023, bringing it in line with many other major manufacturers and showing that EVs are a realistic transport option from a consumer price perspective.
| Manufacturer | September 2022 | September 2023 |
|---|---|---|
| BMW | $69,000 | $72,000 |
| Ford | $54,000 | $56,000 |
| Volkswagon | $54,000 | $56,000 |
| General Motors | $52,000 | $53,000 |
| Tesla | $68,000 | $51,000 |
4. Electricity Demand in Transport is Growing
As EVs become an accessible transport option, there’s an investment opportunity in lithium. But possibly the best reason to invest in lithium is that the IEA reports global demand for the electricity in transport could grow dramatically by 2030:
| Transport Type | 2022 | 2025 | 2030 |
|---|---|---|---|
| Buses 🚌 | 23,000 GWh | 50,000 GWh | 130,000 GWh |
| Cars 🚙 | 65,000 GWh | 200,000 GWh | 570,000 GWh |
| Trucks 🛻 | 4,000 GWh | 15,000 GWh | 94,000 GWh |
| Vans 🚐 | 6,000 GWh | 16,000 GWh | 72,000 GWh |
The Lithium Investment Opportunity
Lithium presents a potentially classic investment opportunity. Lithium and battery prices have dropped significantly, and recently, EVs have reached a price point similar to other vehicles. By 2030, the demand for clean energy, especially in transport, will grow dramatically.
With prices dropping and demand skyrocketing, now is the time to invest in lithium.
EnergyX is poised to exploit lithium demand with cutting-edge lithium extraction technology capable of extracting 300% more lithium than current processes.

-

 Lithium5 days ago
Ranked: The Top 10 EV Battery Manufacturers in 2023
Asia dominates this ranking of the world’s largest EV battery manufacturers in 2023.
-

 Energy1 week ago
The World’s Biggest Nuclear Energy Producers
China has grown its nuclear capacity over the last decade, now ranking second on the list of top nuclear energy producers.
-

 Energy1 month ago
The World’s Biggest Oil Producers in 2023
Just three countries accounted for 40% of global oil production last year.
-

 Energy1 month ago
How Much Does the U.S. Depend on Russian Uranium?
Currently, Russia is the largest foreign supplier of nuclear power fuel to the U.S.
-

 Uranium2 months ago
Charted: Global Uranium Reserves, by Country
We visualize the distribution of the world’s uranium reserves by country, with 3 countries accounting for more than half of total reserves.
-

 Energy3 months ago
Visualizing the Rise of the U.S. as Top Crude Oil Producer
Over the last decade, the United States has established itself as the world’s top producer of crude oil, surpassing Saudi Arabia and Russia.

-

 Debt1 week ago
How Debt-to-GDP Ratios Have Changed Since 2000
-

 Markets2 weeks ago
Ranked: The World’s Top Flight Routes, by Revenue
-

 Demographics2 weeks ago
Population Projections: The World’s 6 Largest Countries in 2075
-

 Markets2 weeks ago
The Top 10 States by Real GDP Growth in 2023
-

 Demographics2 weeks ago
The Smallest Gender Wage Gaps in OECD Countries
-

 Economy2 weeks ago
Where U.S. Inflation Hit the Hardest in March 2024
-

 Green2 weeks ago
Top Countries By Forest Growth Since 2001
-

 United States2 weeks ago
Ranked: The Largest U.S. Corporations by Number of Employees