Energy
Soaking up the Sun: Visualizing the Changing Patterns of Daylight in One Year
The darkest days are upon the residents of the Northern Hemisphere as daylight dwindles and the night lingers longer. Meanwhile, those in the Southern Hemisphere bask in their warmest and longest days—and those at the Equator continue to observe consistent days and nights.
These changing lengths of days and nights depend on where you are on Earth and the time of year. The tilt of the Earth’s axis and its path around the sun affect the number of daylight hours.
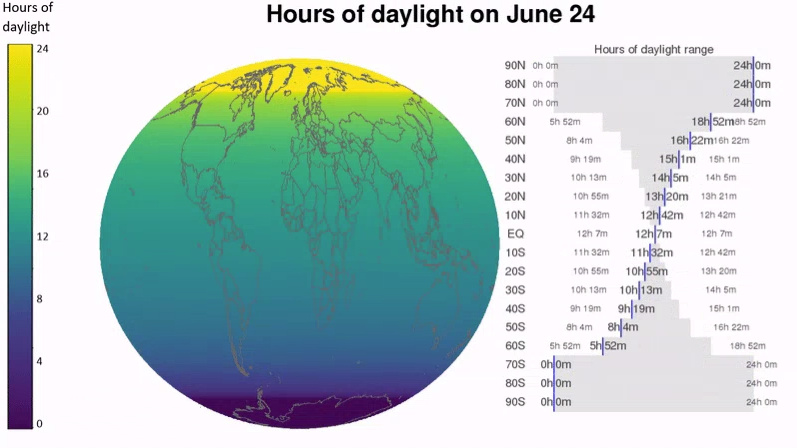
Today’s post highlights two simple and elegant animations that help demonstrate how different latitudes experience the sun’s light over the course of one year. The first comes from Reddit user harplass, while the second comes from data scientist Neil Kaye.
Longer and Shorter Days
The Ancient Greeks envisioned the movement of the sun as a Titan named Helios who rode across the sky in a horse-drawn chariot, illuminating the known world below. A rosy-fingered dawn would herald his imminent arrival, while the arrival of the dusk god Astraeus, ever on Helios’ heels, marked the passage of day into night.
Today, time is not at the whims of Greek mythology but by the measurable and consistent movement of celestial bodies. A day on Earth is 24 hours long, but not every day has 12 hours of daylight and 12 hours of night. The actual time of one Earth rotation is a little shorter–about 23 hours and 56 minutes.
Daytime is shorter in winter than in summer, for each hemisphere. This is because the Earth’s imaginary axis isn’t straight up and down, it is tilted 23.5 degrees. The Earth’s movement around this axis causes the change between day and night.
During summer in the Northern Hemisphere, daylight hours increase the farther north you go. The Arctic gets very little darkness at night. The seasonal changes in daylight hours are small near the Equator and more extreme close to the poles.
Length of a Rotation: Equinoxes and Solstices
There are four events that mark the passing stages of the sun, equinoxes and solstices.
The two solstices happen June 20 or 21 and December 21 or 22. These are the days when the sun’s path in the sky is the farthest north or south from the Equator. A hemisphere’s winter solstice is the shortest day of the year and the summer solstice the year’s longest.
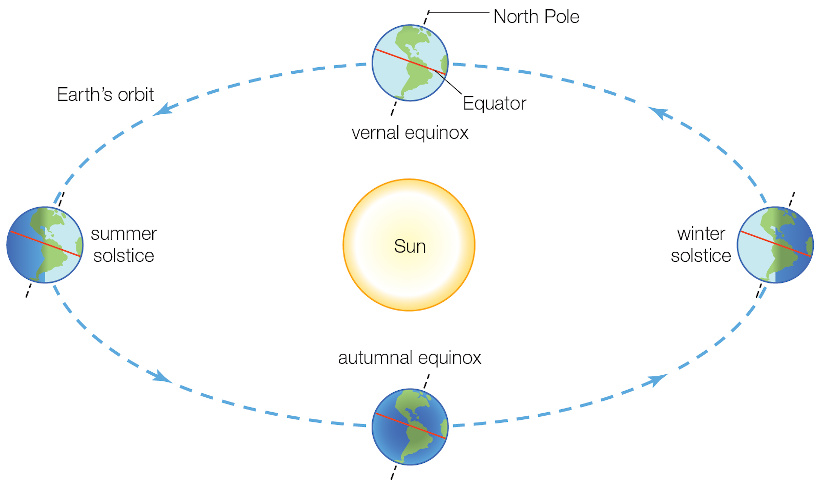
In the Northern Hemisphere the June solstice marks the start of summer: this is when the North Pole is tilted closest to the sun, and the sun’s rays are directly overhead at the Tropic of Cancer.
The December solstice marks the start of winter when the South Pole is tilted closest to the sun, and the sun’s rays are directly overhead the Tropic of Capricorn.
The equinoxes happen around March 21 and September 23. These are the days when the sun is exactly above the Equator, which makes day and night of equal length.
Stand in the Place Where You Are
It is always darkest before the dawn, and every passing of solstice marks a time of change. As the Northern Hemisphere heads into the winter holiday season, it also marks the advent of longer days and the inevitable spring and summer.
The lengths of days and nights are constantly changing, but every one will get their time in the sun, at some point.


Energy
Charted: 4 Reasons Why Lithium Could Be the Next Gold Rush
Visual Capitalist has partnered with EnergyX to show why drops in prices and growing demand may make now the right time to invest in lithium.


4 Reasons Why You Should Invest in Lithium
Lithium’s importance in powering EVs makes it a linchpin of the clean energy transition and one of the world’s most precious minerals.
In this graphic, Visual Capitalist partnered with EnergyX to explore why now may be the time to invest in lithium.
1. Lithium Prices Have Dropped
One of the most critical aspects of evaluating an investment is ensuring that the asset’s value is higher than its price would indicate. Lithium is integral to powering EVs, and, prices have fallen fast over the last year:
| Date | LiOH·H₂O* | Li₂CO₃** |
|---|---|---|
| Feb 2023 | $76 | $71 |
| March 2023 | $71 | $61 |
| Apr 2023 | $43 | $33 |
| May 2023 | $43 | $33 |
| June 2023 | $47 | $45 |
| July 2023 | $44 | $40 |
| Aug 2023 | $35 | $35 |
| Sept 2023 | $28 | $27 |
| Oct 2023 | $24 | $23 |
| Nov 2023 | $21 | $21 |
| Dec 2023 | $17 | $16 |
| Jan 2024 | $14 | $15 |
| Feb 2024 | $13 | $14 |
Note: Monthly spot prices were taken as close to the 14th of each month as possible.
*Lithium hydroxide monohydrate MB-LI-0033
**Lithium carbonate MB-LI-0029
2. Lithium-Ion Battery Prices Are Also Falling
The drop in lithium prices is just one reason to invest in the metal. Increasing economies of scale, coupled with low commodity prices, have caused the cost of lithium-ion batteries to drop significantly as well.
In fact, BNEF reports that between 2013 and 2023, the price of a Li-ion battery dropped by 82%.
| Year | Price per KWh |
|---|---|
| 2023 | $139 |
| 2022 | $161 |
| 2021 | $150 |
| 2020 | $160 |
| 2019 | $183 |
| 2018 | $211 |
| 2017 | $258 |
| 2016 | $345 |
| 2015 | $448 |
| 2014 | $692 |
| 2013 | $780 |

3. EV Adoption is Sustainable
One of the best reasons to invest in lithium is that EVs, one of the main drivers behind the demand for lithium, have reached a price point similar to that of traditional vehicle.
According to the Kelly Blue Book, Tesla’s average transaction price dropped by 25% between 2022 and 2023, bringing it in line with many other major manufacturers and showing that EVs are a realistic transport option from a consumer price perspective.
| Manufacturer | September 2022 | September 2023 |
|---|---|---|
| BMW | $69,000 | $72,000 |
| Ford | $54,000 | $56,000 |
| Volkswagon | $54,000 | $56,000 |
| General Motors | $52,000 | $53,000 |
| Tesla | $68,000 | $51,000 |
4. Electricity Demand in Transport is Growing
As EVs become an accessible transport option, there’s an investment opportunity in lithium. But possibly the best reason to invest in lithium is that the IEA reports global demand for the electricity in transport could grow dramatically by 2030:
| Transport Type | 2022 | 2025 | 2030 |
|---|---|---|---|
| Buses 🚌 | 23,000 GWh | 50,000 GWh | 130,000 GWh |
| Cars 🚙 | 65,000 GWh | 200,000 GWh | 570,000 GWh |
| Trucks 🛻 | 4,000 GWh | 15,000 GWh | 94,000 GWh |
| Vans 🚐 | 6,000 GWh | 16,000 GWh | 72,000 GWh |
The Lithium Investment Opportunity
Lithium presents a potentially classic investment opportunity. Lithium and battery prices have dropped significantly, and recently, EVs have reached a price point similar to other vehicles. By 2030, the demand for clean energy, especially in transport, will grow dramatically.
With prices dropping and demand skyrocketing, now is the time to invest in lithium.
EnergyX is poised to exploit lithium demand with cutting-edge lithium extraction technology capable of extracting 300% more lithium than current processes.

-

 Lithium4 days ago
Ranked: The Top 10 EV Battery Manufacturers in 2023
Asia dominates this ranking of the world’s largest EV battery manufacturers in 2023.
-

 Energy1 week ago
The World’s Biggest Nuclear Energy Producers
China has grown its nuclear capacity over the last decade, now ranking second on the list of top nuclear energy producers.
-

 Energy1 month ago
The World’s Biggest Oil Producers in 2023
Just three countries accounted for 40% of global oil production last year.
-

 Energy1 month ago
How Much Does the U.S. Depend on Russian Uranium?
Currently, Russia is the largest foreign supplier of nuclear power fuel to the U.S.
-

 Uranium2 months ago
Charted: Global Uranium Reserves, by Country
We visualize the distribution of the world’s uranium reserves by country, with 3 countries accounting for more than half of total reserves.
-

 Energy3 months ago
Visualizing the Rise of the U.S. as Top Crude Oil Producer
Over the last decade, the United States has established itself as the world’s top producer of crude oil, surpassing Saudi Arabia and Russia.

-

 Debt1 week ago
How Debt-to-GDP Ratios Have Changed Since 2000
-

 Markets2 weeks ago
Ranked: The World’s Top Flight Routes, by Revenue
-

 Countries2 weeks ago
Population Projections: The World’s 6 Largest Countries in 2075
-

 Markets2 weeks ago
The Top 10 States by Real GDP Growth in 2023
-

 Demographics2 weeks ago
The Smallest Gender Wage Gaps in OECD Countries
-

 United States2 weeks ago
Where U.S. Inflation Hit the Hardest in March 2024
-

 Green2 weeks ago
Top Countries By Forest Growth Since 2001
-

 United States2 weeks ago
Ranked: The Largest U.S. Corporations by Number of Employees