Energy
Breaking the Ice: Mapping a Changing Arctic


Breaking the Ice: Mapping a Changing Arctic
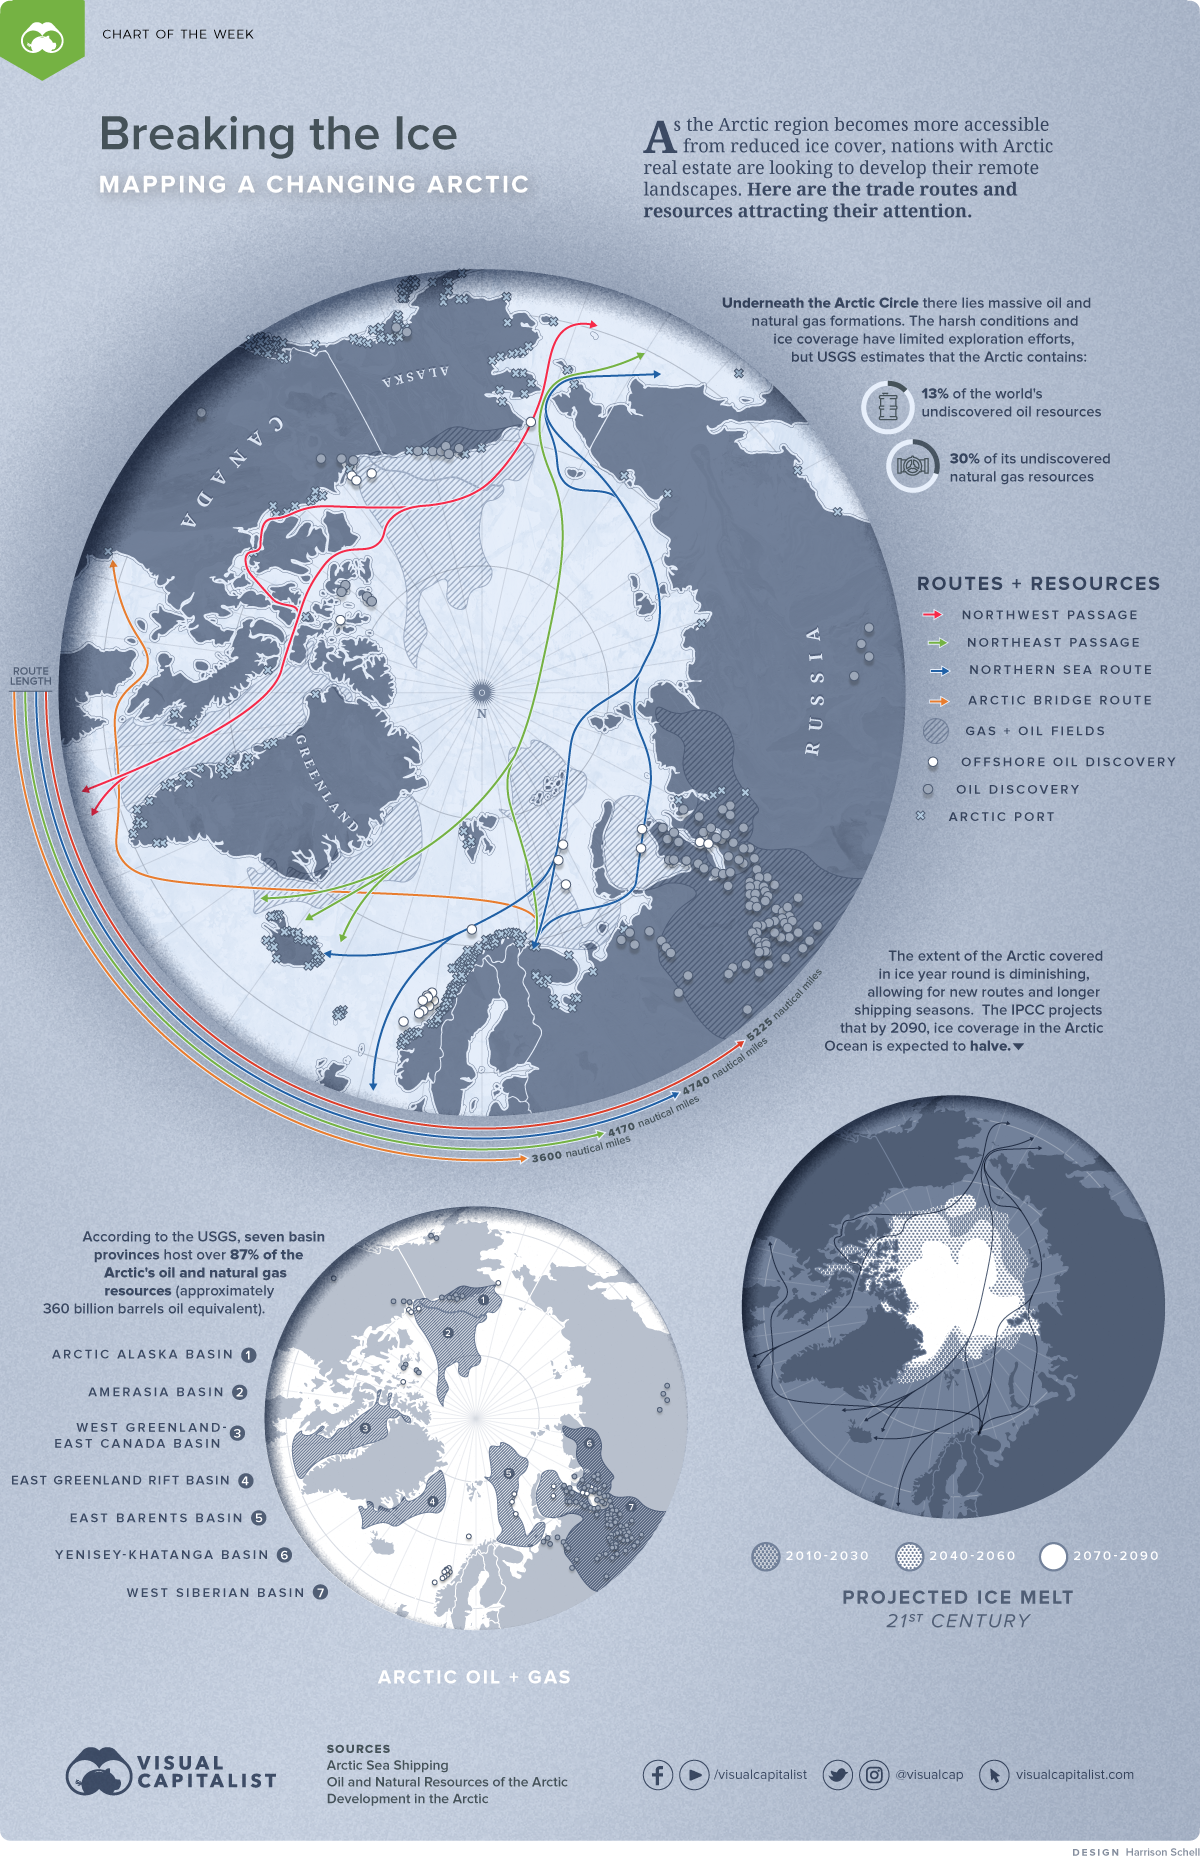
The Arctic is changing. As retreating ice cover makes this region more accessible, nations with Arctic real estate are thinking of developing these subzero landscapes and the resources below.
As the Arctic evolves, a vast amount of resources will become more accessible and longer shipping seasons will improve Arctic logistics. But with a changing climate and increased public pressure to limit resource development in environmentally sensitive regions, the future of northern economic activity is far from certain.
This week’s Chart of the Week shows the location of major oil and gas fields in the Arctic and the possible new trade routes through this frontier.
A Final Frontier for Undiscovered Resources?
Underneath the Arctic Circle lies massive oil and natural gas formations. The United States Geological Survey estimates that the Arctic contains approximately 13% of the world’s undiscovered oil resources and about 30% of its undiscovered natural gas resources.
So far, most exploration in the Arctic has occurred on land. This work produced the Prudhoe Bay Oil Field in Alaska, the Tazovskoye Field in Russia, and hundreds of smaller fields, many of which are on Alaska’s North Slope, an area now under environmental protection.
Land accounts for about 1/3 of the Arctic’s area and is thought to hold about 16% of the Arctic’s remaining undiscovered oil and gas resources. A further 1/3 of the Arctic area is comprised of offshore continental shelves, which are thought to contain enormous amounts of resources but remain largely unexplored by geologists.
The remaining 1/3 of the Arctic is deep ocean waters measuring thousands of feet in depth.
The Arctic circle is about the same geographic size as the African continent─about 6% of Earth’s surface area─yet it holds an estimated 22% of Earth’s oil and natural gas resources. This paints a target on the Arctic for exploration and development, especially with shorter seasons of ice coverage improving ocean access.
Thawing Ice Cover: Improved Ocean Access, New Trading Routes
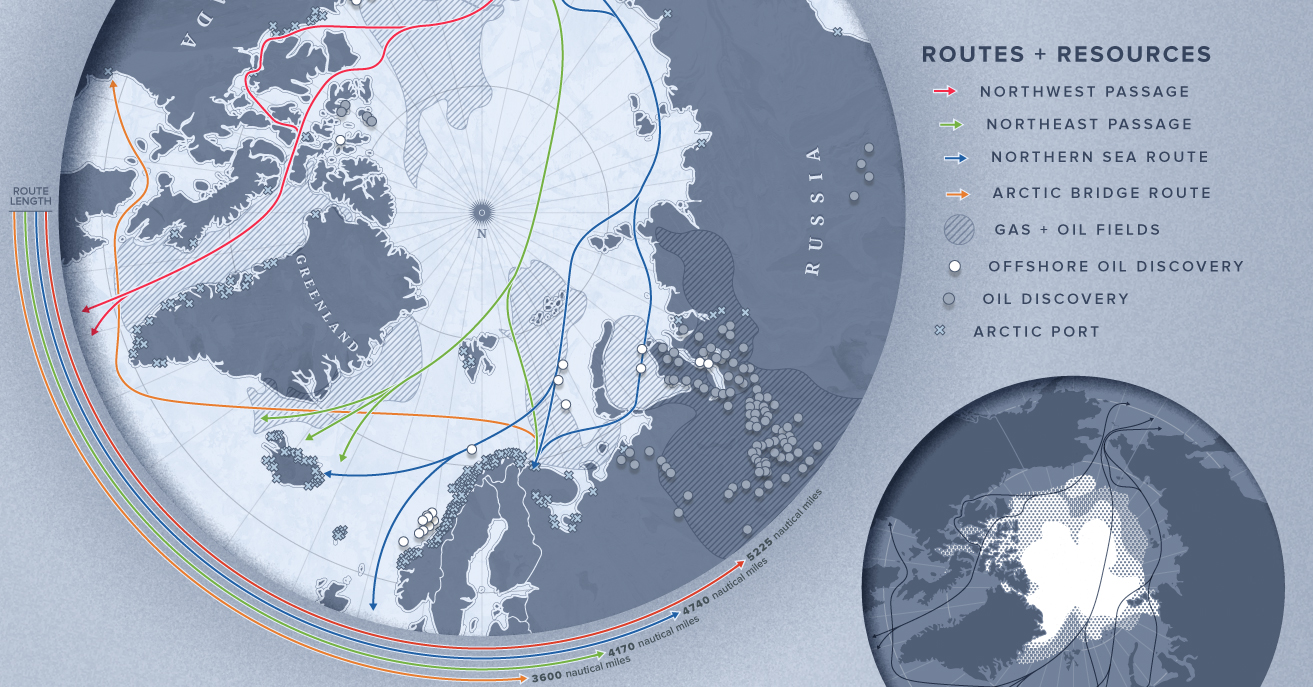
As Arctic ice melts, sea routes will stay navigable for longer periods, which could drastically change international trade and shipping. September ice coverage has decreased by more than 25% since 1979, although the area within the Arctic Circle is still almost entirely covered with ice from November to July.
| Route | Length | Ice-free Time |
|---|---|---|
| Northern Sea Route | 4,740 Nautical Miles | 6 weeks of open waters |
| Transpolar Sea Route | 4,179 Nautical Miles | 2 weeks of open waters |
| Northwest Passage | 5,225 Nautical Miles | Periodically ice-free |
| Arctic Bridge | 3,600 Nautical Miles | Ice-free |
Typically shipping to Japan from Rotterdam would use the Suez Canal and take about 30 days, whereas a route from New York would use the Panama Canal and take about 25 days.
But if the Europe-Asia trip used the Northern Sea Route along the northern coast of Russia, the trip would last 18 days and the distance would shrink from ~11,500 nautical miles to ~6,900 nautical miles. For the U.S.-Asia trip through the Northwest Passage, it would take 21 days, rather than 25.
Control of these routes could bring significant advantages to countries and corporations looking for a competitive edge.
Competing Interests: Arctic Neighbors
Eight countries lay claim to land that lies within the Arctic Circle: Canada, Denmark (through its administration of Greenland), Finland, Iceland, Norway, Russia, Sweden, and the United States.
There is no consistent agreement among these nations regarding the claims to oil and gas beneath the Arctic Ocean seafloor. However, the United Nations Convention on the Law of the Sea provides each country an exclusive economic zone extending 200 miles out from its shoreline and up to 350 miles, under certain geological conditions.
Uncertain geology and politics has led to overlapping territorial disputes over how each nation defines and maps its claims based on the edge of continental margins. For example, Russia claims that their continental margin follows the Lomonosov Ridge all the way to the North Pole. In another, both the U.S. and Canada claim a portion of the Beaufort Sea, which is thought to contain significant oil and natural gas resources.
To Develop or Not to Develop
Just because the resources are there does not mean humans have to exploit them, especially given oil’s environmental impacts. Canada’s federal government has already returned security deposits that oil majors had paid to drill in Canadian Arctic waters, which are currently off limits until at least 2021.
In total, the Government of Canada returned US$327 million worth of security deposits, or 25% of the money oil companies pledged to spend on exploration in the Beaufort Sea. In addition, Goldman Sachs announced that it would not finance any projects in the U.S.’s Arctic National Wildlife Refuge.
The retreat of Western economic interests in the Arctic may leave the region to Russia and China, countries with less strict environmental regulations.
Russia has launched an ambitious plan to remilitarize the Arctic. Specifically, Russia is searching for evidence to prove its territorial claims to additional portions of the Arctic, so that it can move its Arctic borderline — which currently measures over 14,000 miles in length — further north.
In a changing Arctic, this potentially resource-rich region could become another venue for geopolitical tensions, again testing whether humans can be proper stewards of the natural world.


Energy
Charted: 4 Reasons Why Lithium Could Be the Next Gold Rush
Visual Capitalist has partnered with EnergyX to show why drops in prices and growing demand may make now the right time to invest in lithium.


4 Reasons Why You Should Invest in Lithium
Lithium’s importance in powering EVs makes it a linchpin of the clean energy transition and one of the world’s most precious minerals.
In this graphic, Visual Capitalist partnered with EnergyX to explore why now may be the time to invest in lithium.
1. Lithium Prices Have Dropped
One of the most critical aspects of evaluating an investment is ensuring that the asset’s value is higher than its price would indicate. Lithium is integral to powering EVs, and, prices have fallen fast over the last year:
| Date | LiOH·H₂O* | Li₂CO₃** |
|---|---|---|
| Feb 2023 | $76 | $71 |
| March 2023 | $71 | $61 |
| Apr 2023 | $43 | $33 |
| May 2023 | $43 | $33 |
| June 2023 | $47 | $45 |
| July 2023 | $44 | $40 |
| Aug 2023 | $35 | $35 |
| Sept 2023 | $28 | $27 |
| Oct 2023 | $24 | $23 |
| Nov 2023 | $21 | $21 |
| Dec 2023 | $17 | $16 |
| Jan 2024 | $14 | $15 |
| Feb 2024 | $13 | $14 |
Note: Monthly spot prices were taken as close to the 14th of each month as possible.
*Lithium hydroxide monohydrate MB-LI-0033
**Lithium carbonate MB-LI-0029
2. Lithium-Ion Battery Prices Are Also Falling
The drop in lithium prices is just one reason to invest in the metal. Increasing economies of scale, coupled with low commodity prices, have caused the cost of lithium-ion batteries to drop significantly as well.
In fact, BNEF reports that between 2013 and 2023, the price of a Li-ion battery dropped by 82%.
| Year | Price per KWh |
|---|---|
| 2023 | $139 |
| 2022 | $161 |
| 2021 | $150 |
| 2020 | $160 |
| 2019 | $183 |
| 2018 | $211 |
| 2017 | $258 |
| 2016 | $345 |
| 2015 | $448 |
| 2014 | $692 |
| 2013 | $780 |

3. EV Adoption is Sustainable
One of the best reasons to invest in lithium is that EVs, one of the main drivers behind the demand for lithium, have reached a price point similar to that of traditional vehicle.
According to the Kelly Blue Book, Tesla’s average transaction price dropped by 25% between 2022 and 2023, bringing it in line with many other major manufacturers and showing that EVs are a realistic transport option from a consumer price perspective.
| Manufacturer | September 2022 | September 2023 |
|---|---|---|
| BMW | $69,000 | $72,000 |
| Ford | $54,000 | $56,000 |
| Volkswagon | $54,000 | $56,000 |
| General Motors | $52,000 | $53,000 |
| Tesla | $68,000 | $51,000 |
4. Electricity Demand in Transport is Growing
As EVs become an accessible transport option, there’s an investment opportunity in lithium. But possibly the best reason to invest in lithium is that the IEA reports global demand for the electricity in transport could grow dramatically by 2030:
| Transport Type | 2022 | 2025 | 2030 |
|---|---|---|---|
| Buses 🚌 | 23,000 GWh | 50,000 GWh | 130,000 GWh |
| Cars 🚙 | 65,000 GWh | 200,000 GWh | 570,000 GWh |
| Trucks 🛻 | 4,000 GWh | 15,000 GWh | 94,000 GWh |
| Vans 🚐 | 6,000 GWh | 16,000 GWh | 72,000 GWh |
The Lithium Investment Opportunity
Lithium presents a potentially classic investment opportunity. Lithium and battery prices have dropped significantly, and recently, EVs have reached a price point similar to other vehicles. By 2030, the demand for clean energy, especially in transport, will grow dramatically.
With prices dropping and demand skyrocketing, now is the time to invest in lithium.
EnergyX is poised to exploit lithium demand with cutting-edge lithium extraction technology capable of extracting 300% more lithium than current processes.

-

 Lithium4 days ago
Ranked: The Top 10 EV Battery Manufacturers in 2023
Asia dominates this ranking of the world’s largest EV battery manufacturers in 2023.
-

 Energy1 week ago
The World’s Biggest Nuclear Energy Producers
China has grown its nuclear capacity over the last decade, now ranking second on the list of top nuclear energy producers.
-

 Energy1 month ago
The World’s Biggest Oil Producers in 2023
Just three countries accounted for 40% of global oil production last year.
-

 Energy1 month ago
How Much Does the U.S. Depend on Russian Uranium?
Currently, Russia is the largest foreign supplier of nuclear power fuel to the U.S.
-

 Uranium2 months ago
Charted: Global Uranium Reserves, by Country
We visualize the distribution of the world’s uranium reserves by country, with 3 countries accounting for more than half of total reserves.
-

 Energy3 months ago
Visualizing the Rise of the U.S. as Top Crude Oil Producer
Over the last decade, the United States has established itself as the world’s top producer of crude oil, surpassing Saudi Arabia and Russia.


-

 Debt1 week ago
How Debt-to-GDP Ratios Have Changed Since 2000
-

 Markets2 weeks ago
Ranked: The World’s Top Flight Routes, by Revenue
-

 Countries2 weeks ago
Population Projections: The World’s 6 Largest Countries in 2075
-

 Markets2 weeks ago
The Top 10 States by Real GDP Growth in 2023
-

 Demographics2 weeks ago
The Smallest Gender Wage Gaps in OECD Countries
-

 United States2 weeks ago
Where U.S. Inflation Hit the Hardest in March 2024
-

 Green2 weeks ago
Top Countries By Forest Growth Since 2001
-

 United States2 weeks ago
Ranked: The Largest U.S. Corporations by Number of Employees