Misc
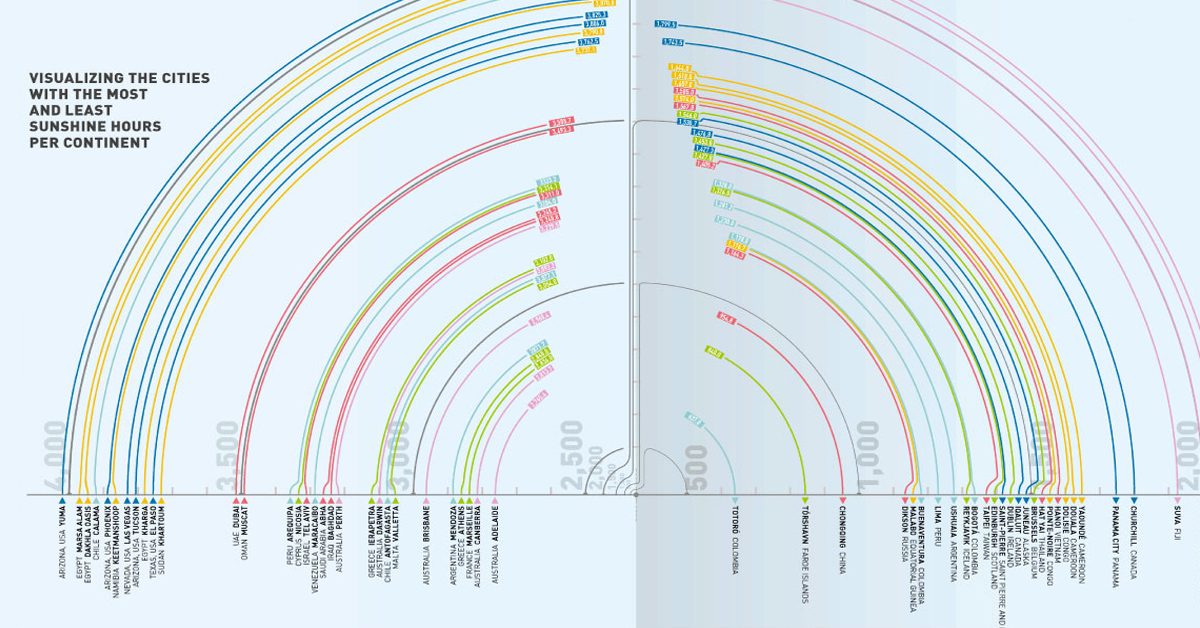
World Cities Ranked by Average Annual Sunshine Hours
View the full size version of this infographic
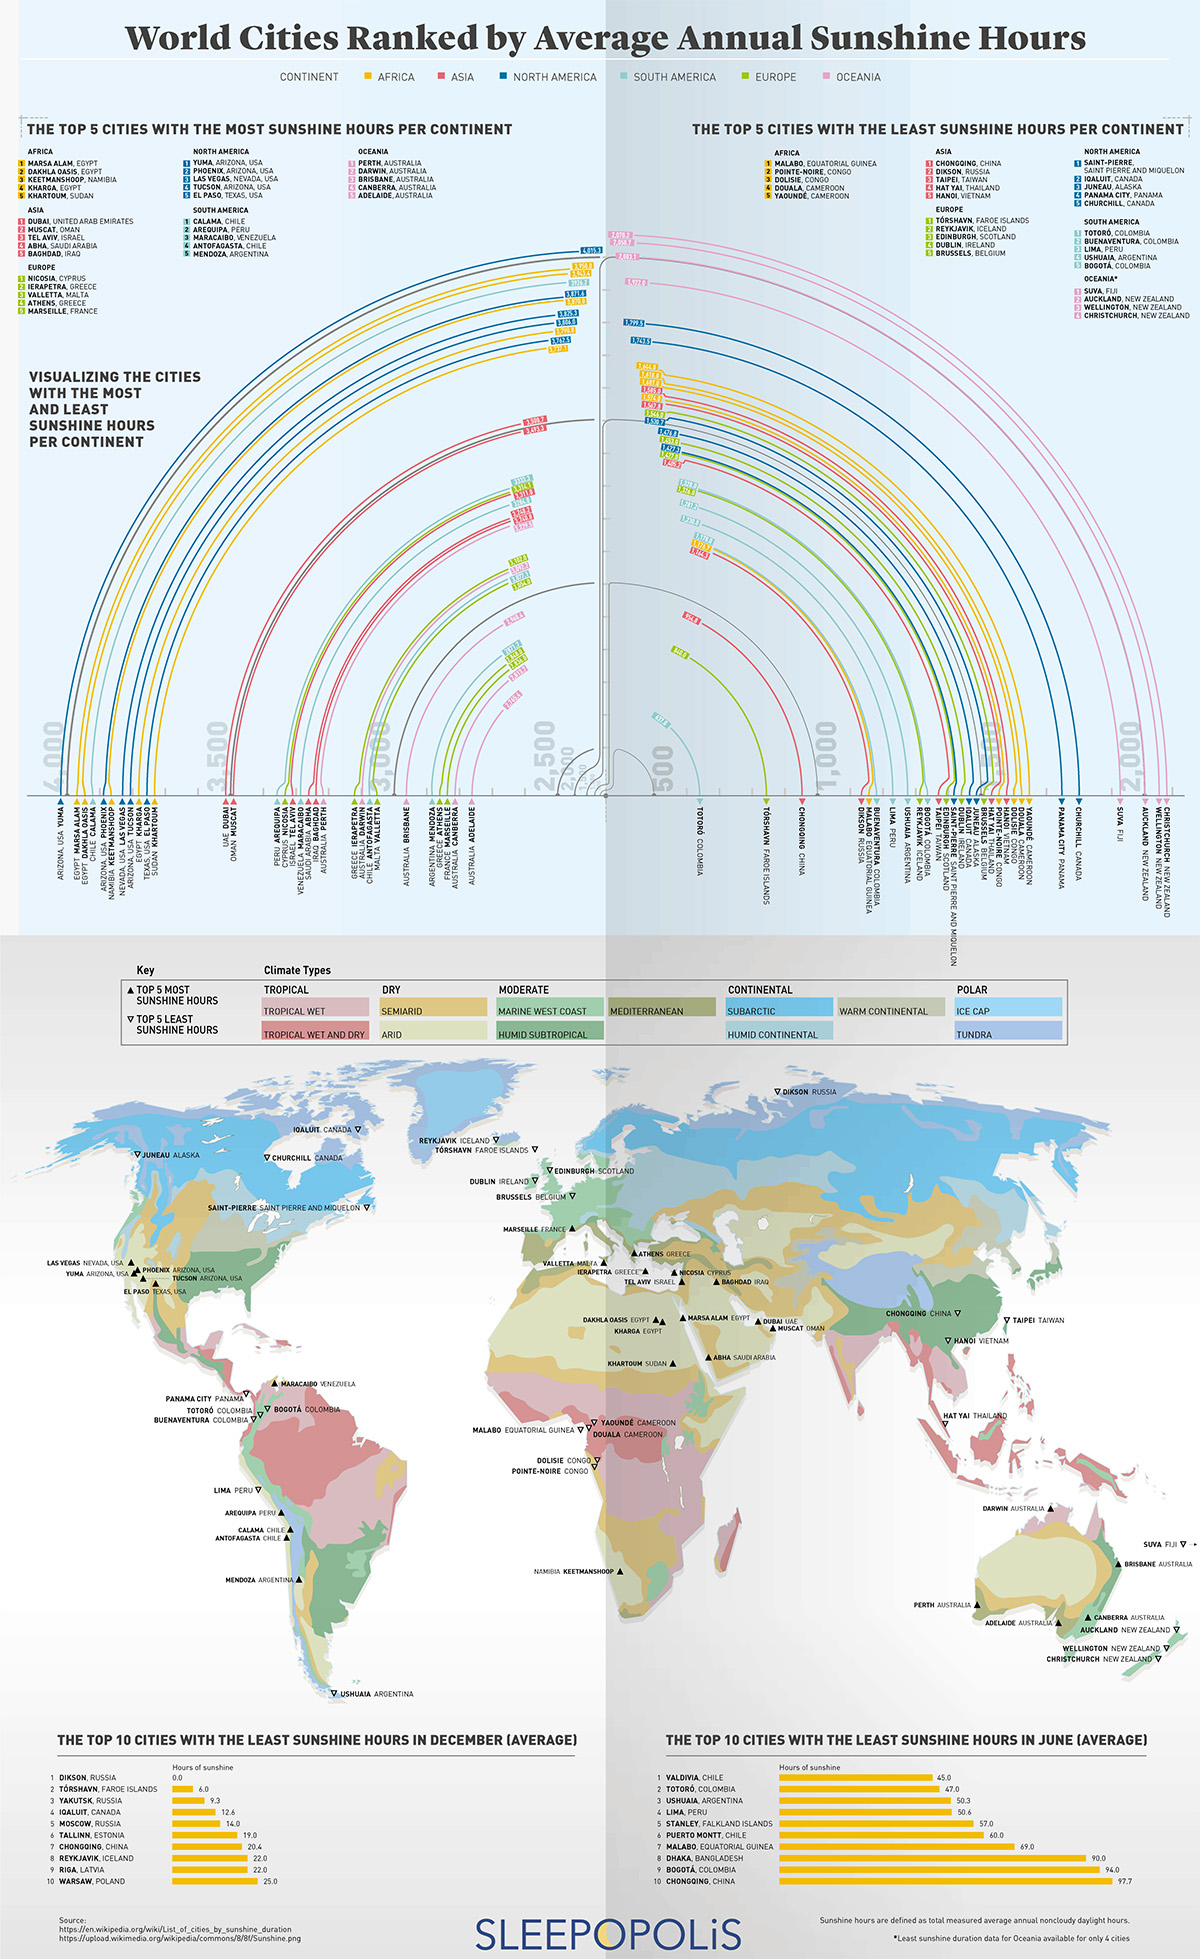
World Cities Ranked by Average Annual Sunshine Hours
View the high resolution of this infographic by clicking here
While we all see the same sky, we see it a bit differently depending on where we stand.
For those in the planet’s most extreme regions, the sun doesn’t follow the same pattern of seasons as it does in more temperate regions.
Today’s visualization comes from Sleepopolis and summarizes the top cities on each continent that receive the most and least annual sunshine hours.
Ranked: Cities with the Least and Most Sunshine Hours
While the graphic groups the top five cities from each continent, the tables below highlight the top 10 cities from around the world that boast the highest and lowest annual sunshine hours.
Top 10 Cities with the Most Annual Sunshine
| City | Country | Climate | # of Sunshine Hours |
|---|---|---|---|
| Yuma | United States | Arid | 4,015.3 |
| Marsa Alam | Egypt | Arid | 3,958.0 |
| Dakhla Oasis | Egypt | Arid | 3,943.4 |
| Calama | Chile | Arid, Marine West Coast, Tundra | 3,926.2 |
| Phoenix | United States | Arid | 3,871.6 |
| Keetmanshoop | Namibia | Arid | 3,870.0 |
| Las Vegas | United States | Arid | 3,825.3 |
| Tucson | United States | Arid | 3,806.0 |
| Kharga | Egypt | Arid | 3,790.8 |
| El Paso | United States | Semiarid | 3,762.5 |
The sunniest city on Earth is Yuma, Arizona in the U.S. As the driest city in the U.S., Yuma receives less than 200 millimeters (8 inches) of rainfall and endures roughly 100 days of 40°C (104°F) weather every year. Yuma lies between the Gila and Colorado rivers, in a lush region that produces almost 90% of leafy vegetables grown in the U.S.
Arizona boasts three of the top 10 sunniest cities in the world, including Phoenix in the fifth spot, which is the 5th most populous city in the U.S. and is known as “the Valley of the Sun”.
Perhaps unsurprisingly, Egypt also has three cities in the top 10 list, with Marsa Alam, Dakhla Oasis, and Kharga claiming the 2nd, 3rd, and 9th sunniest spots, respectively. Dakhla Oasis, or “inner oasis”, receives practically zero precipitation each year.
Top 10 Cities with the Least Annual Sunshine
| City | Country | Climate | # of Sunshine Hours |
|---|---|---|---|
| Totoró | Colombia | Marine West Coast | 637.0 |
| Tórshavn | Faroe Islands | Marine West Coast | 840.0 |
| Chongqing | China | Humid Subtropical | 954.8 |
| Dikson | Russia | Tundra | 1,164.3 |
| Malabo | Equatorial Guinea | Tropical Wet and Dry | 1,176.7 |
| Buenaventura | Colombia | Tropical Wet and Dry, Humid Subtropical | 1,178.0 |
| Lima | Peru | Arid | 1,230.0 |
| Ushuaia | Argentina | Tundra | 1,281.2 |
| Reykjavik | Iceland | Tundra, Marine West Coast | 1,326.0 |
| Bogotá | Colombia | Marine West Coast | 1,328.0 |
Although perceived as a sunny location, Colombia borders both the Caribbean Sea and the Pacific Ocean, exposing it to higher variety in weather patterns and precipitation. Colombia alone is home to three of the top 10 cities with the lowest hours of annual sunshine.
Ranking second-to-last in the number of sunshine hours, Torshavn lies between the Scottish coast and Iceland and receives roughly 37 days of sunshine every year; the average temperatures on this island barely reach above 5°C (41°F).
Our sun doesn’t shine at the same level of brightness all the time. NASA has observed that the sun goes through “solar cycles” that last roughly 11 years─brightening and dimming at relatively regular intervals and impacting how intensely we receive sunlight at any given time.
Sunshine Near the Poles
Humans typically need exposure to the sun to maintain healthy sleep habits, as our brain has been hardwired to follow natural waking and sleeping rhythms.
However, several cities experience no sun at all for several months at a time in what’s known as the “Polar Night”.
- Tromsø, Norway: winter darkness is enjoyed rather than endured, as it can last for over a month
- Svalbard, Norway: even indirect sunlight is absent, with no change in sunlight to help indicate a 24-hour day
- Dikson, Russia: receives no sunlight whatsoever in December
Wherever you live, people have been watching and tracking the movements of the sun with rapt attention for millennia, even when we couldn’t see it.


VC+
VC+: Get Our Key Takeaways From the IMF’s World Economic Outlook
A sneak preview of the exclusive VC+ Special Dispatch—your shortcut to understanding IMF’s World Economic Outlook report.

Have you read IMF’s latest World Economic Outlook yet? At a daunting 202 pages, we don’t blame you if it’s still on your to-do list.
But don’t worry, you don’t need to read the whole April release, because we’ve already done the hard work for you.
To save you time and effort, the Visual Capitalist team has compiled a visual analysis of everything you need to know from the report—and our VC+ Special Dispatch is available exclusively to VC+ members. All you need to do is log into the VC+ Archive.
If you’re not already subscribed to VC+, make sure you sign up now to access the full analysis of the IMF report, and more (we release similar deep dives every week).
For now, here’s what VC+ members get to see.
Your Shortcut to Understanding IMF’s World Economic Outlook
With long and short-term growth prospects declining for many countries around the world, this Special Dispatch offers a visual analysis of the key figures and takeaways from the IMF’s report including:
- The global decline in economic growth forecasts
- Real GDP growth and inflation forecasts for major nations in 2024
- When interest rate cuts will happen and interest rate forecasts
- How debt-to-GDP ratios have changed since 2000
- And much more!

Get the Full Breakdown in the Next VC+ Special Dispatch
VC+ members can access the full Special Dispatch by logging into the VC+ Archive, where you can also check out previous releases.
Make sure you join VC+ now to see exclusive charts and the full analysis of key takeaways from IMF’s World Economic Outlook.
Don’t miss out. Become a VC+ member today.
What You Get When You Become a VC+ Member
VC+ is Visual Capitalist’s premium subscription. As a member, you’ll get the following:
- Special Dispatches: Deep dive visual briefings on crucial reports and global trends
- Markets This Month: A snappy summary of the state of the markets and what to look out for
- The Trendline: Weekly curation of the best visualizations from across the globe
- Global Forecast Series: Our flagship annual report that covers everything you need to know related to the economy, markets, geopolitics, and the latest tech trends
- VC+ Archive: Hundreds of previously released VC+ briefings and reports that you’ve been missing out on, all in one dedicated hub
You can get all of the above, and more, by joining VC+ today.

-

 Debt1 week ago
How Debt-to-GDP Ratios Have Changed Since 2000
-

 Markets2 weeks ago
Ranked: The World’s Top Flight Routes, by Revenue
-

 Countries2 weeks ago
Population Projections: The World’s 6 Largest Countries in 2075
-

 Markets2 weeks ago
The Top 10 States by Real GDP Growth in 2023
-

 Demographics2 weeks ago
The Smallest Gender Wage Gaps in OECD Countries
-

 United States2 weeks ago
Where U.S. Inflation Hit the Hardest in March 2024
-

 Green2 weeks ago
Top Countries By Forest Growth Since 2001
-

 United States2 weeks ago
Ranked: The Largest U.S. Corporations by Number of Employees