Misc
Ranked: Top 10 Cities Where International Travelers Spend the Most
Top 10 Cities Where International Travelers Spend the Most
When it comes to travel, some tourists spare no expense. And some cities are well suited to attract them.
From the luxurious desert city of Dubai to the city of light and love, Paris, many international travelers today are looking to tick the crème de la crème of destinations off their bucket lists. In some cases, they’re seeking out the opulent experiences they missed out on when the pandemic brought the world to a halt.
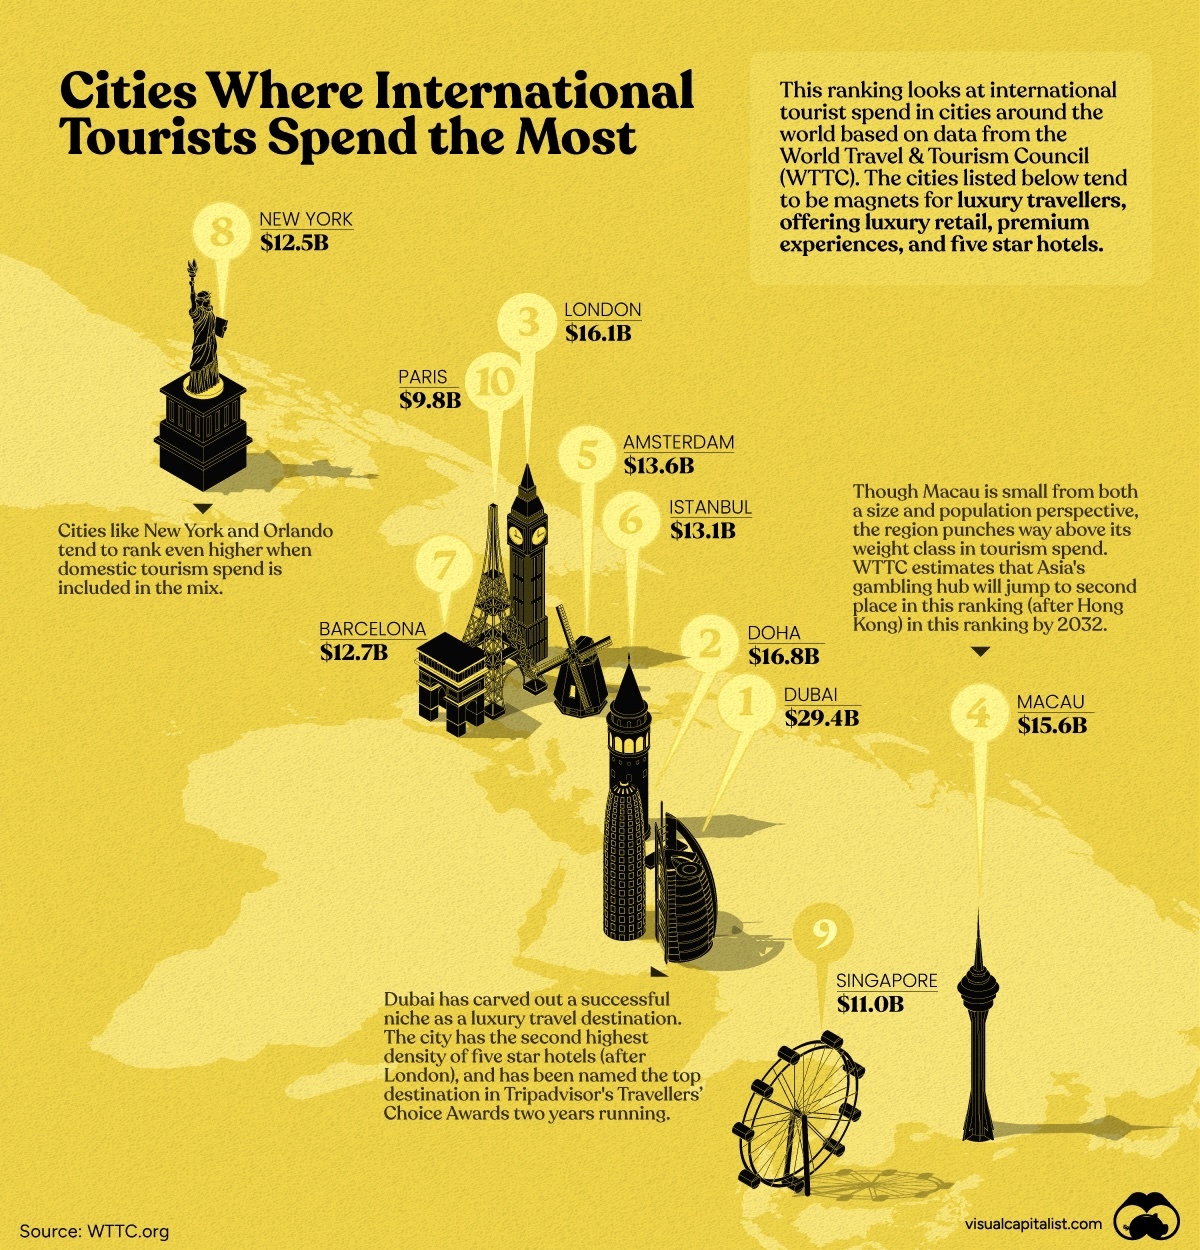
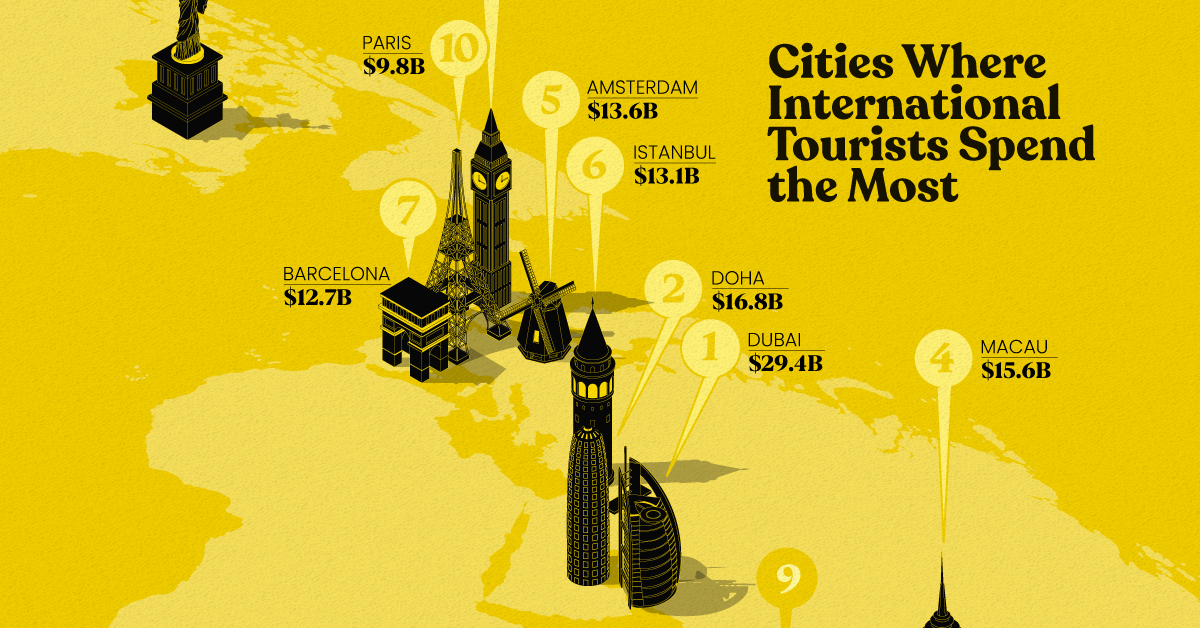
In this graphic, we use the latest research by the World Travel and Tourism Council (WTTC) to highlight the top 10 cities where international travelers spent the most in 2022.
Cities of Opulence
Last year, Dubai took top spot, followed by nearby Doha, Qatar.
| Rank | City | Country / Region | Income from International Tourists (2022) |
|---|---|---|---|
| #1 | Dubai | 🇦🇪 UAE | $29.42B |
| #2 | Doha | 🇶🇦 Qatar | $16.79B |
| #3 | London | 🇬🇧 UK | $16.07B |
| #4 | Macau | 🇲🇴 Macau SAR | $15.58B |
| #5 | Amsterdam | 🇳🇱 Netherlands | $13.59B |
| #6 | Istanbul | 🇹🇷 Türkiye | $13.13B |
| #7 | Barcelona | 🇪🇸 Spain | $12.73B |
| #8 | New York | 🇺🇸 U.S. | $12.45B |
| #9 | Singapore | 🇸🇬 Singapore | $10.97B |
| #10 | Paris | 🇫🇷 France | $9.76B |
Singapore and Macau represented East Asia, and New York was the sole city from the Americas on the list.
It’s worth noting that this list differs somewhat from overall tourism spending, which would include domestic travel spending as well. Large countries like the United States and China fare better in that ranking.
City Spotlight: Destinations Favored by Big Spenders
When you think of luxury travel, you think of five-star hotels, Michelin-star restaurants, luxury retail outlets, and many other premium experiences. And these cities offered their international travelers just that.
#1. Dubai
From the Burj Khalifa, currently the world’s tallest building, to the desert excursions and yacht cruises, Dubai offers extravagant experiences for international visitors. The city’s reputation for tax-free, high-end shopping and its commitment to providing a luxurious experience has made it a top travel destination for luxury shoppers from around the world.
Location is another factor in the city’s success. Dubai sits at the natural crossroads between Europe, Asia, Africa, and the Middle East, and is home to one of the world’s busiest, well-connected airports.
International travelers spent close to $30 billion in the city in 2022.
#3. London
London has long been a preferred location for the ultra-wealthy, and as a result, the city has an abundance of amenities for well-heeled travelers. For one, London is home to more five star hotels than any other city. As well, London offers ultra-wealthy travelers access to a wide range of high-end designer retailers, as well as world-famous museums, galleries, and landmarks.
Of course, the UK’s largest city also sees a high overall volume of tourists overall, which adds to the $16 billion global visitors spent in the city in 2022.
#4. Macau
Known as the Las Vegas of Asia, Macau’s gambling hub has been a magnet for international tourists for years. However, as the city began re-imagining its tourism strategies post-pandemic, it has grown stronger as an international tourist destination.
Outside tourists brought in $15.6 billion in 2022, and that number is only expected to multiply further over the next decade. This growth is being fueled by China and Hong Kong, which account for the lion’s share of visits.
Note: Although Macau is now a part of China, it remains a Special Administrative Region under the “One Country, Two Systems” principle.
Transforming Travel Trends
The global travel industry continues to recover from the pandemic, which is good news for the many nations that economically rely on tourism.
As travel restrictions were lifted, many tourists flocked to remote destinations that were less traveled. However, this WTTC research is proof that the world’s iconic cities are making their way back onto tourist itineraries once again.


Automotive
How People Get Around in America, Europe, and Asia
Examining how people get around using cars, public transit, and walking or biking, and the regional differences in usage.


How People Get Around in America, Europe, and Asia
This was originally posted on our Voronoi app. Download the app for free on iOS or Android and discover incredible data-driven charts from a variety of trusted sources.
This chart highlights the popularity of different transportation types in the Americas, Europe, and Asia, calculated by modal share.
Data for this article and visualization is sourced from ‘The ABC of Mobility’, a research paper by Rafael Prieto-Curiel (Complexity Science Hub) and Juan P. Ospina (EAFIT University), accessed through ScienceDirect.
The authors gathered their modal share data through travel surveys, which focused on the primary mode of transportation a person employs for each weekday trip. Information from 800 cities across 61 countries was collected for this study.
North American Car Culture Contrasts with the Rest of the World
In the U.S. and Canada, people heavily rely on cars to get around, no matter the size of the city. There are a few exceptions of course, such as New York, Toronto, and smaller college towns across the United States.
| Region | 🚗 Cars | 🚌 Public Transport | 🚶 Walking/Biking |
|---|---|---|---|
| North America* | 92% | 5% | 4% |
| Central America | 23% | 42% | 35% |
| South America | 29% | 40% | 31% |
| Northern Europe | 48% | 29% | 24% |
| Western Europe | 43% | 24% | 34% |
| Southern Europe | 50% | 24% | 25% |
| Eastern Europe | 35% | 40% | 25% |
| Southeastern Asia | 44% | 43% | 13% |
| Western Asia | 43% | 28% | 29% |
| Southern Asia | 22% | 39% | 39% |
| Eastern Asia | 19% | 46% | 35% |
| World | 51% | 26% | 22% |
Note: *Excluding Mexico. Percentages are rounded.
As a result, North America’s share of public transport and active mobility (walking and biking) is the lowest amongst all surveyed regions by a significant amount.
On the other hand, public transport reigns supreme in South and Central America as well as Southern and Eastern Asia. It ties with cars in Southeastern Asia, and is eclipsed by cars in Western Asia.
As outlined in the paper, Europe sees more city-level differences in transport popularity.
For example, Utrecht, Netherlands prefers walking and biking. People in Paris and London like using their extensive transit systems. And in Manchester and Rome, roughly two out of three journeys are by car.

-

 Markets5 days ago
Visualizing Global Inflation Forecasts (2024-2026)
-

 Green2 weeks ago
The Carbon Footprint of Major Travel Methods
-

 United States2 weeks ago
Visualizing the Most Common Pets in the U.S.
-

 Culture2 weeks ago
The World’s Top Media Franchises by All-Time Revenue
-

 voronoi1 week ago
Best Visualizations of April on the Voronoi App
-

 Wealth1 week ago
Charted: Which Country Has the Most Billionaires in 2024?
-

 Business1 week ago
The Top Private Equity Firms by Country
-

 Markets1 week ago
The Best U.S. Companies to Work for According to LinkedIn