Markets
Visualizing the Countries Most Reliant on Tourism
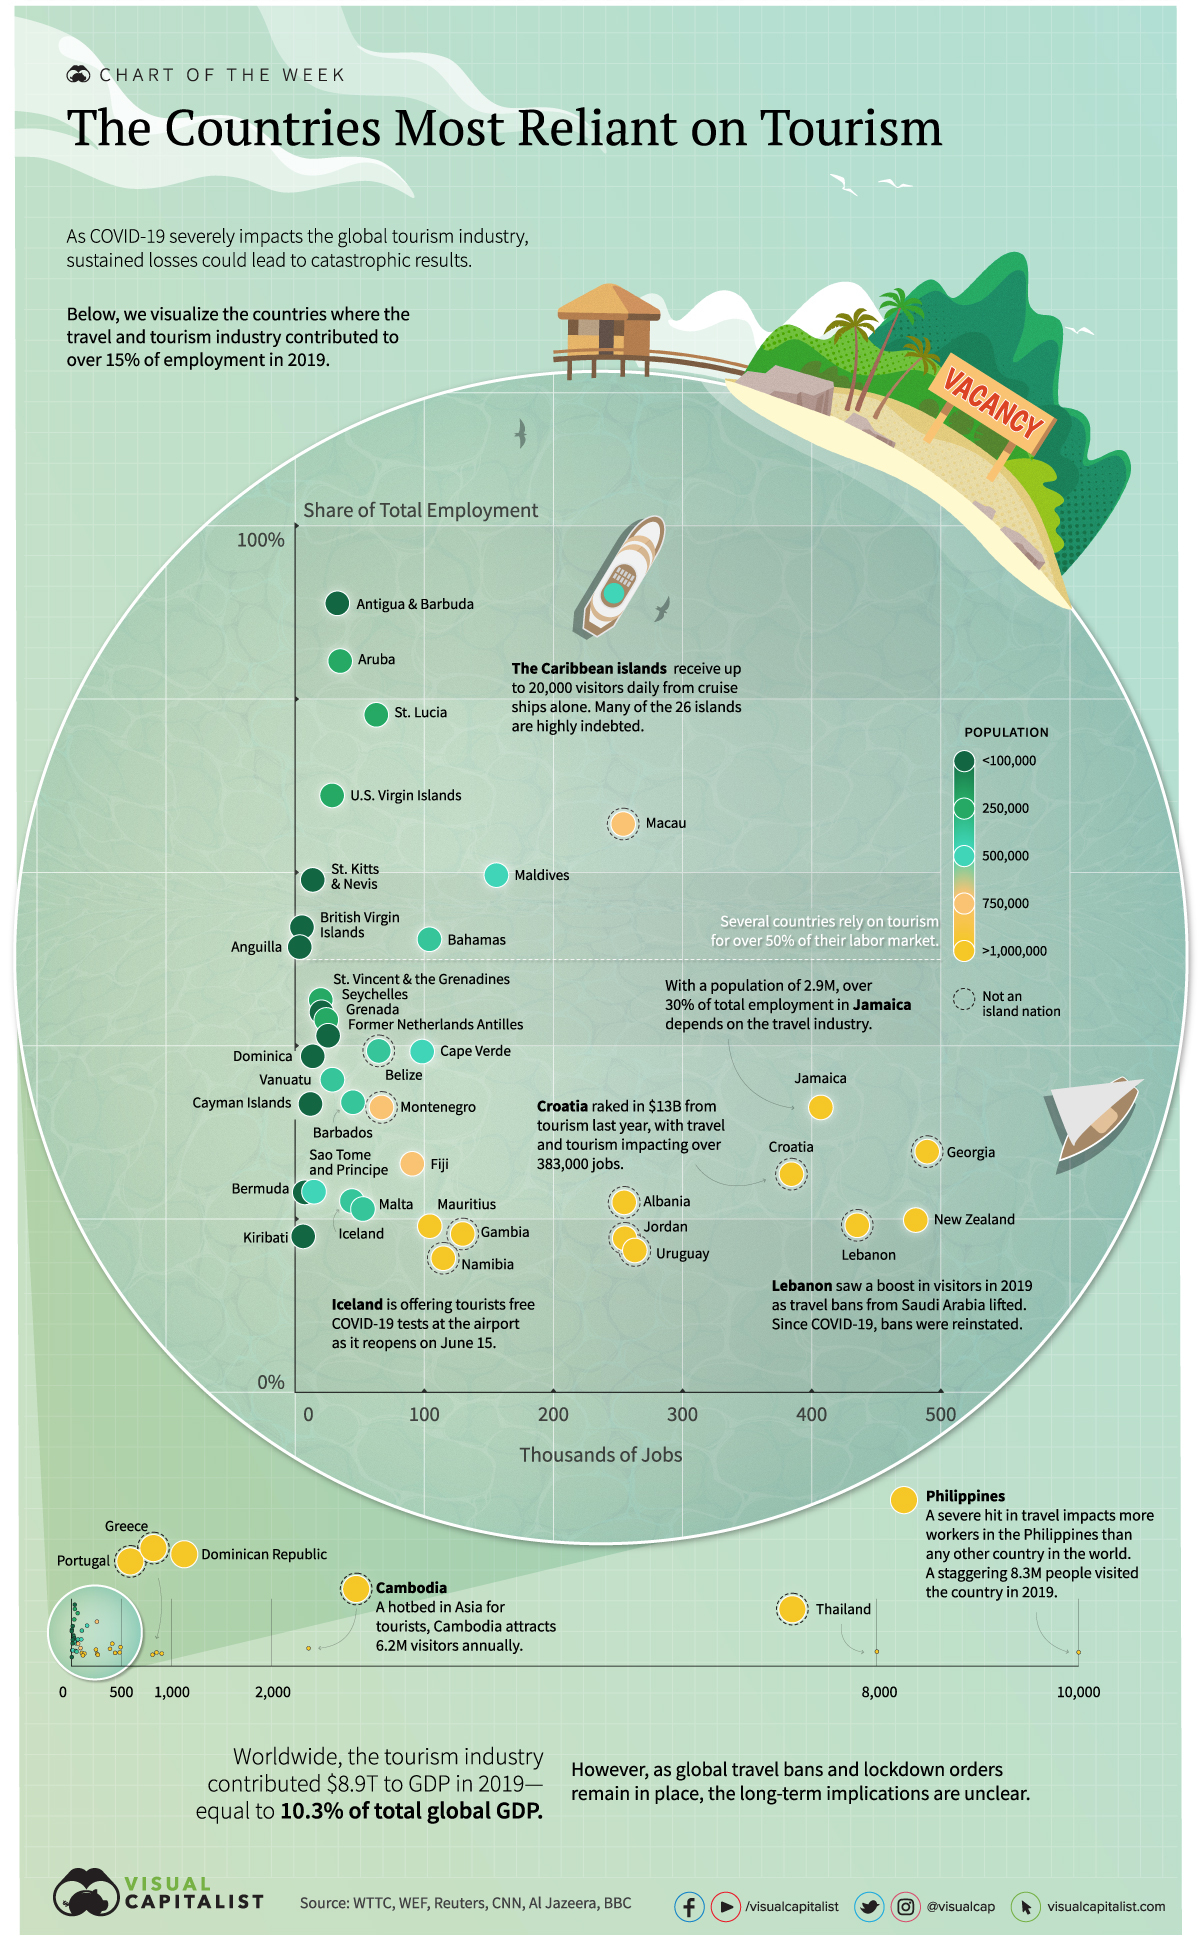


Visualizing the Countries Most Reliant on Tourism
Without a steady influx of tourism revenue, many countries could face severe economic damage.
As the global travel and tourism industry stalls, the spillover effects to global employment are wide-reaching. A total of 330 million jobs are supported by this industry around the world, and it contributes 10%, or $8.9 trillion to global GDP each year.
Today’s infographic uses data from the World Travel & Tourism Council, and it highlights the countries that depend the most on the travel and tourism industry according to employment—quantifying the scale that the industry contributes to the health of the global economy.
Ground Control
Worldwide, 44 countries rely on the travel and tourism industry for more than 15% of their total share of employment. Unsurprisingly, many of the countries suffering the most economic damage are island nations.
At the same time, data reveals the extent to which certain larger nations rely on tourism. In New Zealand, for example, 479,000 jobs are generated by the travel and tourism industry, while in Cambodia tourism contributes to 2.4 million jobs.
| Rank | Country | T&T Share of Jobs (2019) | T&T Jobs (2019) | Population |
|---|---|---|---|---|
| 1 | Antigua & Barbuda | 91% | 33,800 | 97,900 |
| 2 | Aruba | 84% | 35,000 | 106,800 |
| 3 | St. Lucia | 78% | 62,900 | 183,600 |
| 4 | US Virgin Islands | 69% | 28,800 | 104,400 |
| 5 | Macau | 66% | 253,700 | 649,300 |
| 6 | Maldives | 60% | 155,600 | 540,500 |
| 7 | St. Kitts & Nevis | 59% | 14,100 | 53,200 |
| 8 | British Virgin Islands | 54% | 5,500 | 30,200 |
| 9 | Bahamas | 52% | 103,900 | 393,200 |
| 10 | Anguilla | 51% | 3,800 | 15,000 |
| 11 | St. Vincent & the Grenadines | 45% | 19,900 | 110,900 |
| 12 | Seychelles | 44% | 20,600 | 98,300 |
| 13 | Grenada | 43% | 24,300 | 112,500 |
| 14 | Former Netherlands Antilles | 41% | 25,700 | 26,200 |
| 15 | Belize | 39% | 64,800 | 397,600 |
| 16 | Cape Verde | 39% | 98,300 | 556,000 |
| 17 | Dominica | 39% | 13,600 | 72,000 |
| 18 | Vanuatu | 36% | 29,000 | 307,100 |
| 19 | Barbados | 33% | 44,900 | 287,400 |
| 20 | Cayman Islands | 33% | 12,300 | 65,700 |
| 21 | Jamaica | 33% | 406,100 | 2,961,000 |
| 22 | Montenegro | 33% | 66,900 | 628,100 |
| 23 | Georgia | 28% | 488,200 | 3,989,000 |
| 24 | Cambodia | 26% | 2,371,100 | 16,719,000 |
| 25 | Fiji | 26% | 90,700 | 896,400 |
| 26 | Croatia | 25% | 383,400 | 4,105,000 |
| 27 | Philippines | 24% | 10,237,700 | 109,600,000 |
| 28 | Sao Tome and Principe | 23% | 14,500 | 219,200 |
| 29 | Bermuda | 23% | 7,800 | 62,300 |
| 30 | Albania | 22% | 254,300 | 2,880,000 |
| 31 | Iceland | 22% | 44,100 | 341,200 |
| 32 | Greece | 22% | 846,200 | 10,420,000 |
| 33 | Thailand | 21% | 8,054,600 | 69,800,000 |
| 34 | Malta | 21% | 52,800 | 441,500 |
| 35 | New Zealand | 20% | 479,400 | 4,822,000 |
| 36 | Lebanon | 19% | 434,200 | 6,825,000 |
| 37 | Mauritius | 19% | 104,200 | 1,272,000 |
| 38 | Portugal | 19% | 902,400 | 10,197,000 |
| 39 | Kiribati | 18% | 6,600 | 119,000 |
| 40 | Gambia | 18% | 129,600 | 2,417,000 |
| 41 | Jordan | 18% | 254,700 | 10,200,000 |
| 42 | Dominican Republic | 17% | 810,800 | 10,848,000 |
| 43 | Uruguay | 16% | 262,500 | 3,474,000 |
| 44 | Namibia | 15% | 114,600 | 2,541,000 |
Croatia, another tourist hotspot, is hoping to reopen in time for peak season—the country generated tourism revenues of $13B in 2019. With a population of over 4 million, travel and tourism contributes to 25% of its workforce.
How the 20 Largest Economies Stack Up
Tourist-centric countries remain the hardest hit from global travel bans, but the world’s biggest economies are also feeling the impact.
In Spain, tourism ranks as the third highest contributor to its economy. If lockdowns remain in place until September, it is projected to lose $68 billion (€62 billion) in revenues.
| Rank | Country | Travel and Tourism, Contribution to GDP |
|---|---|---|
| 1 | Mexico | 15.5% |
| 2 | Spain | 14.3% |
| 3 | Italy | 13.0% |
| 4 | Turkey | 11.3% |
| 5 | China | 11.3% |
| 6 | Australia | 10.8% |
| 7 | Saudi Arabia | 9.5% |
| 8 | Germany | 9.1% |
| 9 | United Kingdom | 9.0% |
| 10 | U.S. | 8.6% |
| 11 | France | 8.5% |
| 12 | Brazil | 7.7% |
| 13 | Switzerland | 7.6% |
| 14 | Japan | 7.0% |
| 15 | India | 6.8% |
| 16 | Canada | 6.3% |
| 17 | Netherlands | 5.7% |
| 18 | Indonesia | 5.7% |
| 19 | Russia | 5.0% |
| 20 | South Korea | 2.8% |
On the other hand, South Korea is impacted the least: just 2.8% of its GDP is reliant on tourism.
Travel, Interrupted
Which countries earn the most from the travel and tourism industry in absolute dollar terms?
Topping the list was the U.S., with tourism contributing over $1.8 trillion to its economy, or 8.6% of its GDP in 2019. The U.S. remains a global epicenter for COVID-19 cases, and details remain unconfirmed if the country will reopen to visitors before summer.
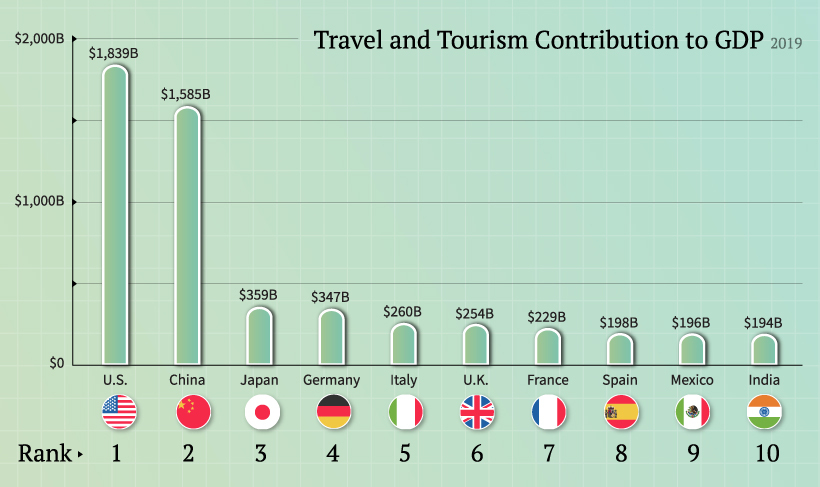
Meanwhile, the contribution of travel and tourism to China’s economy has more than doubled over the last decade, approaching $1.6 trillion. To help bolster economic activity, China and South Korea have eased restrictions by establishing a travel corridor.
As countries slowly reopen, other travel bubbles are beginning to make headway. For example, Estonia, Latvia, and Lithuania have eased travel restrictions by creating an established travel zone. Australia and New Zealand have a similar arrangement on the horizon. These travel bubbles allow citizens from each country to travel within a given zone.
Of course, COVID-19 will have a lasting impact on employment and global economic activity with inconceivable outcomes. When the dust finally settles, could global tourism face a reckoning?


Markets
The European Stock Market: Attractive Valuations Offer Opportunities
On average, the European stock market has valuations that are nearly 50% lower than U.S. valuations. But how can you access the market?


European Stock Market: Attractive Valuations Offer Opportunities
Europe is known for some established brands, from L’Oréal to Louis Vuitton. However, the European stock market offers additional opportunities that may be lesser known.
The above infographic, sponsored by STOXX, outlines why investors may want to consider European stocks.
Attractive Valuations
Compared to most North American and Asian markets, European stocks offer lower or comparable valuations.
| Index | Price-to-Earnings Ratio | Price-to-Book Ratio |
|---|---|---|
| EURO STOXX 50 | 14.9 | 2.2 |
| STOXX Europe 600 | 14.4 | 2 |
| U.S. | 25.9 | 4.7 |
| Canada | 16.1 | 1.8 |
| Japan | 15.4 | 1.6 |
| Asia Pacific ex. China | 17.1 | 1.8 |
Data as of February 29, 2024. See graphic for full index names. Ratios based on trailing 12 month financials. The price to earnings ratio excludes companies with negative earnings.
On average, European valuations are nearly 50% lower than U.S. valuations, potentially offering an affordable entry point for investors.
Research also shows that lower price ratios have historically led to higher long-term returns.
Market Movements Not Closely Connected
Over the last decade, the European stock market had low-to-moderate correlation with North American and Asian equities.
The below chart shows correlations from February 2014 to February 2024. A value closer to zero indicates low correlation, while a value of one would indicate that two regions are moving in perfect unison.
| EURO STOXX 50 | STOXX EUROPE 600 | U.S. | Canada | Japan | Asia Pacific ex. China |
|
|---|---|---|---|---|---|---|
| EURO STOXX 50 | 1.00 | 0.97 | 0.55 | 0.67 | 0.24 | 0.43 |
| STOXX EUROPE 600 | 1.00 | 0.56 | 0.71 | 0.28 | 0.48 | |
| U.S. | 1.00 | 0.73 | 0.12 | 0.25 | ||
| Canada | 1.00 | 0.22 | 0.40 | |||
| Japan | 1.00 | 0.88 | ||||
| Asia Pacific ex. China | 1.00 |
Data is based on daily USD returns.
European equities had relatively independent market movements from North American and Asian markets. One contributing factor could be the differing sector weights in each market. For instance, technology makes up a quarter of the U.S. market, but health care and industrials dominate the broader European market.
Ultimately, European equities can enhance portfolio diversification and have the potential to mitigate risk for investors.
Tracking the Market
For investors interested in European equities, STOXX offers a variety of flagship indices:
| Index | Description | Market Cap |
|---|---|---|
| STOXX Europe 600 | Pan-regional, broad market | €10.5T |
| STOXX Developed Europe | Pan-regional, broad-market | €9.9T |
| STOXX Europe 600 ESG-X | Pan-regional, broad market, sustainability focus | €9.7T |
| STOXX Europe 50 | Pan-regional, blue-chip | €5.1T |
| EURO STOXX 50 | Eurozone, blue-chip | €3.5T |
Data is as of February 29, 2024. Market cap is free float, which represents the shares that are readily available for public trading on stock exchanges.
The EURO STOXX 50 tracks the Eurozone’s biggest and most traded companies. It also underlies one of the world’s largest ranges of ETFs and mutual funds. As of November 2023, there were €27.3 billion in ETFs and €23.5B in mutual fund assets under management tracking the index.
“For the past 25 years, the EURO STOXX 50 has served as an accurate, reliable and tradable representation of the Eurozone equity market.”
— Axel Lomholt, General Manager at STOXX
Partnering with STOXX to Track the European Stock Market
Are you interested in European equities? STOXX can be a valuable partner:
- Comprehensive, liquid and investable ecosystem
- European heritage, global reach
- Highly sophisticated customization capabilities
- Open architecture approach to using data
- Close partnerships with clients
- Part of ISS STOXX and Deutsche Börse Group
With a full suite of indices, STOXX can help you benchmark against the European stock market.
Learn how STOXX’s European indices offer liquid and effective market access.

-

 Economy2 days ago
Economic Growth Forecasts for G7 and BRICS Countries in 2024
The IMF has released its economic growth forecasts for 2024. How do the G7 and BRICS countries compare?
-

 Markets1 week ago
U.S. Debt Interest Payments Reach $1 Trillion
U.S. debt interest payments have surged past the $1 trillion dollar mark, amid high interest rates and an ever-expanding debt burden.
-

 United States2 weeks ago
Ranked: The Largest U.S. Corporations by Number of Employees
We visualized the top U.S. companies by employees, revealing the massive scale of retailers like Walmart, Target, and Home Depot.
-

 Markets2 weeks ago
The Top 10 States by Real GDP Growth in 2023
This graphic shows the states with the highest real GDP growth rate in 2023, largely propelled by the oil and gas boom.
-

 Markets2 weeks ago
Ranked: The World’s Top Flight Routes, by Revenue
In this graphic, we show the highest earning flight routes globally as air travel continued to rebound in 2023.
-

 Markets3 weeks ago
Ranked: The Most Valuable Housing Markets in America
The U.S. residential real estate market is worth a staggering $47.5 trillion. Here are the most valuable housing markets in the country.


-

 Education1 week ago
How Hard Is It to Get Into an Ivy League School?
-

 Technology2 weeks ago
Ranked: Semiconductor Companies by Industry Revenue Share
-
Markets2 weeks ago
Ranked: The World’s Top Flight Routes, by Revenue
-

 Demographics2 weeks ago
Population Projections: The World’s 6 Largest Countries in 2075
-
Markets2 weeks ago
The Top 10 States by Real GDP Growth in 2023
-

 Demographics2 weeks ago
The Smallest Gender Wage Gaps in OECD Countries
-

 Economy2 weeks ago
Where U.S. Inflation Hit the Hardest in March 2024
-

 Green2 weeks ago
Top Countries By Forest Growth Since 2001