Travel
Charted: Global Tourism Rebounds to Pre-Pandemic Levels
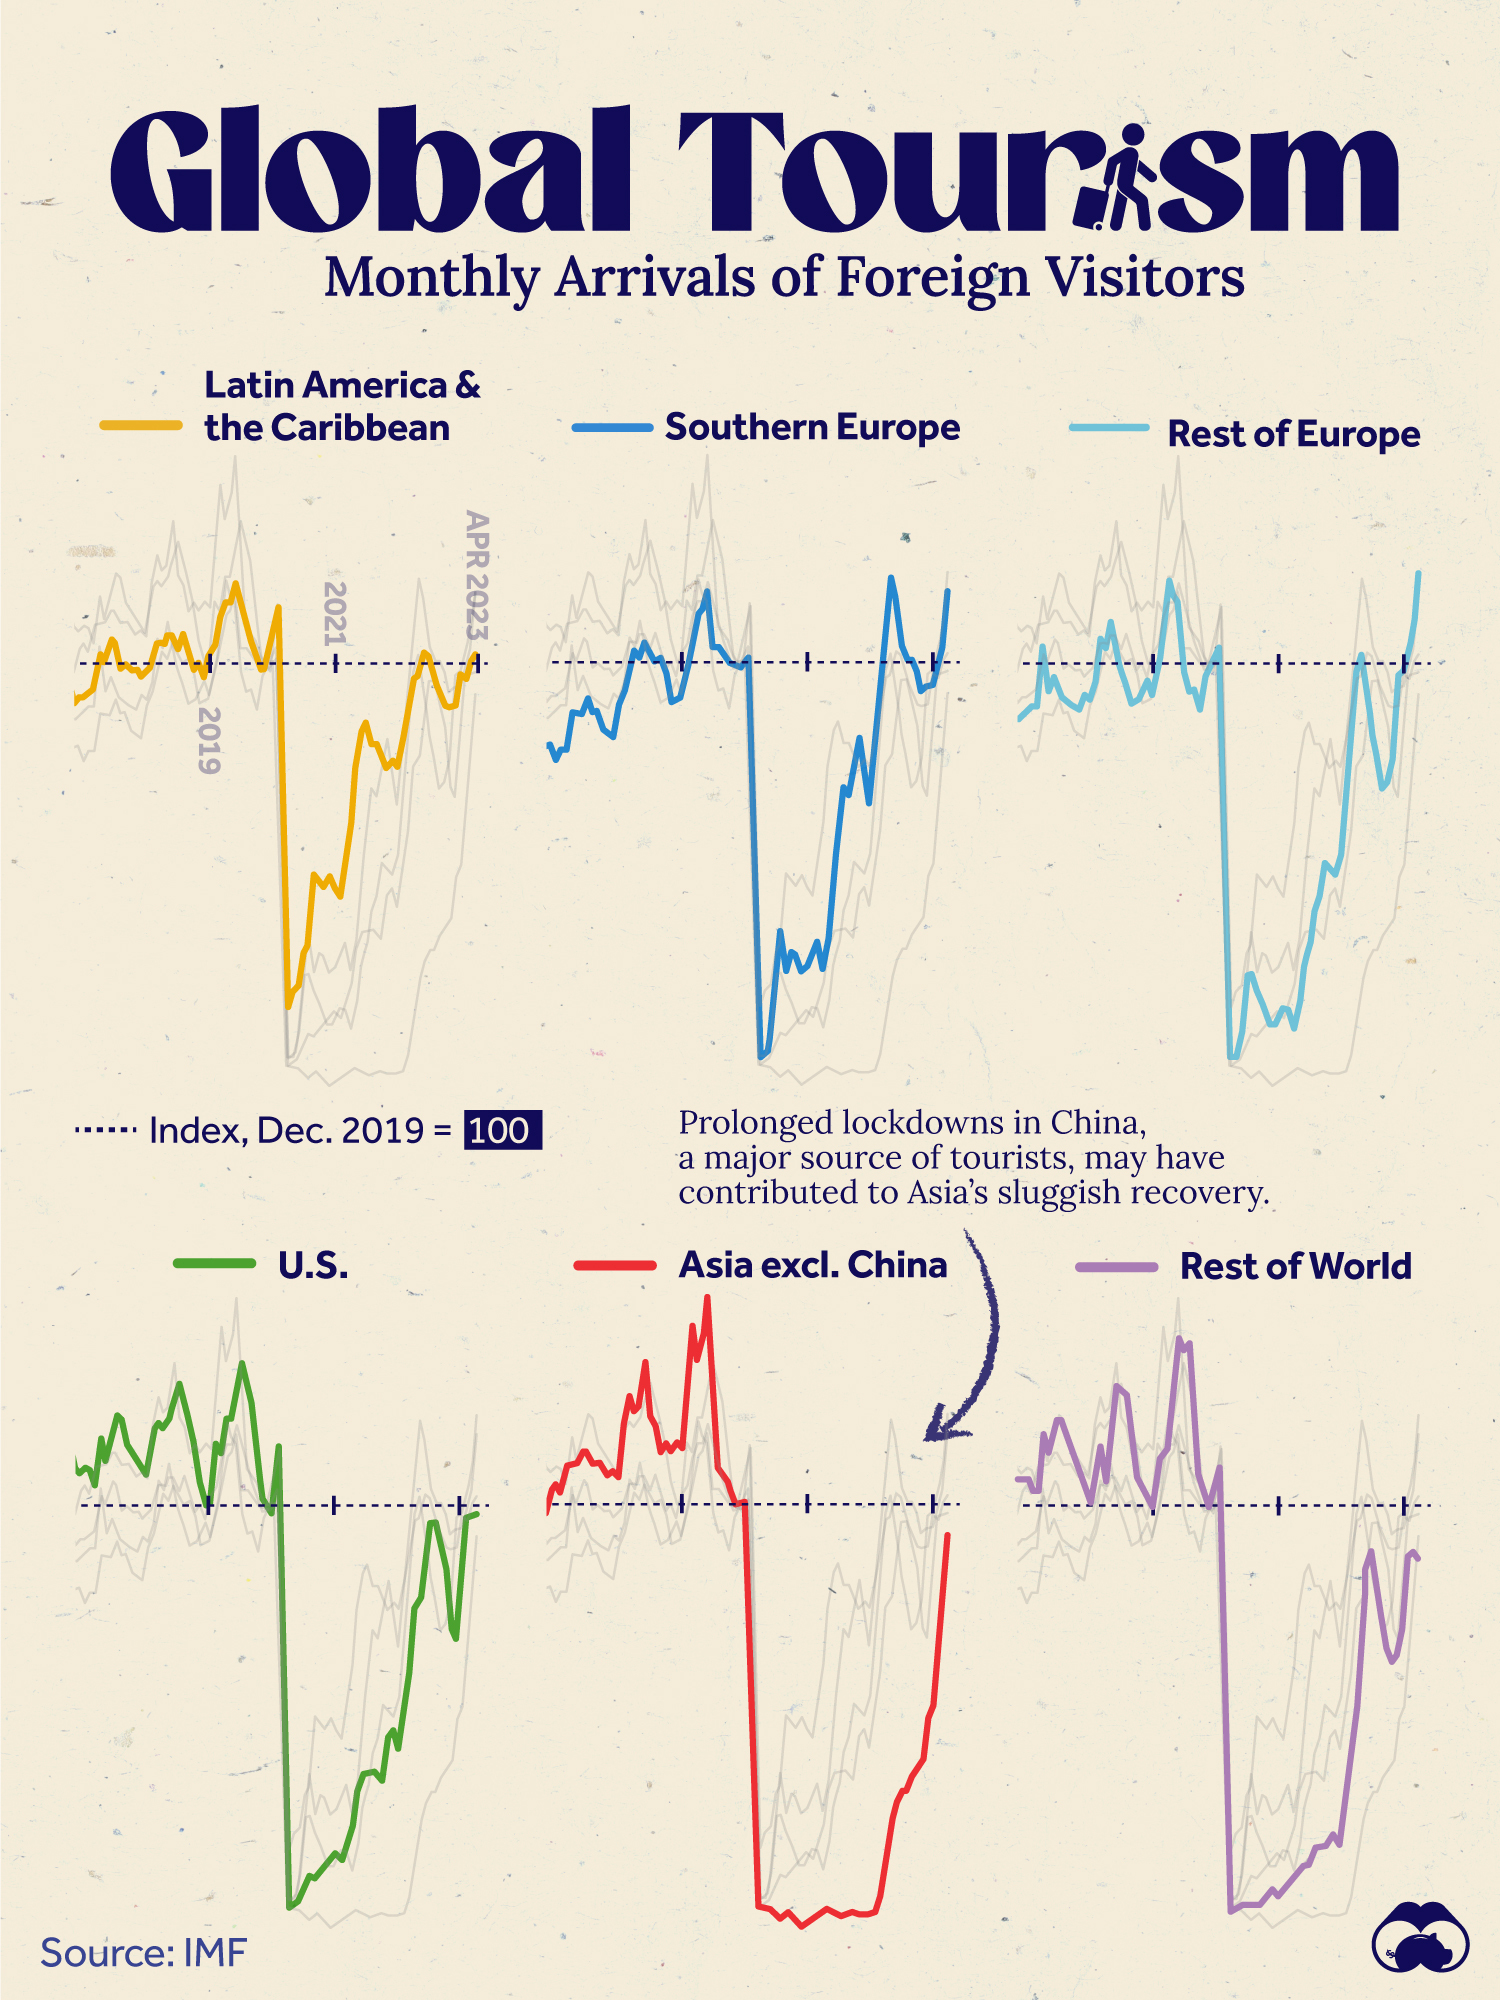
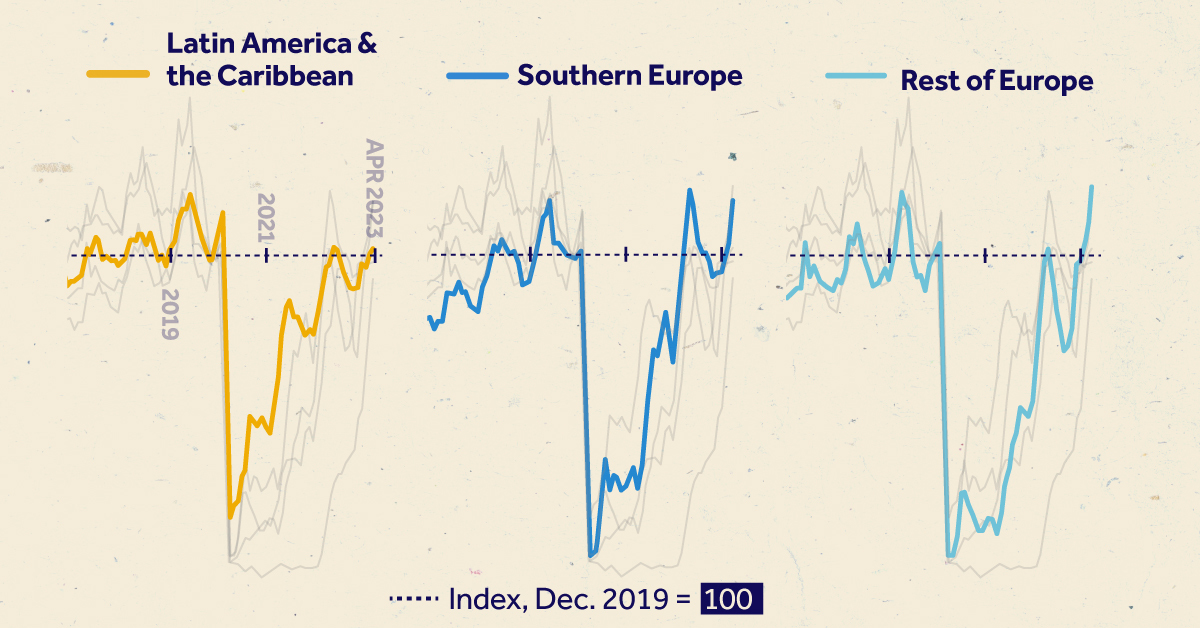
Charted: Global Tourism Rebounds to 2019 Levels
Love them or hate them, tourists are back.
Global tourism has rebounded to pre-pandemic levels according to data sourced from the International Monetary Fund’s World Economic Report (2023)
We visualize monthly arrivals of foreign visitors to various regions, indexed to December 2019 levels.
Europe Leads as Destination for Resurging Tourism
Having been the first industry to suffer almost immediately from COVID-19 required lockdowns and border closures, global tourism has been on a steady recovery in the last year and a half.
In fact, Europe was the first region to get back to pre-pandemic levels in April–May 2022, with the U.S. nearly approaching the mark in July that same year.
In the tables below we showcase the relative scale of monthly arrivals of foreign visitors to various regions, indexed to Dec 2019 levels. Figures below 100 mean there were fewer foreign arrivals than December 2019, and vice-versa.
| Year/Month | Southern Europe | Rest of Europe | U.S. |
|---|---|---|---|
| Dec 2015 | 72.4 | 82.2 | 111.1 |
| Dec 2016 | 80.5 | 87.0 | 107.9 |
| Dec 2017 | 82.7 | 92.6 | 108.8 |
| Dec 2018 | 91.8 | 96.0 | 100.6 |
| Dec 2019 | 100.0 | 100.0 | 100.0 |
| Dec 2020 | 26.4 | 13.7 | 15.9 |
| Dec 2021 | 73.6 | 50.1 | 46.9 |
| Dec 2022 | 95.2 | 97.1 | 68.1 |
| April 2023 | 117.2 | 121.8 | 97.8 |
Latin America also hit pre-pandemic levels of tourists in June 2022 and then again in April 2023.
One major exception to the recovery is Asia (excluding China), which was at 90.8% of 2019 levels as of April 2023. As it happens, the lack of Chinese tourists—due to China’s prolonged period of COVID-19 lockdowns—are likely a major factor for Asia’s slower tourism recovery.
| Year/Month | Latin America & the Caribbean | Asia (ex-China) | Rest of World |
|---|---|---|---|
| Dec 2015 | 82.9 | 98.1 | 101.7 |
| Dec 2016 | 92.1 | 103.3 | 105.5 |
| Dec 2017 | 97.4 | 108.1 | 104.5 |
| Dec 2018 | 97.1 | 115.0 | 102.7 |
| Dec 2019 | 100.0 | 100.0 | 100.0 |
| Dec 2020 | 49.3 | -0.4 | 8.1 |
| Dec 2021 | 76.9 | 2.2 | 21.0 |
| Dec 2022 | 90.3 | 49.2 | 64.4 |
| April 2023 | 102.5 | 90.8 | 86.6 |
Rising Chinese income levels has made the country the world’s largest source of tourists. For example, in 2019 (pre-COVID), China ranked first in terms of outbound tourism spending, at $255 billion.
Airlines Passenger Share Mirrors Tourism Trends
Consequently, the airline industry of these regions has also seen correlating gains and losses in traffic. European airlines had the highest share of passenger traffic, followed by the U.S. in 2022. At the same time all four of China’s largest airlines saw a fall in traffic.
Meanwhile the outlook on the Chinese economy (second largest in the world) remains uncertain at best, which is casting a pall on global growth prospects for the next year.


Markets
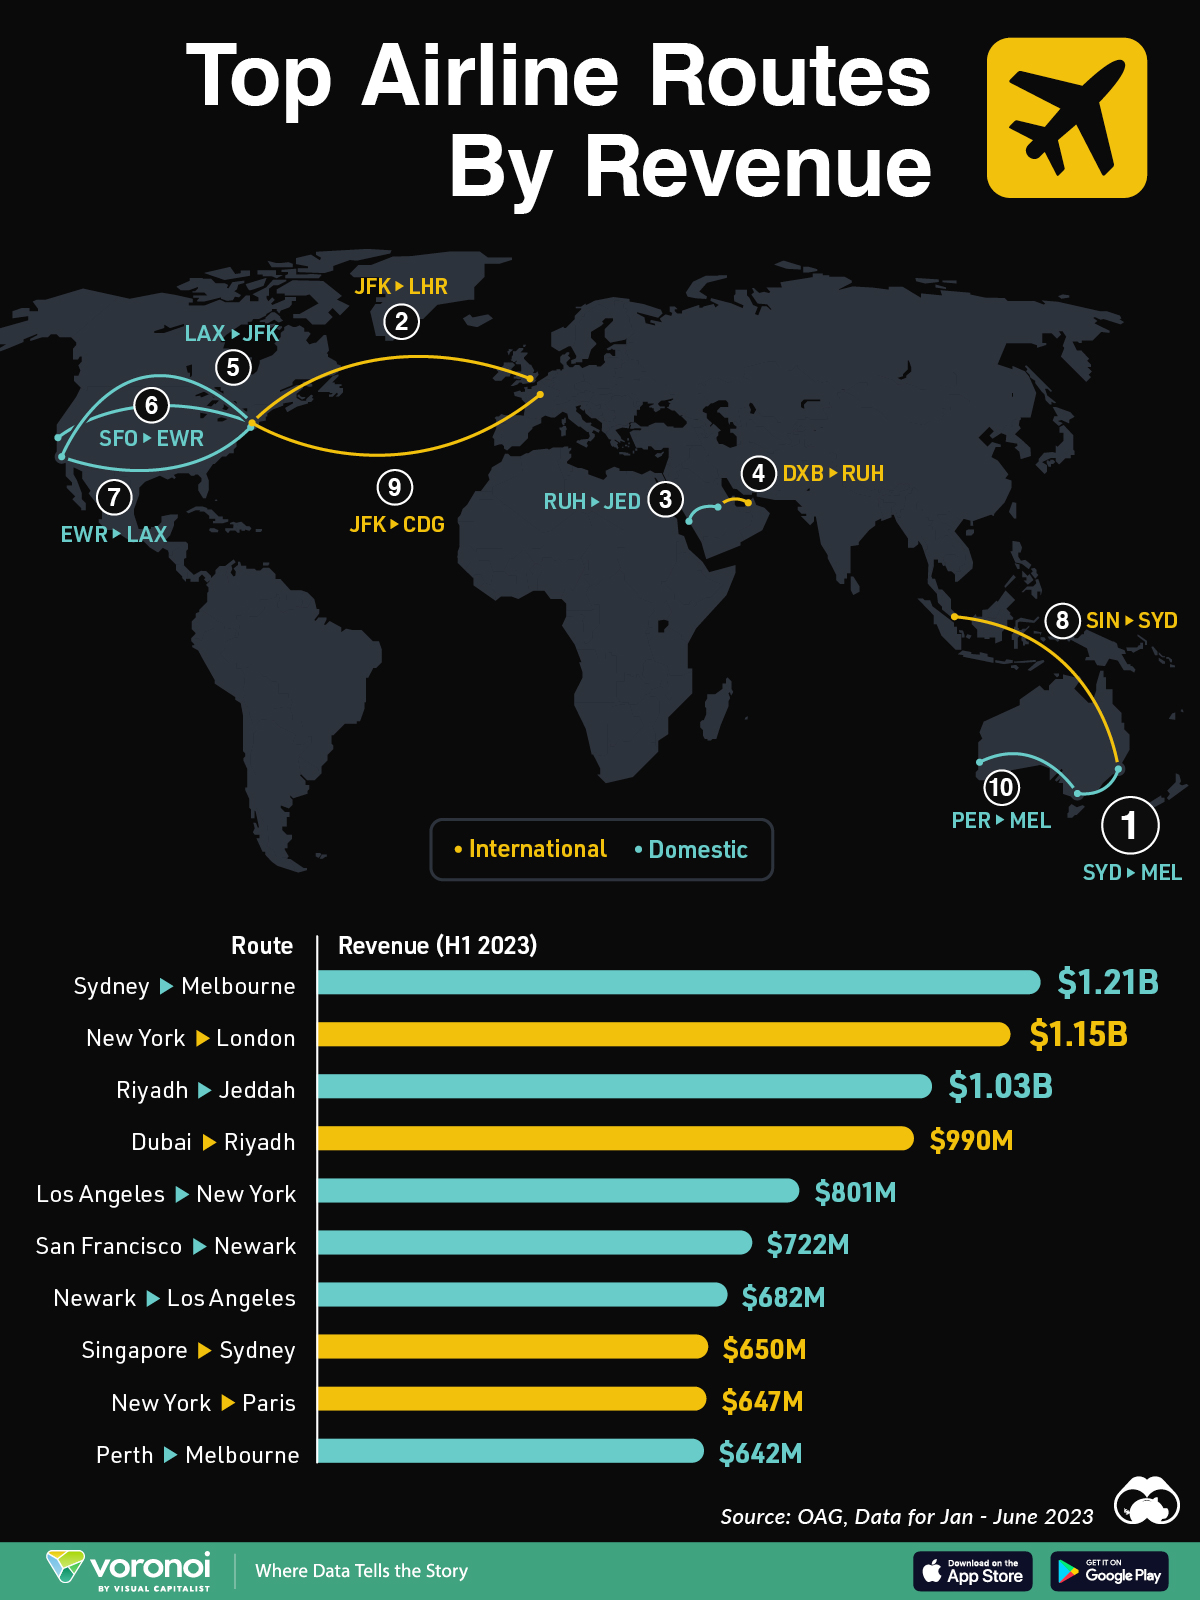
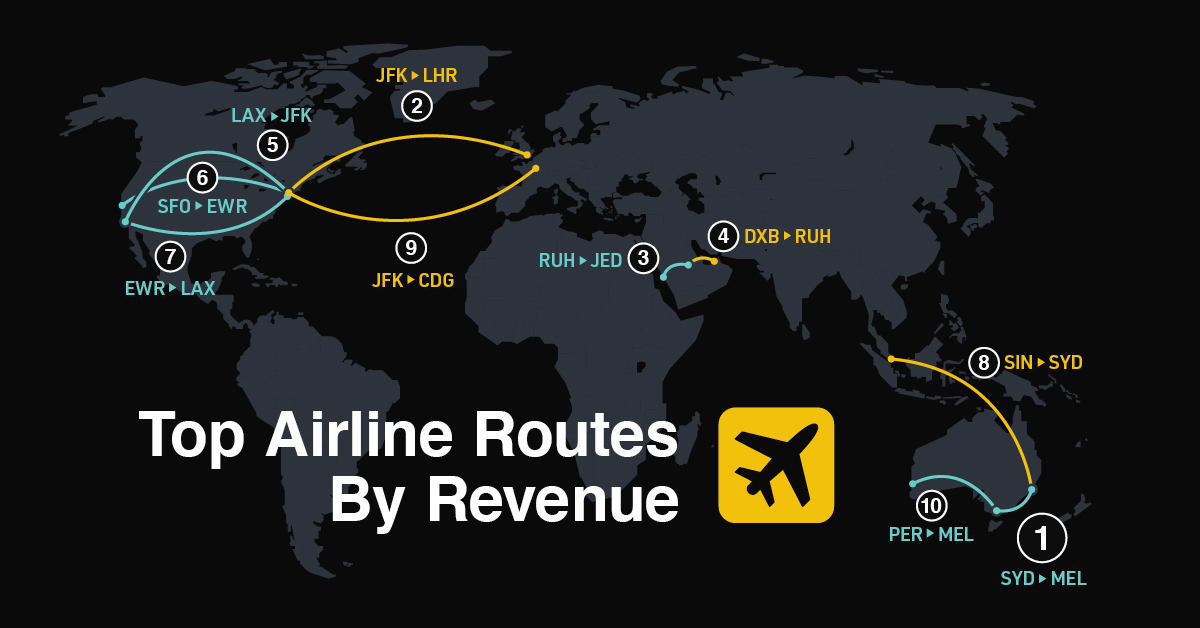
Ranked: The World’s Top Flight Routes, by Revenue
In this graphic, we show the highest earning flight routes globally as air travel continued to rebound in 2023.
The World’s Top Flight Routes, by Revenue
This was originally posted on our Voronoi app. Download the app for free on iOS or Android and discover incredible data-driven charts from a variety of trusted sources.
In 2024, a record 4.7 billion people are projected to travel by air—200 million more than in 2019.
While revenues surged to an estimated $896 billion globally last year, airlines face extremely slim margins. On average, they made just $5.44 in net profit per passenger in 2023. Today, the industry faces pressures from high interest rates, supply chain woes, and steep infrastructure costs.
This graphic shows the highest earning flight routes worldwide, based on data from OAG.
The Top Revenue-Generating Routes in 2023
Below, we show the airline routes with the highest revenues in the first half of 2023:
| Route | Airport Codes | Revenue H1 2023 |
|---|---|---|
| Sydney to Melbourne | SYD-MEL | $1.21B |
| New York to London | JFK-LHR | $1.15B |
| Riyadh to Jeddah | RUH-JED | $1.03B |
| Dubai to Riyadh | DXB-RUH | $990M |
| Los Angeles to New York | LAX-JFK | $801M |
| San Francisco to Newark | SFO-EWR | $722M |
| Newark to Los Angeles | EWR-LAX | $682M |
| Singapore to Sydney | SIN-SYD | $650M |
| New York to Paris | JFK-CDG | $647M |
| Perth to Melbourne | PER-MEL | $642M |
As we can see, domestic flights comprised six of the 10 largest revenue-generating flights, with Sydney to Melbourne ranking first overall, at $1.21 billion.
In fact, this route is earning more than twice that of pre-pandemic levels, even as the number of passengers declined. The flight route is largely dominated by Qantas and Virgin Australia, with Qantas achieving record-breaking domestic earnings margins of 18% in the fiscal year ending in June 2023. Lower fuel costs and soaring ticket prices were key factors in driving revenues.
Furthermore, Qantas and Virgin Australia are major carriers for flights between Melbourne and Perth, another top-earning route.
New York to London, one of the busiest and most profitable routes globally, generated $1.15 billion in revenues, representing a 37% increase compared to the same period in 2019. Overall, the flight route had 3.88 million scheduled airline seats for the full year of 2023.
The highest revenue increase over this period was for flights from Dubai to Riyadh, with revenues surging 416% year-over-year. This two-hour flight, a highly lucrative route between major financial centers, is one of the busiest in the Middle East.

-

 Science1 week ago
Visualizing the Average Lifespans of Mammals
-

 Markets2 weeks ago
The Top 10 States by Real GDP Growth in 2023
-

 Demographics2 weeks ago
The Smallest Gender Wage Gaps in OECD Countries
-

 United States2 weeks ago
Where U.S. Inflation Hit the Hardest in March 2024
-

 Green2 weeks ago
Top Countries By Forest Growth Since 2001
-

 United States2 weeks ago
Ranked: The Largest U.S. Corporations by Number of Employees
-

 Maps2 weeks ago
The Largest Earthquakes in the New York Area (1970-2024)
-

 Green2 weeks ago
Ranked: The Countries With the Most Air Pollution in 2023