Misc
Ranked: Which Cars Have the Best Resale Value?
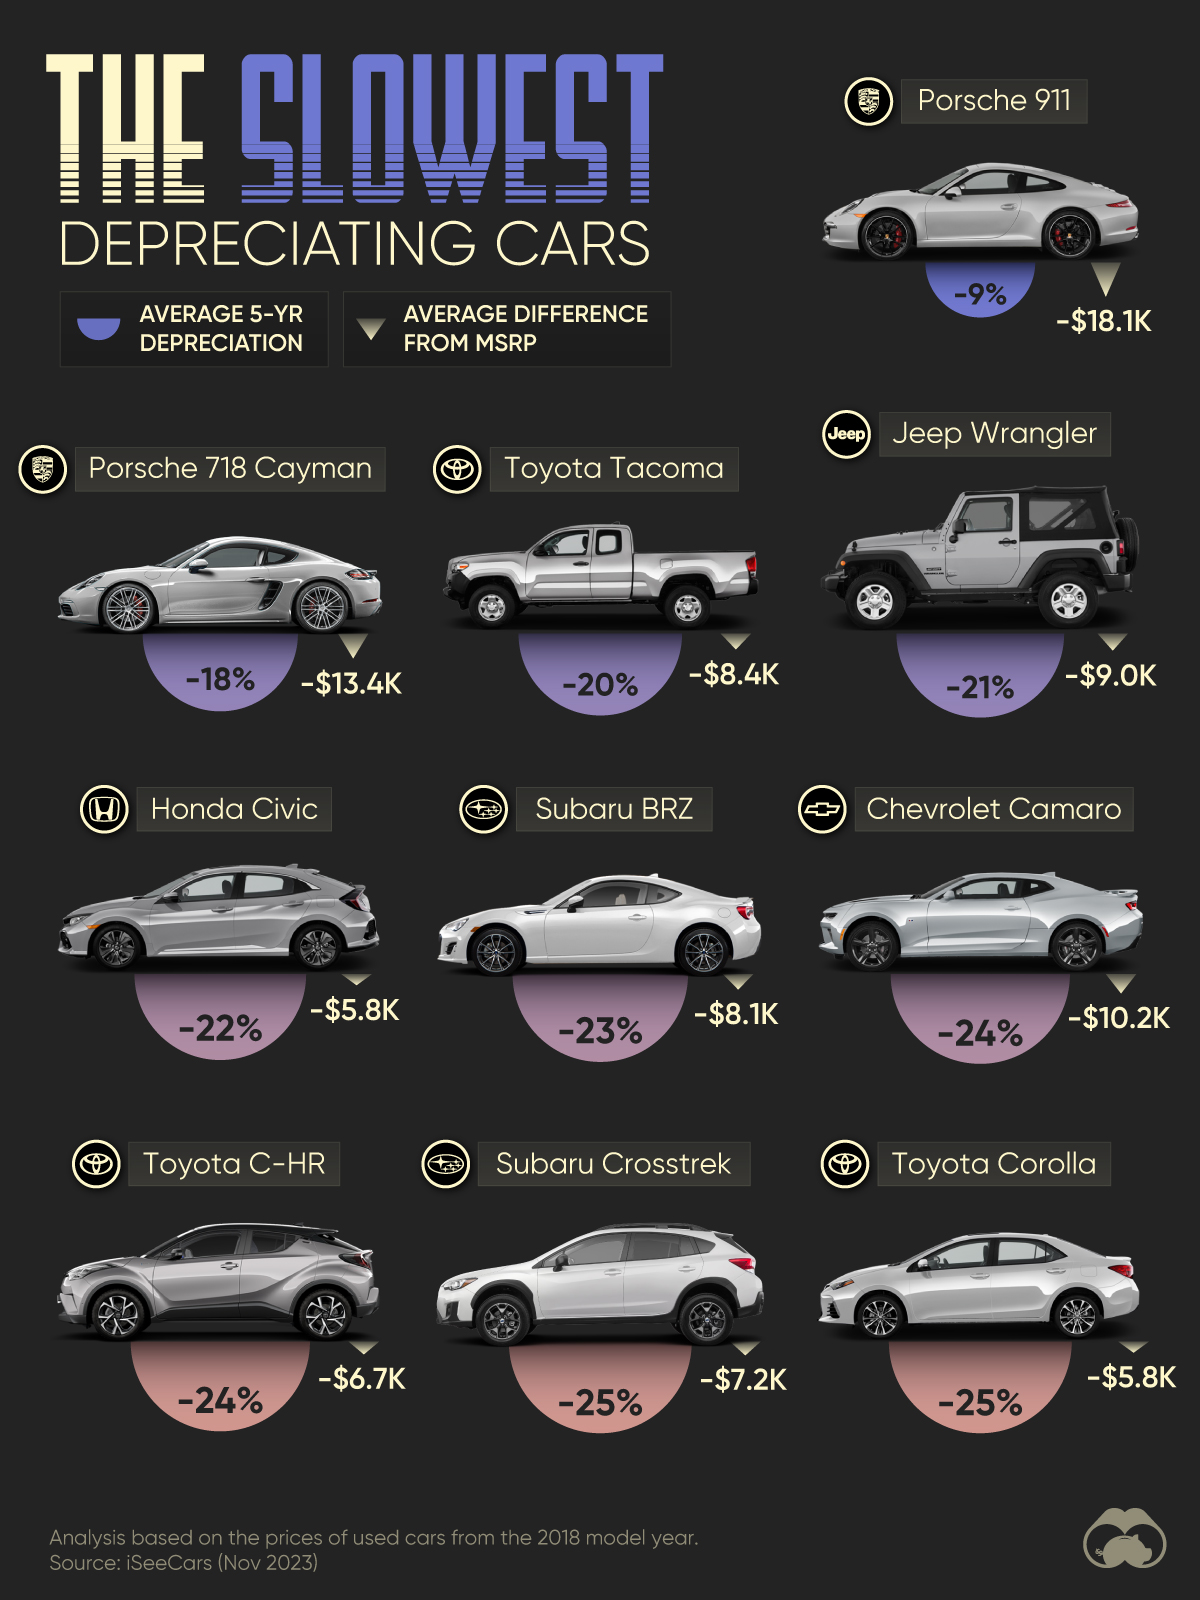
Ranked: Which Cars Have the Best Resale Value?
For three years now, the used-car market has been booming, after the pandemic disrupted new car supply chains, sending secondhand vehicle prices skyrocketing.
But which cars have the best resale value?
We visualize the top 10 vehicles with the lowest depreciation rates over five years, based on data from iSeeCars.
They analyzed over 1.1 million used cars from model year 2018, sold between November 2022 to October 2023. Models no longer in production as of the 2022 model year were excluded.
Porsche is Still (Almost) Perfect After Five Years
Heading the list, Porsche has two models with the best resale value after half a decade.
After five years, the 911 (Coupe) only loses 9% of its retail value in the used-car market on average. Porsche’s flagship costs anywhere between $90,000–$294,000 based on the horsepower (ranging from 200–700), along with other model specifications.
At second place, the Porsche 718 Cayman loses about one-fifth of its value. Two other Porsches—the Boxster, and the 911 convertible—also feature in ranks, at 12th and 15th respectively, both losing around 25% of their retail price tag.
Here’s a look at the full list of slowest depreciating cars in the United States:
| Rank | Model | Average 5-Yr Depreciation | Average Difference from MSRP |
|---|---|---|---|
| 1 | Porsche 911 (Coupe) | 9% | $18,094 |
| 2 | Porsche 718 Cayman | 18% | $13,372 |
| 3 | Toyota Tacoma | 20% | $8,359 |
| 4 | Jeep Wrangler | 21% | $8,951 |
| 5 | Honda Civic | 22% | $5,817 |
| 6 | Subaru BRZ | 23% | $8,114 |
| 7 | Chevrolet Camaro | 24% | $10,161 |
| 8 | Toyota C-HR | 24% | $6,692 |
| 9 | Subaru Crosstrek | 25% | $7,214 |
| 10 | Toyota Corolla | 25% | $5,800 |
| 11 | Ford Mustang | 25% | $10,035 |
| 12 | Porsche 718 Boxster | 25% | $20,216 |
| 13 | Toyota Tundra | 25% | $12,588 |
| 14 | Kia Rio 5-Door | 26% | $5,006 |
| 15 | Porsche 911 (Convertible) | 26% | $42,227 |
| 16 | Honda HR-V | 26% | $7,318 |
| 17 | Subaru Impreza (Wagon) | 26% | $6,927 |
| 18 | Kia Rio | 26% | $4,959 |
| 19 | Chevrolet Spark | 27% | $4,784 |
| 20 | Toyota RAV4 | 27% | $8,858 |
| 21 | Hyundai Accent | 27% | $5,353 |
| 22 | Toyota 4Runner | 27% | $13,147 |
| 23 | Chevrolet Corvette | 28% | $22,712 |
| 24 | Nissan Kicks | 28% | $6,560 |
| 25 | Subaru Impreza (Sedan) | 28% | $7,158 |
Note: MSRP stands for Manufacturer Suggested Retail Price, the price recommended by a product’s producer to retailers. Furthermore, MSRPs from 2018 were inflation-adjusted to 2023 dollars.
The Toyota Tacoma, America’s fifth best-selling truck, comes in third, losing 20%.
The Jeep Wrangler (-21%) and the Honda Civic (-22%) round out the top five cars with the best resale value.
Two more sports cars (the Subaru BRZ and Chevrolet Camaro) feature in the top 10, indicating that these “fun” designer cars are valued for their status as well as functionality.
Aside from the sports category, Americans seem to rate Japanese automakers highly. Put together, Toyota, Subaru, Honda, and Nissan account for half of the cars with the best resale value.


Misc
Visualizing the Most Common Pets in the U.S.
Lions, tigers, and bears, oh my!—these animals do not feature on this list of popular American household pets.


Visualizing The Most Common Pets in the U.S.
This was originally posted on our Voronoi app. Download the app for free on iOS or Android and discover incredible data-driven charts from a variety of trusted sources.
In this graphic, we visualized the most common American household pets, based on 2023-2024 data from the American Pet Products Association (accessed via Forbes Advisor).
Figures represent the number of households that own each pet type, rather than the actual number of each animal. The “small animal” category includes hamsters, gerbils, rabbits, guinea pigs, chinchillas, mice, rats, and ferrets.
What is the Most Popular American Household Pet?
Based on this data, dogs—one of the first domesticated animals—are the most common pets in the United States. In fact, around 65 million households own a dog, and spend an average of $900 a year on their care.
| Rank | Species | Households |
|---|---|---|
| 1 | 🐶 Dog | 65M |
| 2 | 🐱 Cat | 47M |
| 3 | 🐟 Freshwater Fish | 11M |
| 4 | 🐰 Small Animals | 7M |
| 5 | 🐦 Bird | 6M |
| 6 | 🦎 Reptile | 6M |
| 7 | 🐴 Horse | 2M |
| 8 | 🐠 Saltwater Fish | 2M |
Note: Households can own multiple pets, and are counted for all relevant categories.
Cats rank second, at 47 million households, and these smaller felines are a little less expensive to own at $700/year according to Forbes estimates.
But aside from these two juggernauts, there are plenty of other common pet types found in households across the country.
Freshwater fish can be found in 11 million households, along with small animals—rabbits, hamsters, guinea pigs—in 7 million. Meanwhile, nearly 6 million homes have birds or reptiles.
Pet Ownership is on the Rise in America
Forbes found that 66% of all American households (numbering 87 million) own at least one pet, up from 56% in 1988. One third of these (29 million) own multiple pets.
A combination of factors is driving this increase: rising incomes, delayed childbirth, and of course the impact of the pandemic which nearly cleared out animal shelters across the globe.
America’s loneliness epidemic may also be a factor. Fledgling research has shown that single-individual households with pets recorded lower rates of loneliness during the pandemic than those without a pet.

-

 Science1 week ago
Visualizing the Average Lifespans of Mammals
-

 Markets2 weeks ago
The Top 10 States by Real GDP Growth in 2023
-

 Demographics2 weeks ago
The Smallest Gender Wage Gaps in OECD Countries
-

 United States2 weeks ago
Where U.S. Inflation Hit the Hardest in March 2024
-

 Green2 weeks ago
Top Countries By Forest Growth Since 2001
-

 United States2 weeks ago
Ranked: The Largest U.S. Corporations by Number of Employees
-

 Maps2 weeks ago
The Largest Earthquakes in the New York Area (1970-2024)
-

 Green2 weeks ago
Ranked: The Countries With the Most Air Pollution in 2023