Misc
Ranked: Which Cars Depreciate the Fastest?
Ranked: Which Cars Depreciate the Fastest?
It’s a fact of life that vehicles depreciate—some say by almost 50% as soon they’re driven out of the lot. But which cars depreciate the fastest?
We visualize the top 10 vehicles with the highest depreciation rates over five years, based on data from iSeeCars.
They analyzed over 1.1 million used cars from model year 2018, sold between November 2022 to October 2023. Models no longer in production as of the 2022 model year were excluded.
Luxury Cars Struggle to Hold Their Value
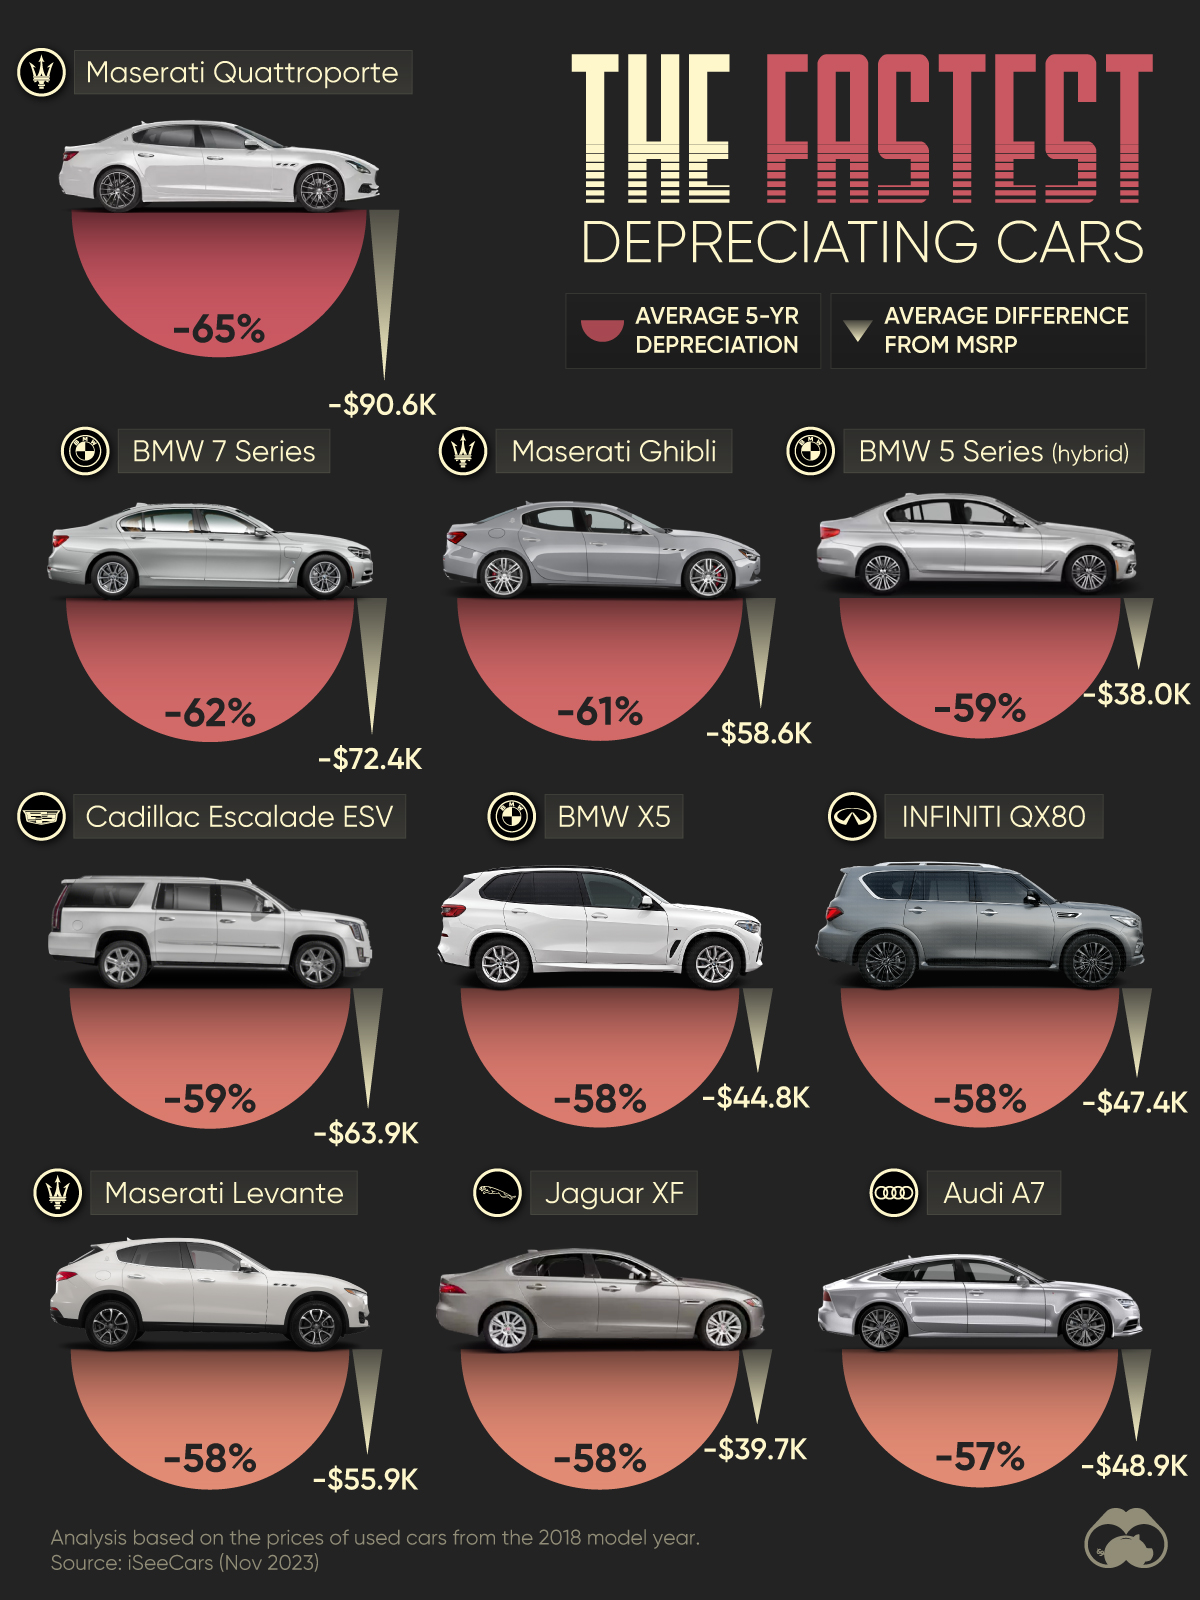
At the top of the list, the Maserati Quattroporte loses nearly two-thirds of its value after five years. First introduced in 1963, the car is Maserati’s flagship, and is on its sixth iteration as a four-door luxury sedan, with a high performance Ferrari–made V6 or V8 engine.
The 2018 version of the car retailed anywhere between $109,000–$140,000, depending on the model.
Here’s a look at the full list of fastest depreciating cars in the U.S.
| Rank | Model | Average 5-Yr Depreciation | Average Difference from MSRP |
|---|---|---|---|
| 1 | Maserati Quattroporte | 65% | $90,588 |
| 2 | BMW 7 Series | 62% | $72,444 |
| 3 | Maserati Ghibli | 61% | $58,623 |
| 4 | BMW 5 Series (Hybrid) | 59% | $37,975 |
| 5 | Cadillac Escalade ESV | 59% | $63,885 |
| 6 | BMW X5 | 58% | $44,828 |
| 7 | INFINITI QX80 | 58% | $47,399 |
| 8 | Maserati Levante | 58% | $55,858 |
| 9 | Jaguar XF | 58% | $39,720 |
| 10 | Audi A7 | 57% | $48,917 |
| 11 | Audi Q7 | 57% | $41,731 |
| 12 | Cadillac Escalade | 57% | $59,093 |
| 13 | Audi A6 | 56% | $38,252 |
| 14 | Volvo S90 | 56% | $35,365 |
| 15 | Nissan Armada | 56% | $36,875 |
| 16 | Mercedes-Benz S-Class | 56% | $70,563 |
| 17 | Lincoln Navigator L | 56% | $57,224 |
| 18 | Mercedes-Benz GLS | 56% | $54,523 |
| 19 | Tesla Model S | 56% | $60,145 |
| 20 | BMW 5 Series | 55% | $39,856 |
| 21 | BMW X5 | 55% | $39,992 |
| 22 | Lincoln Navigator | 55% | $53,582 |
| 23 | BMW X5 M | 54% | $66,277 |
| 24 | Land Rover Range Rover | 54% | $68,874 |
| 25 | Cadillac XT5 | 54% | $31,737 |
| N/A | Overall | 39% | $17,221 |
Note: MSRP stands for Manufacturer Suggested Retail Price, the price recommended by a product’s producer to retailers. Furthermore, MSRPs from 2018 were inflation-adjusted to 2023 dollars.
BMW’s 7-series and 5-series also lose value quickly (nearly 60% of their retail price), ranking second and fourth respectively.
Another Maserati car, the Ghibli comes in third (-61%), and the Cadillac Escalade ESV (-59%) rounds out the top five fastest depreciating vehicles.
From a quick glance through the ranks, the cars that depreciate the fastest are luxury vehicles, specifically luxury sedans. These types of cars are often leased, and supply increases dramatically once the lease period expires. Meanwhile, most owners who can afford a luxury car would prefer to buy a new model, while used-car owners would prefer not to pay a high premium on an already outdated model.
However, there’s another segment of the market that also drops in value quickly—electric vehicles. Analysis found that EVs lose roughly 49% of their value on the resale market, the worst amongst the categories specified.
| Rank | Segment | Average 5-Yr Depreciation (%) |
|---|---|---|
| 1 | EVs | 49% |
| 2 | SUVs | 41% |
| 3 | Hybrids | 37% |
| 4 | Trucks | 35% |
| N/A | Overall | 39% |
A lack of larger demand appetite, as well as a plethora of government incentives pushing people to buying new electric vehicles could explain their faster than average depreciation rate. Trucks on the other hand are the slowest depreciating segment of all vehicles in the U.S.


VC+
VC+: Get Our Key Takeaways From the IMF’s World Economic Outlook
A sneak preview of the exclusive VC+ Special Dispatch—your shortcut to understanding IMF’s World Economic Outlook report.

Have you read IMF’s latest World Economic Outlook yet? At a daunting 202 pages, we don’t blame you if it’s still on your to-do list.
But don’t worry, you don’t need to read the whole April release, because we’ve already done the hard work for you.
To save you time and effort, the Visual Capitalist team has compiled a visual analysis of everything you need to know from the report—and our VC+ Special Dispatch is available exclusively to VC+ members. All you need to do is log into the VC+ Archive.
If you’re not already subscribed to VC+, make sure you sign up now to access the full analysis of the IMF report, and more (we release similar deep dives every week).
For now, here’s what VC+ members get to see.
Your Shortcut to Understanding IMF’s World Economic Outlook
With long and short-term growth prospects declining for many countries around the world, this Special Dispatch offers a visual analysis of the key figures and takeaways from the IMF’s report including:
- The global decline in economic growth forecasts
- Real GDP growth and inflation forecasts for major nations in 2024
- When interest rate cuts will happen and interest rate forecasts
- How debt-to-GDP ratios have changed since 2000
- And much more!

Get the Full Breakdown in the Next VC+ Special Dispatch
VC+ members can access the full Special Dispatch by logging into the VC+ Archive, where you can also check out previous releases.
Make sure you join VC+ now to see exclusive charts and the full analysis of key takeaways from IMF’s World Economic Outlook.
Don’t miss out. Become a VC+ member today.
What You Get When You Become a VC+ Member
VC+ is Visual Capitalist’s premium subscription. As a member, you’ll get the following:
- Special Dispatches: Deep dive visual briefings on crucial reports and global trends
- Markets This Month: A snappy summary of the state of the markets and what to look out for
- The Trendline: Weekly curation of the best visualizations from across the globe
- Global Forecast Series: Our flagship annual report that covers everything you need to know related to the economy, markets, geopolitics, and the latest tech trends
- VC+ Archive: Hundreds of previously released VC+ briefings and reports that you’ve been missing out on, all in one dedicated hub
You can get all of the above, and more, by joining VC+ today.

-

 Debt1 week ago
How Debt-to-GDP Ratios Have Changed Since 2000
-

 Countries2 weeks ago
Population Projections: The World’s 6 Largest Countries in 2075
-

 Markets2 weeks ago
The Top 10 States by Real GDP Growth in 2023
-

 Demographics2 weeks ago
The Smallest Gender Wage Gaps in OECD Countries
-

 United States2 weeks ago
Where U.S. Inflation Hit the Hardest in March 2024
-

 Green2 weeks ago
Top Countries By Forest Growth Since 2001
-

 United States2 weeks ago
Ranked: The Largest U.S. Corporations by Number of Employees
-

 Maps2 weeks ago
The Largest Earthquakes in the New York Area (1970-2024)