Automotive
Visualizing Global Electric Vehicle Sales in 2023, by Market Share
![]() See this visualization first on the Voronoi app.
See this visualization first on the Voronoi app.
Visualizing the Global Electric Vehicle Market in 2023
This was originally posted on our Voronoi app. Download the app for free on iOS or Android and discover incredible data-driven charts from a variety of trusted sources.
Analysts anticipate that China’s largest electric automaker BYD will surpass Tesla in battery electric vehicle (BEV) sales for 2024.
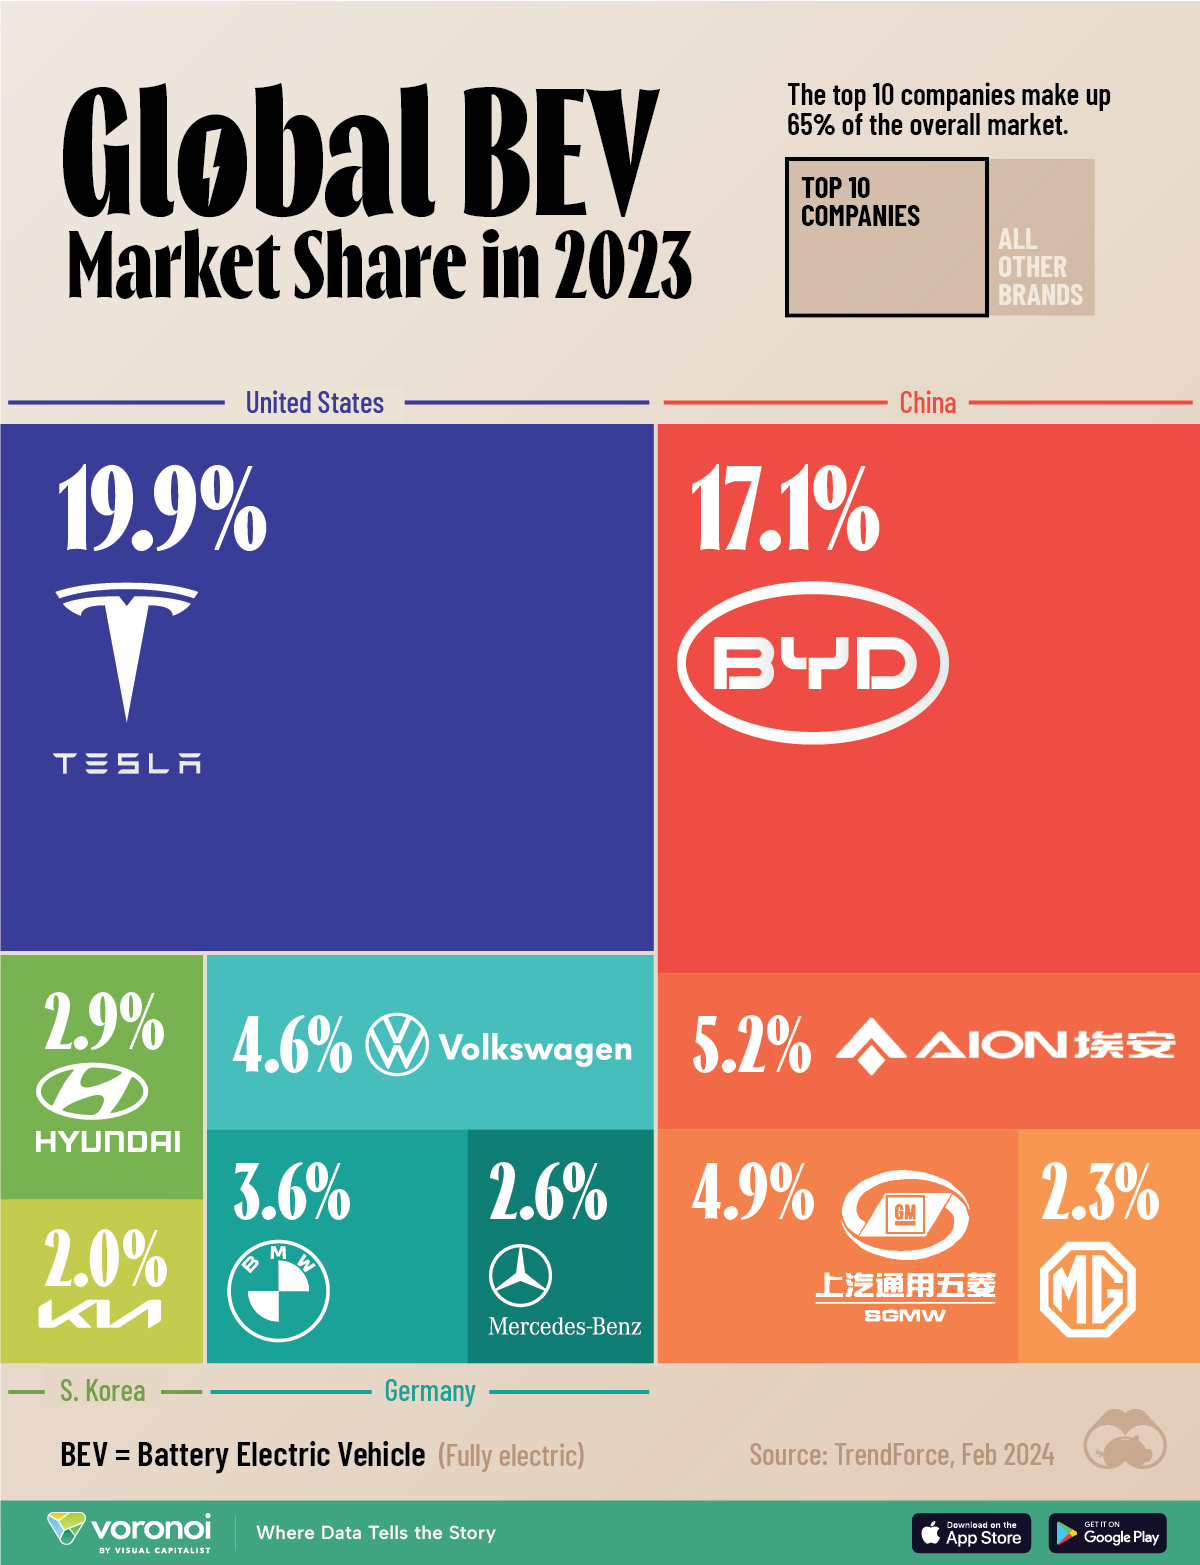
In this graphic, we illustrate the global BEV market share for the full year 2023, based on figures compiled by TrendForce.
BYD Likely to Surpass Tesla in 2024
Currently, the top 10 BEV companies make up 65% of the overall market.
Given that BYD already outsold Tesla in the fourth quarter of 2023 (526,000 compared to 485,000), the Chinese company is expected to surpass Elon Musk’s automaker before the end of the year.
Currently, Tesla holds a 19.9% share of the market, closely followed by BYD with 17.1%.
| Rank | Brand | Country | Market Share in 2023 |
|---|---|---|---|
| 1 | Tesla | 🇺🇸 US | 19.9% |
| 2 | BYD | 🇨🇳 China | 17.1% |
| 3 | GAC Aion | 🇨🇳 China | 5.2% |
| 4 | SAIC-GM-Wuling | 🇨🇳 China | 4.9% |
| 5 | Volkswagen | 🇩🇪 Germany | 4.6% |
| 6 | BMW | 🇩🇪 Germany | 3.6% |
| 7 | Hyundai | 🇰🇷 S. Korea | 2.9% |
| 8 | Mercedes-Benz | 🇩🇪 Germany | 2.6% |
| 9 | MG | 🇨🇳 China | 2.3% |
| 10 | KIA | 🇰🇷 S. Korea | 2.0% |
In 2022, the Chinese automaker overtook Tesla as the top producer of EVs, when non-BEVs are included in sales totals. It produced 1.8 million vehicles compared to Tesla’s 1.3 million.
BYD has relied on stable domestic sales performance but is also expanding its international presence. The company began selling in Europe a little over a year ago and also plans to build factories in European countries to avoid EU tariffs on Chinese car imports.
Another Chinese automaker, GAC Aion, secured the third spot on our list, with SAIC-GM-Wuling and Volkswagen falling to fourth and fifth, respectively.
Luxury brands BMW and Mercedes-Benz accelerated their electrification efforts, ranking sixth and eighth, while Hyundai Group’s Hyundai and KIA maintained their positions compared to the previous year.
In total, global sales of EVs, including BEVs, PHEVs (Plug-in Hybrid Electric Vehicles), and FCVs (Fuel Cell Vehicles), reached 13 million units in 2023, with a growth rate of 29.8% compared to 2022.
The number, however, represents a significant slowdown from the 54.2% growth rate in 2022.


Lithium
Ranked: The Top 10 EV Battery Manufacturers in 2023
Asia dominates this ranking of the world’s largest EV battery manufacturers in 2023.


The Top 10 EV Battery Manufacturers in 2023
This was originally posted on our Voronoi app. Download the app for free on iOS or Android and discover incredible data-driven charts from a variety of trusted sources.
Despite efforts from the U.S. and EU to secure local domestic supply, all major EV battery manufacturers remain based in Asia.
In this graphic we rank the top 10 EV battery manufacturers by total battery deployment (measured in megawatt-hours) in 2023. The data is from EV Volumes.
Chinese Dominance
Contemporary Amperex Technology Co. Limited (CATL) has swiftly risen in less than a decade to claim the title of the largest global battery group.
The Chinese company now has a 34% share of the market and supplies batteries to a range of made-in-China vehicles, including the Tesla Model Y, SAIC’s MG4/Mulan, and various Li Auto models.
| Company | Country | 2023 Production (megawatt-hour) | Share of Total Production |
|---|---|---|---|
| CATL | 🇨🇳 China | 242,700 | 34% |
| BYD | 🇨🇳 China | 115,917 | 16% |
| LG Energy Solution | 🇰🇷 Korea | 108,487 | 15% |
| Panasonic | 🇯🇵 Japan | 56,560 | 8% |
| SK On | 🇰🇷 Korea | 40,711 | 6% |
| Samsung SDI | 🇰🇷 Korea | 35,703 | 5% |
| CALB | 🇨🇳 China | 23,493 | 3% |
| Farasis Energy | 🇨🇳 China | 16,527 | 2% |
| Envision AESC | 🇨🇳 China | 8,342 | 1% |
| Sunwoda | 🇨🇳 China | 6,979 | 1% |
| Other | - | 56,040 | 8% |
In 2023, BYD surpassed LG Energy Solution to claim second place. This was driven by demand from its own models and growth in third-party deals, including providing batteries for the made-in-Germany Tesla Model Y, Toyota bZ3, Changan UNI-V, Venucia V-Online, as well as several Haval and FAW models.
The top three battery makers (CATL, BYD, LG) collectively account for two-thirds (66%) of total battery deployment.
Once a leader in the EV battery business, Panasonic now holds the fourth position with an 8% market share, down from 9% last year. With its main client, Tesla, now sourcing batteries from multiple suppliers, the Japanese battery maker seems to be losing its competitive edge in the industry.
Overall, the global EV battery market size is projected to grow from $49 billion in 2022 to $98 billion by 2029, according to Fortune Business Insights.

-

 Education1 week ago
How Hard Is It to Get Into an Ivy League School?
-

 Technology2 weeks ago
Ranked: Semiconductor Companies by Industry Revenue Share
-

 Markets2 weeks ago
Ranked: The World’s Top Flight Routes, by Revenue
-

 Demographics2 weeks ago
Population Projections: The World’s 6 Largest Countries in 2075
-

 Markets2 weeks ago
The Top 10 States by Real GDP Growth in 2023
-

 Demographics2 weeks ago
The Smallest Gender Wage Gaps in OECD Countries
-

 Economy2 weeks ago
Where U.S. Inflation Hit the Hardest in March 2024
-

 Environment2 weeks ago
Top Countries By Forest Growth Since 2001