Markets
Ranked: Which Airlines Carried the Most Passengers in 2022?
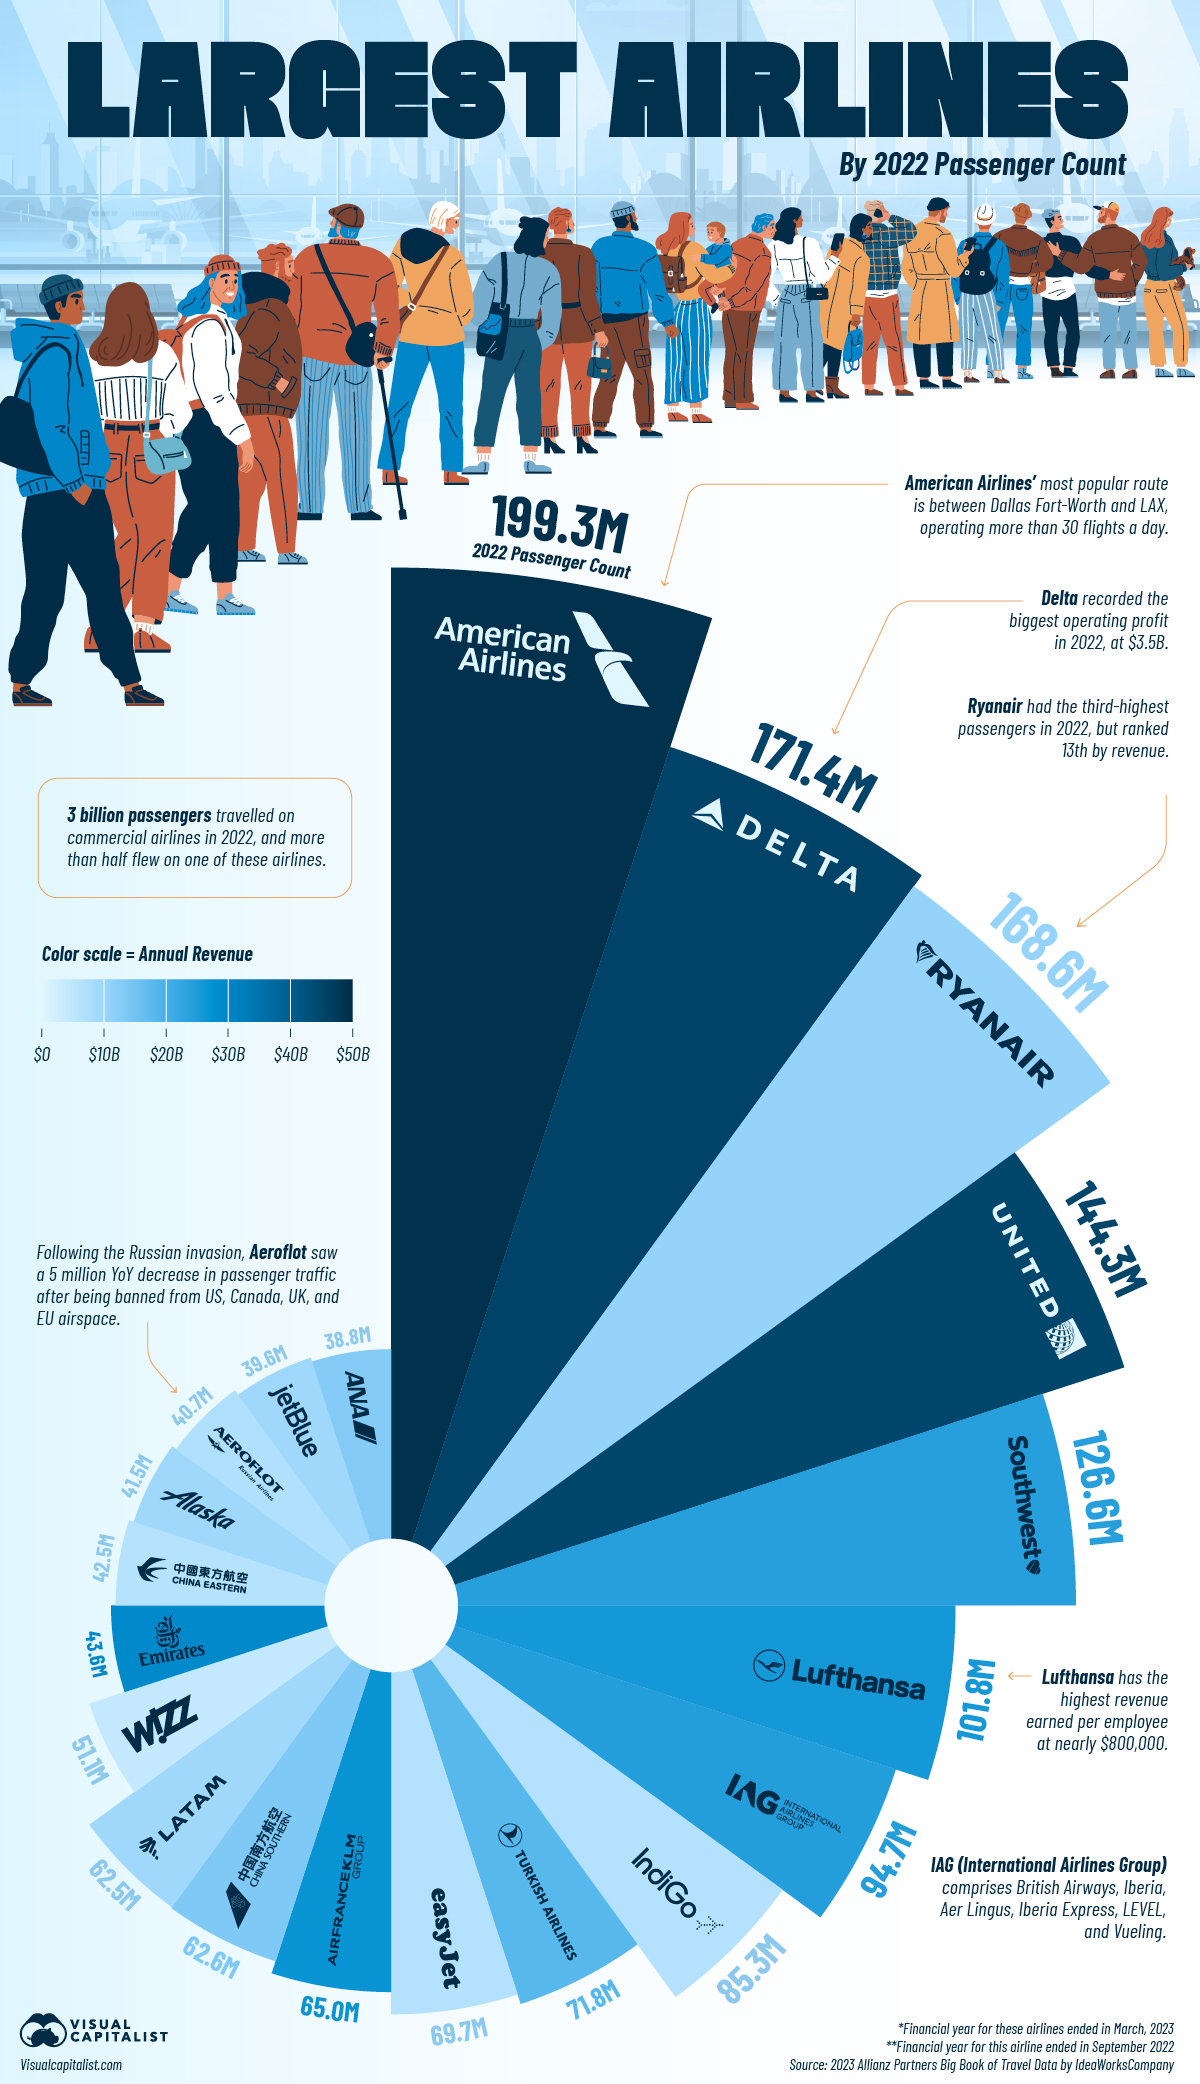
Ranked: Which Airlines Carried the Most Passengers in 2022?
After being battered by the pandemic, the airline industry is on the upswing, with traffic growing 30% and revenue surging 50% year-on-year in 2022.
And of the 3 billion passengers who took a flight last year, more than half flew on one of the big players in the industry. We use information from 2023 Allianz Partners Big Book of Travel Data by IdeaWorksCompany to visualize the largest airlines by traffic.
The Top 20 Airlines By Traffic in 2022
At the top of the list, American Airlines flew nearly 200 million passengers in 2022. The airline’s most popular route was between Dallas Fort-Worth (DFW) and Los Angeles (LAX), operating more than 30 flights a day.
In fact, Dallas is a “fortress hub” for American, where the airline—along with its regional partners—own more than 70% of the airport’s flights.
Here’s a quick look at the other airlines and their annual passengers in 2022.
| Rank | Airline | Headquartered | Annual Passengers |
|---|---|---|---|
| 1 | American Airlines | 🇺🇸 U.S. | 199.3M |
| 2 | Delta Airlines | 🇺🇸 U.S. | 171.4M |
| 3 | Ryanair Group* | 🇮🇪 Ireland | 168.6M |
| 4 | United Airlines | 🇺🇸 U.S. | 144.3M |
| 5 | Southwest Airlines | 🇺🇸 U.S. | 126.6M |
| 6 | Lufthansa Group | 🇩🇪 Germany | 101.8M |
| 7 | International Airlines Group (IAG) | 🇬🇧 UK | 94.7M |
| 8 | IndiGo* | 🇮🇳 India | 85.3M |
| 9 | Turkish Airlines Group | 🇹🇷 Türkiye | 71.8M |
| 10 | easyJet** | 🇬🇧 UK | 69.7M |
| 11 | Air France / KLM Group | 🇫🇷 France | 65.0M |
| 12 | China Southern Group | 🇨🇳 China | 62.6M |
| 13 | LATAM Group | 🇨🇱 Chile | 62.4M |
| 14 | Wizz Air* | 🇭🇺 Hungary | 51.1M |
| 15 | Emirates Airline* | 🇦🇪 UAE | 43.6M |
| 16 | China Eastern Group | 🇨🇳 China | 42.5M |
| 17 | Alaska Air Group | 🇺🇸 U.S. | 41.5M |
| 18 | Aeroflot Group | 🇷🇺 Russia | 40.7M |
| 19 | JetBlue Airways | 🇺🇸 U.S. | 39.6M |
| 20 | ANA Group* | 🇯🇵 Japan | 38.7M |
*Financial year for these airlines ended in March, 2023. **Financial year for this airline ended in September 2022.
Close behind American is another U.S.-based rival, Delta, which got more than 170 million passengers to their destinations.
Ranked third is Ryanair Group, headquartered in Ireland, the most popular of the low-cost carriers (defined by their lower fares and no-frills service) which transported more than 168 million passengers around the world.
Rounding out the top five are two other U.S.-based airlines, United and Southwest, with annual passenger figures of 144.3 million and 126.6 million respectively.
Ranked: Top 20 Airlines By Revenue in 2022
Examining the same list of airlines by the most revenue earned over the year throws up a few interesting surprises.
| Rank | Airline | Headquartered | Annual Revenue (USD Billions) |
|---|---|---|---|
| 1 | American Airlines | 🇺🇸 U.S. | $49.0 |
| 2 | Delta Airlines | 🇺🇸 U.S. | $45.6 |
| 3 | United Airlines | 🇺🇸 U.S. | $45.0 |
| 4 | Emirates Airline* | 🇦🇪 UAE | $29.2 |
| 5 | Air France / KLM Group | 🇫🇷 France | $27.5 |
| 6 | Lufthansa Group | 🇩🇪 Germany | $26.9 |
| 7 | International Airlines Group (IAG) | 🇬🇧 UK | $24.0 |
| 8 | Southwest Airlines | 🇺🇸 U.S. | $23.8 |
| 9 | Turkish Airlines Group | 🇹🇷 Türkiye | $18.4 |
| 10 | China Southern Group | 🇨🇳 China | $13.0 |
| 11 | ANA Group* | 🇯🇵 Japan | $12.6 |
| 12 | Ryanair Group* | 🇮🇪 Ireland | $11.2 |
| 13 | Alaska Air Group | 🇺🇸 U.S. | $9.7 |
| 14 | LATAM Group | 🇨🇱 Chile | $9.4 |
| 15 | JetBlue Airways | 🇺🇸 U.S. | $9.2 |
| 16 | Aeroflot Group | 🇷🇺 Russia | $7.7 |
| 17 | IndiGo* | 🇮🇳 India | $7.1 |
| 18 | easyJet** | 🇬🇧 UK | $7.0 |
| 19 | China Eastern Group | 🇨🇳 China | $6.9 |
| 20 | Wizz Air* | 🇭🇺 Hungary | $4.1 |
*Financial year for these airlines ended in March, 2023. **Financial year for this airline ended in September 2022.
American and Delta retain their top positions—earning $49 billion and $45 billion respectively—but Ryanair Group falls out of the top five to 12th place, having made $11.2 billion last year.
Other low-cost carriers—IndiGo from India and EasyJet from the UK—also slide down ranks, both pulling in about $7 billion in revenue.
Air Passenger Traffic by Region in 2022
Airlines with headquarters in Europe transported one-third of all air passengers in 2022, slightly ahead of their U.S.-based counterparts.
| Region | Passenger Share (2022) |
|---|---|
| Europe | 31.5% |
| U.S. & Canada | 29.7% |
| Asia & South Pacific | 23.3% |
| Latin America | 9.2% |
| Middle East & Africa | 6.4% |
This was despite Russia’s Aeroflot losing both passengers and revenue between 2021–2022, as the airline was banned from entering the U.S., Canada, UK, and EU airspace.
Meanwhile, all four of China’s largest airlines also suffered traffic drops as the country grappled with residual effects of the pandemic, impacting Asia’s share of passengers.


Markets
The European Stock Market: Attractive Valuations Offer Opportunities
On average, the European stock market has valuations that are nearly 50% lower than U.S. valuations. But how can you access the market?


European Stock Market: Attractive Valuations Offer Opportunities
Europe is known for some established brands, from L’Oréal to Louis Vuitton. However, the European stock market offers additional opportunities that may be lesser known.
The above infographic, sponsored by STOXX, outlines why investors may want to consider European stocks.
Attractive Valuations
Compared to most North American and Asian markets, European stocks offer lower or comparable valuations.
| Index | Price-to-Earnings Ratio | Price-to-Book Ratio |
|---|---|---|
| EURO STOXX 50 | 14.9 | 2.2 |
| STOXX Europe 600 | 14.4 | 2 |
| U.S. | 25.9 | 4.7 |
| Canada | 16.1 | 1.8 |
| Japan | 15.4 | 1.6 |
| Asia Pacific ex. China | 17.1 | 1.8 |
Data as of February 29, 2024. See graphic for full index names. Ratios based on trailing 12 month financials. The price to earnings ratio excludes companies with negative earnings.
On average, European valuations are nearly 50% lower than U.S. valuations, potentially offering an affordable entry point for investors.
Research also shows that lower price ratios have historically led to higher long-term returns.
Market Movements Not Closely Connected
Over the last decade, the European stock market had low-to-moderate correlation with North American and Asian equities.
The below chart shows correlations from February 2014 to February 2024. A value closer to zero indicates low correlation, while a value of one would indicate that two regions are moving in perfect unison.
| EURO STOXX 50 | STOXX EUROPE 600 | U.S. | Canada | Japan | Asia Pacific ex. China |
|
|---|---|---|---|---|---|---|
| EURO STOXX 50 | 1.00 | 0.97 | 0.55 | 0.67 | 0.24 | 0.43 |
| STOXX EUROPE 600 | 1.00 | 0.56 | 0.71 | 0.28 | 0.48 | |
| U.S. | 1.00 | 0.73 | 0.12 | 0.25 | ||
| Canada | 1.00 | 0.22 | 0.40 | |||
| Japan | 1.00 | 0.88 | ||||
| Asia Pacific ex. China | 1.00 |
Data is based on daily USD returns.
European equities had relatively independent market movements from North American and Asian markets. One contributing factor could be the differing sector weights in each market. For instance, technology makes up a quarter of the U.S. market, but health care and industrials dominate the broader European market.
Ultimately, European equities can enhance portfolio diversification and have the potential to mitigate risk for investors.
Tracking the Market
For investors interested in European equities, STOXX offers a variety of flagship indices:
| Index | Description | Market Cap |
|---|---|---|
| STOXX Europe 600 | Pan-regional, broad market | €10.5T |
| STOXX Developed Europe | Pan-regional, broad-market | €9.9T |
| STOXX Europe 600 ESG-X | Pan-regional, broad market, sustainability focus | €9.7T |
| STOXX Europe 50 | Pan-regional, blue-chip | €5.1T |
| EURO STOXX 50 | Eurozone, blue-chip | €3.5T |
Data is as of February 29, 2024. Market cap is free float, which represents the shares that are readily available for public trading on stock exchanges.
The EURO STOXX 50 tracks the Eurozone’s biggest and most traded companies. It also underlies one of the world’s largest ranges of ETFs and mutual funds. As of November 2023, there were €27.3 billion in ETFs and €23.5B in mutual fund assets under management tracking the index.
“For the past 25 years, the EURO STOXX 50 has served as an accurate, reliable and tradable representation of the Eurozone equity market.”
— Axel Lomholt, General Manager at STOXX
Partnering with STOXX to Track the European Stock Market
Are you interested in European equities? STOXX can be a valuable partner:
- Comprehensive, liquid and investable ecosystem
- European heritage, global reach
- Highly sophisticated customization capabilities
- Open architecture approach to using data
- Close partnerships with clients
- Part of ISS STOXX and Deutsche Börse Group
With a full suite of indices, STOXX can help you benchmark against the European stock market.
Learn how STOXX’s European indices offer liquid and effective market access.

-

 Economy2 days ago
Economic Growth Forecasts for G7 and BRICS Countries in 2024
The IMF has released its economic growth forecasts for 2024. How do the G7 and BRICS countries compare?
-

 Markets2 weeks ago
U.S. Debt Interest Payments Reach $1 Trillion
U.S. debt interest payments have surged past the $1 trillion dollar mark, amid high interest rates and an ever-expanding debt burden.
-

 United States2 weeks ago
Ranked: The Largest U.S. Corporations by Number of Employees
We visualized the top U.S. companies by employees, revealing the massive scale of retailers like Walmart, Target, and Home Depot.
-

 Markets2 weeks ago
The Top 10 States by Real GDP Growth in 2023
This graphic shows the states with the highest real GDP growth rate in 2023, largely propelled by the oil and gas boom.
-

 Markets2 weeks ago
Ranked: The World’s Top Flight Routes, by Revenue
In this graphic, we show the highest earning flight routes globally as air travel continued to rebound in 2023.
-

 Markets3 weeks ago
Ranked: The Most Valuable Housing Markets in America
The U.S. residential real estate market is worth a staggering $47.5 trillion. Here are the most valuable housing markets in the country.

-

 Debt1 week ago
How Debt-to-GDP Ratios Have Changed Since 2000
-
Markets2 weeks ago
Ranked: The World’s Top Flight Routes, by Revenue
-

 Countries2 weeks ago
Population Projections: The World’s 6 Largest Countries in 2075
-
Markets2 weeks ago
The Top 10 States by Real GDP Growth in 2023
-

 Demographics2 weeks ago
The Smallest Gender Wage Gaps in OECD Countries
-

 United States2 weeks ago
Where U.S. Inflation Hit the Hardest in March 2024
-

 Green2 weeks ago
Top Countries By Forest Growth Since 2001
-
United States2 weeks ago
Ranked: The Largest U.S. Corporations by Number of Employees