Misc
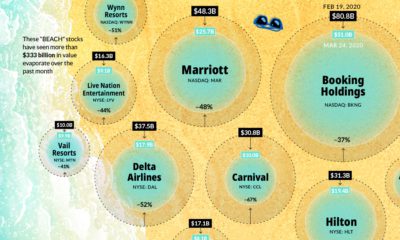
Ranked: Global Airlines with the Most Plane Crashes
![]() See this visualization first on the Voronoi app.
See this visualization first on the Voronoi app.
Ranked: Global Airlines With the Most Plane Crashes
This was originally posted on our Voronoi app. Download the app for free on iOS or Android and discover incredible data-driven charts from a variety of trusted sources.
Before flight was even invented, humans have been fascinated by the vast skies above them, and for obvious reasons. There is inherent marvel in defying something as fundamental as gravity; in quite literally, reaching for the stars.
And from the early days of military use, the aviation industry is now critical to the movement of goods and people around the world.
Nevertheless, there are accidents, and while few and far between, their scale and tragedy tend to leave a big impact on collective psyches. But which airline companies have seen the most number of incidents?
Using research published by Executive Flyers on September 19, 2023, we rank global airlines based on the number of their plane crashes.
Which Global Airline Has Had the Most Crashes?
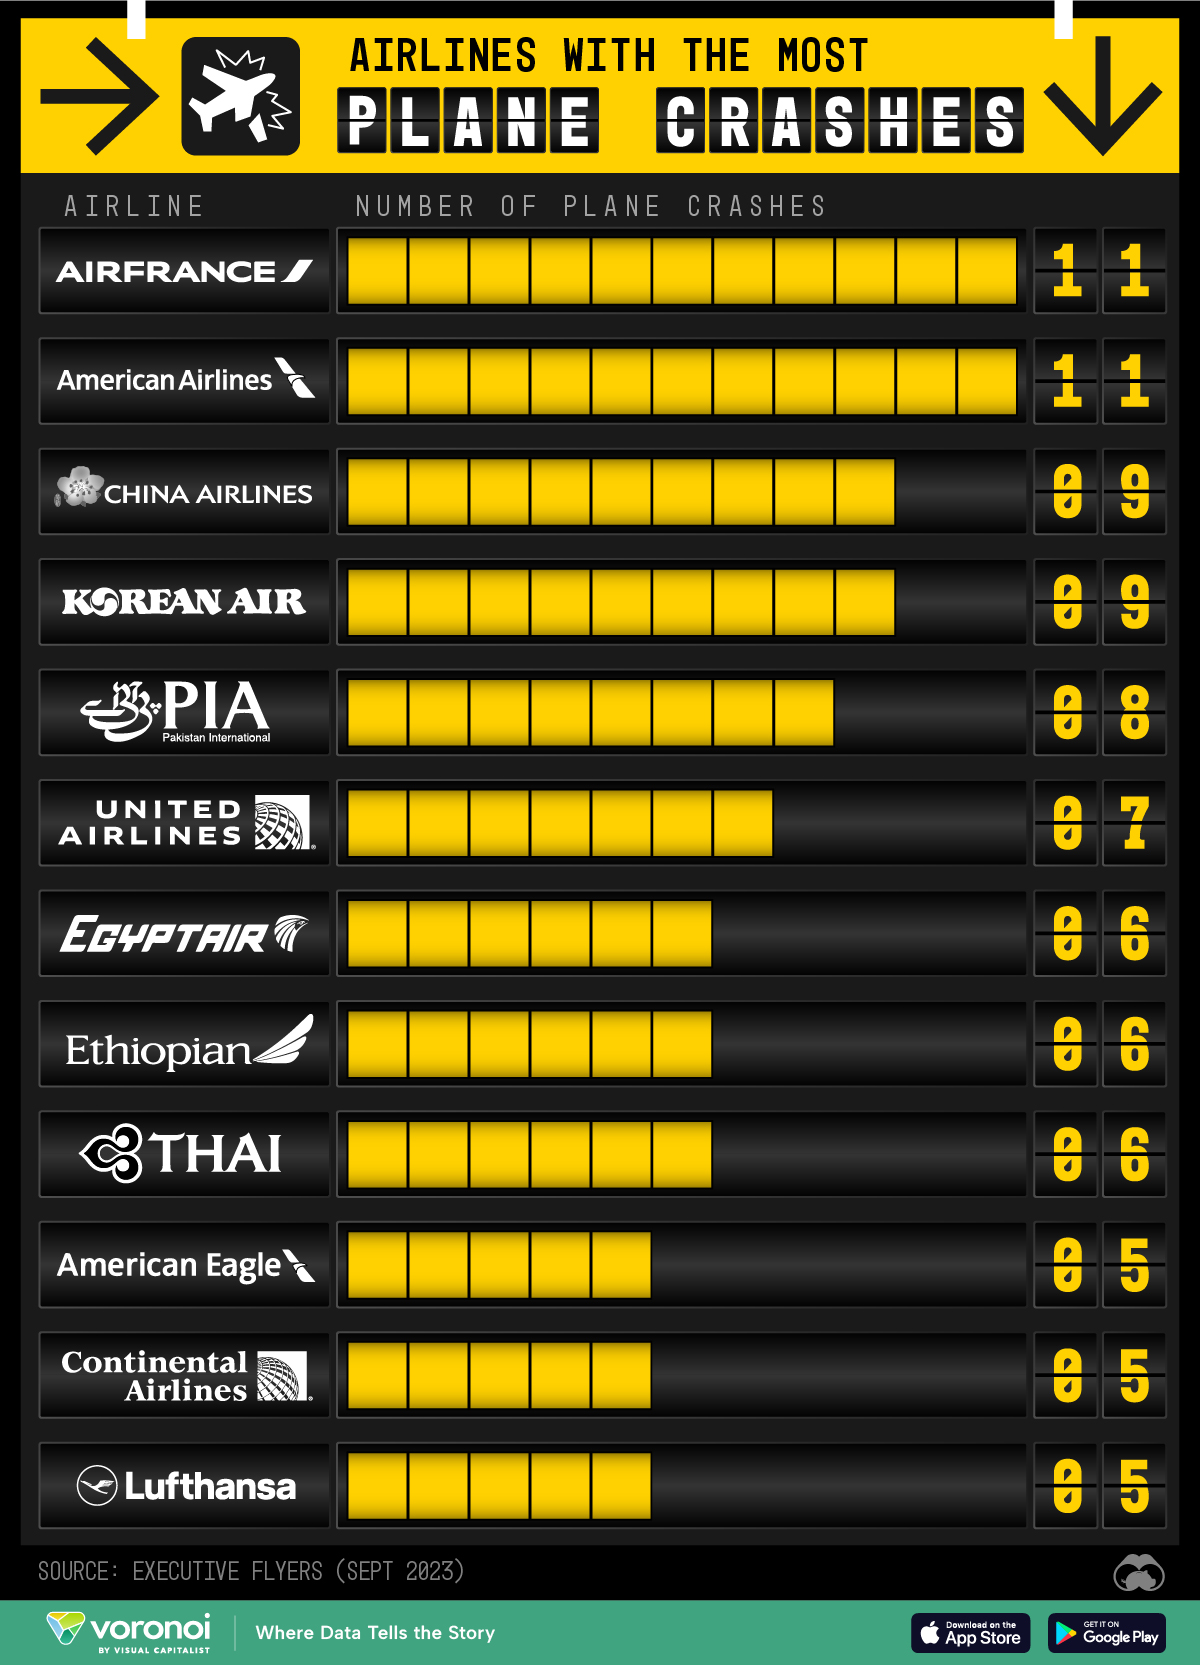
Air France and American Airlines tie for most plane crashes, with 11 each.
Notably two of American’s incidents happened on September 11th, 2001, as did two from United Airlines’ seven crashes.
| Rank | Airline | Number of plane crashes |
|---|---|---|
| 1 | American Airlines | 11 |
| 1 | Air France | 11 |
| 2 | China Airlines | 9 |
| 2 | Korean Air | 9 |
| 3 | Pakistan International Airlines | 8 |
| 4 | United Airlines | 7 |
| 5 | Egyptair | 6 |
| 5 | Ethiopian Airlines | 6 |
| 5 | Thai Airways | 6 |
| 6 | American Eagle | 5 |
| 6 | Continental Airlines | 5 |
| 6 | Lufthansa | 5 |
Note: American Eagle is the brand name of a regional branch of American Airlines. Continental Airlines merged with United in 2012.
China Airlines and Korean Air also tie with nine crashes each, followed by Pakistan International Airlines with eight accidents.
While many plane crashes do not result in fatalities, here are some examples that were particularly deadly:
- Air France: In June 2009, Flight 477 crashed into the Atlantic Ocean killing all 228 onboard.
- Air China: In May 2002, Flight 611 disintegrated mid-air due to repair faults, killing all 225 onboard.
- United Airlines: In Sept 1965, Flight 389 crashed while landing in Salt Lake City, killing 43 of 91 passengers.
- Thai Airlines: In Aug 1987, Flight 365 crashed near Phuket, killing all 83 onboard.
The much-covered disappearance of Malaysian Airlines Flight 370 in 2014 prompted an overhaul of airline regulations and safety measures including better satellite tracking and improved training for crews during emergency situations.
And aside from pilot error, aircraft models themselves can often be the cause of accidents. Two Boeing 737 Max planes crashed in 2018–19, stemming from issues with the model’s Maneuvering Characteristics Augmentation System system, a flight control software designed to prevent stalls.
Finally, hostile airspace has also caused aircraft accidents. Malaysia Airlines Flight 17 and Ukraine International Airlines Flight 752 were shot down by Russian separatist forces and Islamic Revolutionary Guard Corps in 2014 and 2020 respectively.
How Safe is Air Travel?
It is useful to remember however that airlines have suffered a very small number of accidents throughout history. Considering there are tens of millions of flights per year, major crashes are actually extremely rare.
“If you take one flight a day, you would, on average, need to fly every day for 55,000 years before being involved in a fatal crash.” — Arnold Barnett, Professor of Statistics at MIT, via ABC News.
According to The Wall Street Journal, the U.S. has gone nearly 15 years without a major commercial airline crash, despite the more than 100 million flights and 10 billion passengers since then.


VC+
VC+: Get Our Key Takeaways From the IMF’s World Economic Outlook
A sneak preview of the exclusive VC+ Special Dispatch—your shortcut to understanding IMF’s World Economic Outlook report.

Have you read IMF’s latest World Economic Outlook yet? At a daunting 202 pages, we don’t blame you if it’s still on your to-do list.
But don’t worry, you don’t need to read the whole April release, because we’ve already done the hard work for you.
To save you time and effort, the Visual Capitalist team has compiled a visual analysis of everything you need to know from the report—and our VC+ Special Dispatch is available exclusively to VC+ members. All you need to do is log into the VC+ Archive.
If you’re not already subscribed to VC+, make sure you sign up now to access the full analysis of the IMF report, and more (we release similar deep dives every week).
For now, here’s what VC+ members get to see.
Your Shortcut to Understanding IMF’s World Economic Outlook
With long and short-term growth prospects declining for many countries around the world, this Special Dispatch offers a visual analysis of the key figures and takeaways from the IMF’s report including:
- The global decline in economic growth forecasts
- Real GDP growth and inflation forecasts for major nations in 2024
- When interest rate cuts will happen and interest rate forecasts
- How debt-to-GDP ratios have changed since 2000
- And much more!

Get the Full Breakdown in the Next VC+ Special Dispatch
VC+ members can access the full Special Dispatch by logging into the VC+ Archive, where you can also check out previous releases.
Make sure you join VC+ now to see exclusive charts and the full analysis of key takeaways from IMF’s World Economic Outlook.
Don’t miss out. Become a VC+ member today.
What You Get When You Become a VC+ Member
VC+ is Visual Capitalist’s premium subscription. As a member, you’ll get the following:
- Special Dispatches: Deep dive visual briefings on crucial reports and global trends
- Markets This Month: A snappy summary of the state of the markets and what to look out for
- The Trendline: Weekly curation of the best visualizations from across the globe
- Global Forecast Series: Our flagship annual report that covers everything you need to know related to the economy, markets, geopolitics, and the latest tech trends
- VC+ Archive: Hundreds of previously released VC+ briefings and reports that you’ve been missing out on, all in one dedicated hub
You can get all of the above, and more, by joining VC+ today.

-

 Education1 week ago
How Hard Is It to Get Into an Ivy League School?
-

 Technology2 weeks ago
Ranked: Semiconductor Companies by Industry Revenue Share
-

 Markets2 weeks ago
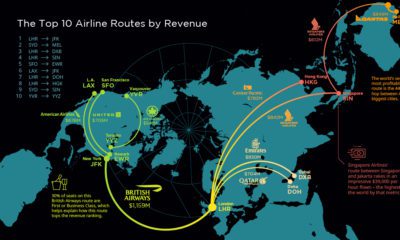
Ranked: The World’s Top Flight Routes, by Revenue
-

 Demographics2 weeks ago
Population Projections: The World’s 6 Largest Countries in 2075
-

 Markets2 weeks ago
The Top 10 States by Real GDP Growth in 2023
-

 Demographics2 weeks ago
The Smallest Gender Wage Gaps in OECD Countries
-

 Economy2 weeks ago
Where U.S. Inflation Hit the Hardest in March 2024
-

 Green2 weeks ago
Top Countries By Forest Growth Since 2001