Media
Charted: 50 Years of Music Industry Revenues, by Format
Charted: 50 Years of Music Industry Revenues, by Format
In the ever-changing world of music, 2022 marked yet another milestone.
For the seventh year in a row, recorded music revenues in the United States rose, hitting a record high of $15.9 billion.
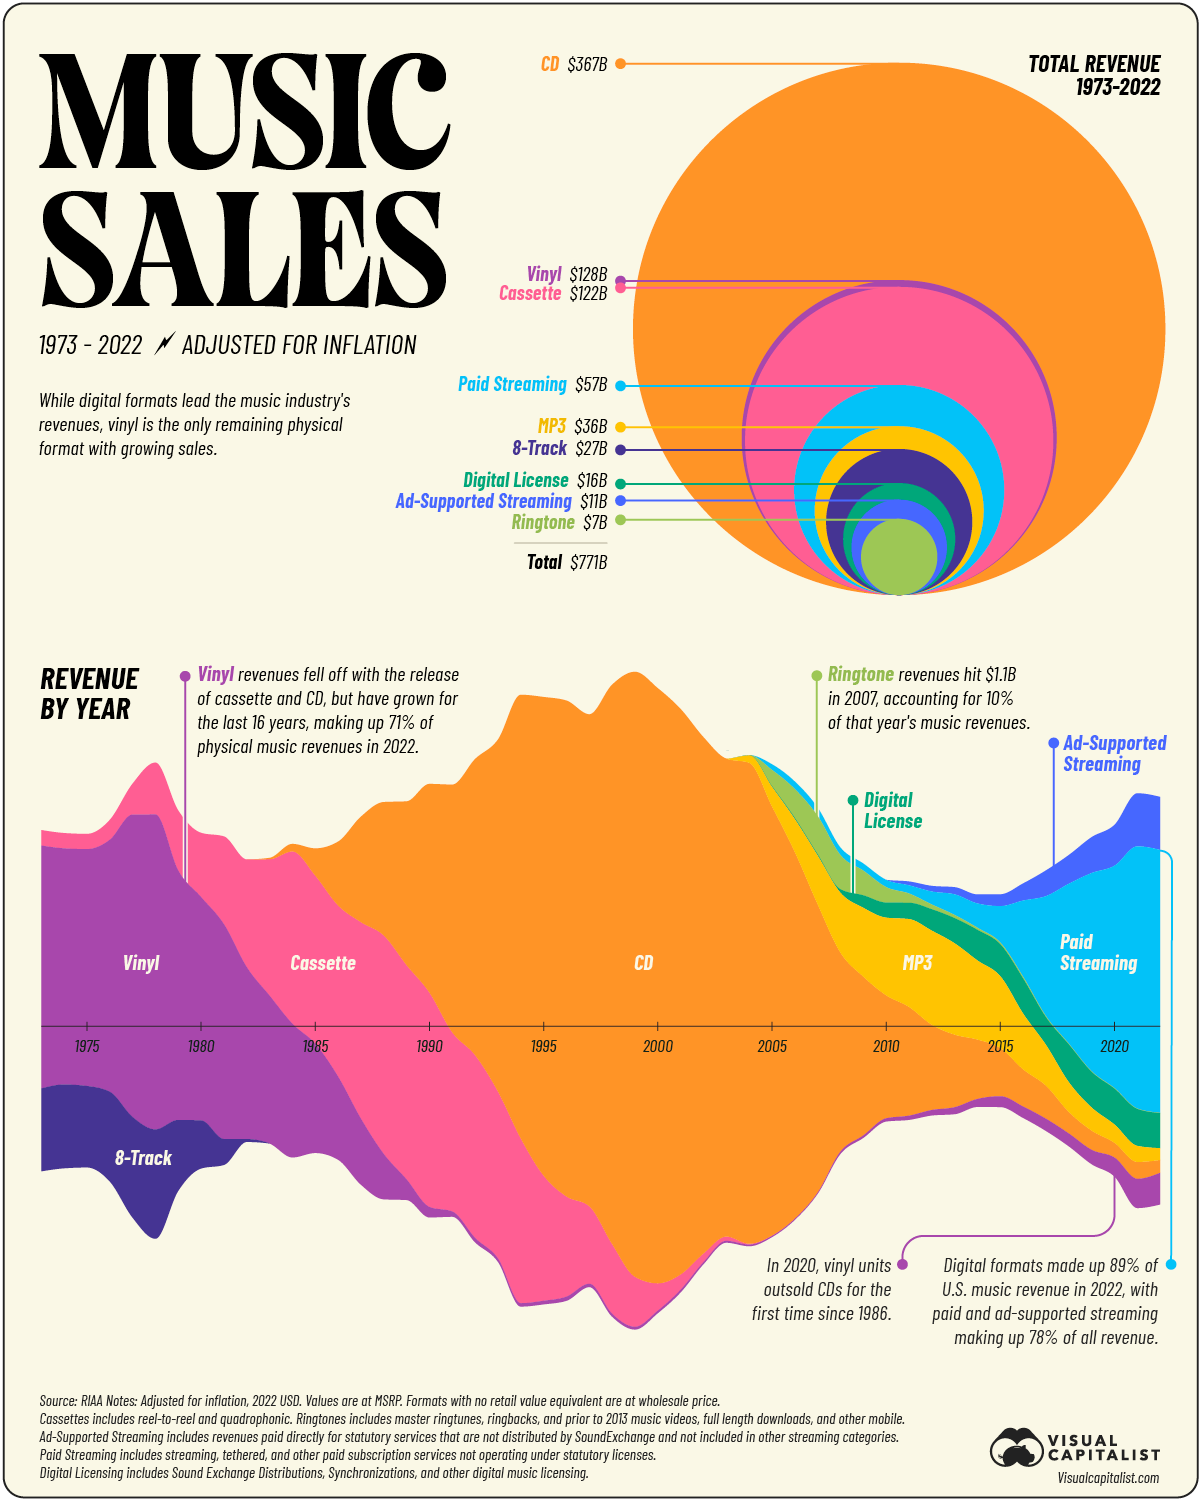
The graphic above uses data from the Recording Industry Association of America to chart the music industry’s evolution over the last 50 years.
The Analog Era: Vinyl to Cassettes to CDs
From the 1970s to the 1990s, the music industry experienced a remarkable transformation in physical formats.
The 1970s emerged as a golden age for vinyl records, giving rise to timeless classics such as Pink Floyd’s “Dark Side of the Moon” (1973), Led Zeppelin’s “IV” (1971), and Fleetwood Mac’s “Rumours” (1977) that continue to captivate collectors and music enthusiasts today.
Vinyl was soon followed by the portable convenience of cassette tapes in the 1980s. Those who had their teenage years during the ’80s will remember how the Walkman became one of their best friends. Cassette players were also standard equipment in cars.
It was the 1990s, however, that saw the arrival of the biggest game-changer of the 20th century: digital music and compact discs.
The Music Industry’s Digital Revolution
Because of the significant jump in capacity and audio quality compared to cassettes, the compact disc (CD) quickly became the leader in sales, peaking in 2000 with global sales estimated at around 2.5 billion.
CDs would stick around well into the 2000s. But by this time, the first MP3 players were already making their mark, making the idea of strolling around with a disc containing just 10 or 12 tracks feel outdated.
Amid the growth of digital music, ringtone and ringback revenues also reached an impressive $1.1 billion in 2007, constituting 10% of the music industry’s earnings for that year. At the same time, digital music allowed consumers to purchase cheaper individual songs instead of full albums, and made piracy easier and more widespread, cutting into sales.
Today, this once-lucrative market has dwindled significantly. A mere 4.5 million ringtones and ringbacks were purchased in 2022, generating a modest $11 million in revenue and representing only 0.1% of the year’s music industry earnings.
Changing the Sound of Music
Over the last 20 years, streaming took over the music industry.
Digital music revenues comprised 89% of the U.S. music industry’s revenue in 2022. Streaming services like Spotify, Amazon Music, and Apple Music made up 84% of the total industry revenue.
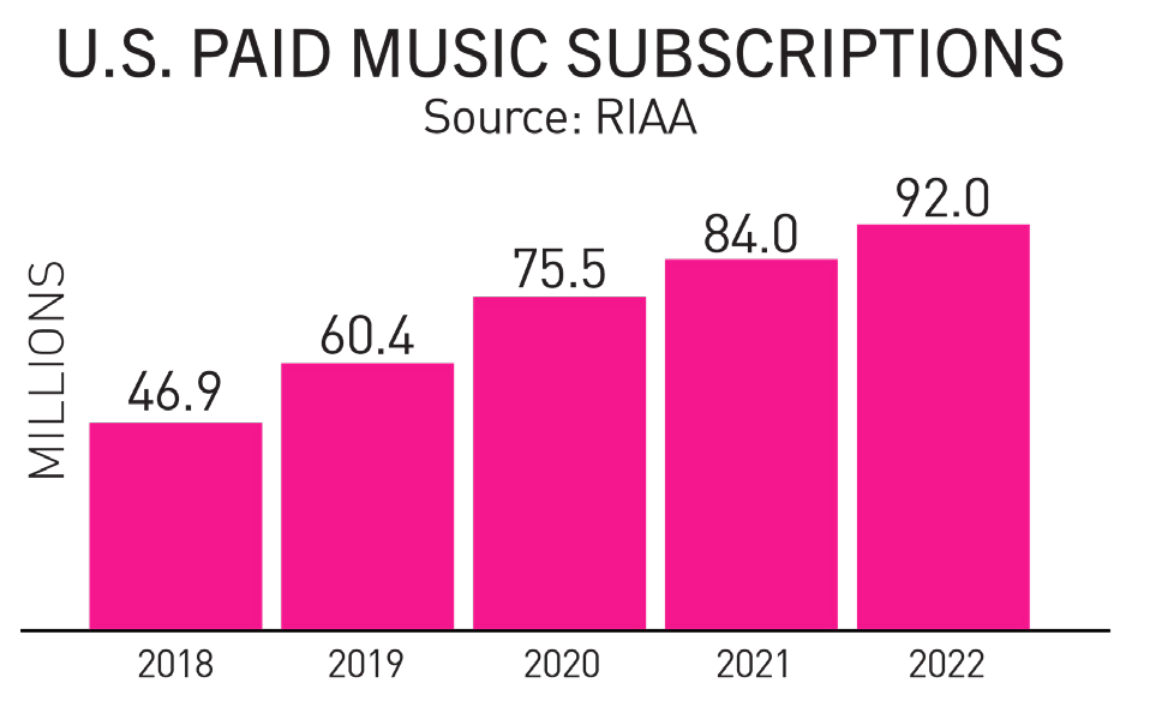
The number of paid subscriptions to on-demand music services surged past 92 million, showcasing the continued appetite for music.
For the third consecutive year, Puerto Rican rapper Bad Bunny was the most-streamed artist (18.5 billion streams), followed by Taylor Swift, Drake, The Weeknd, and BTS.
As the Wall Street Journal pointed out in a recent article, the success of streaming services is not just transforming the music business but also changing the music.
That’s because companies compensate artists based on the number of monthly plays, but only count them if a user listens to a song beyond the initial 30 seconds.
To minimize the “skip rate,” musical artists strategically relocate a song’s hook or chorus after the initial 30-second window. In addition, there’s a growing trend of shorter songs, allowing artists to have more tracks streamed simultaneously.
The Vinyl Renaissance
While digital music is continuing to ascend, that doesn’t necessarily mean the end of physical format. Vinyl sales, for example, also grew in 2022.
In fact, last year, vinyls outsold CDs in terms of units for the first time since 1987.
Contrary to expectations that nostalgic Baby Boomers or Gen Xers are fueling the vinyl revival, surveys reveal that millennial consumers are actually propelling the sales.
The reasons for this trend vary, including factors such as the superior audio quality of vinyl, the perception of vinyl as collector’s items, and even the appeal of having a beautiful record player in the living room.


Culture
Animated: Best Picture Oscar Winners vs. Box Office Hits
This data-driven exploration examines the relationship between Best Picture Oscar winners and box office performance over the past 30 years.
 Creator Program
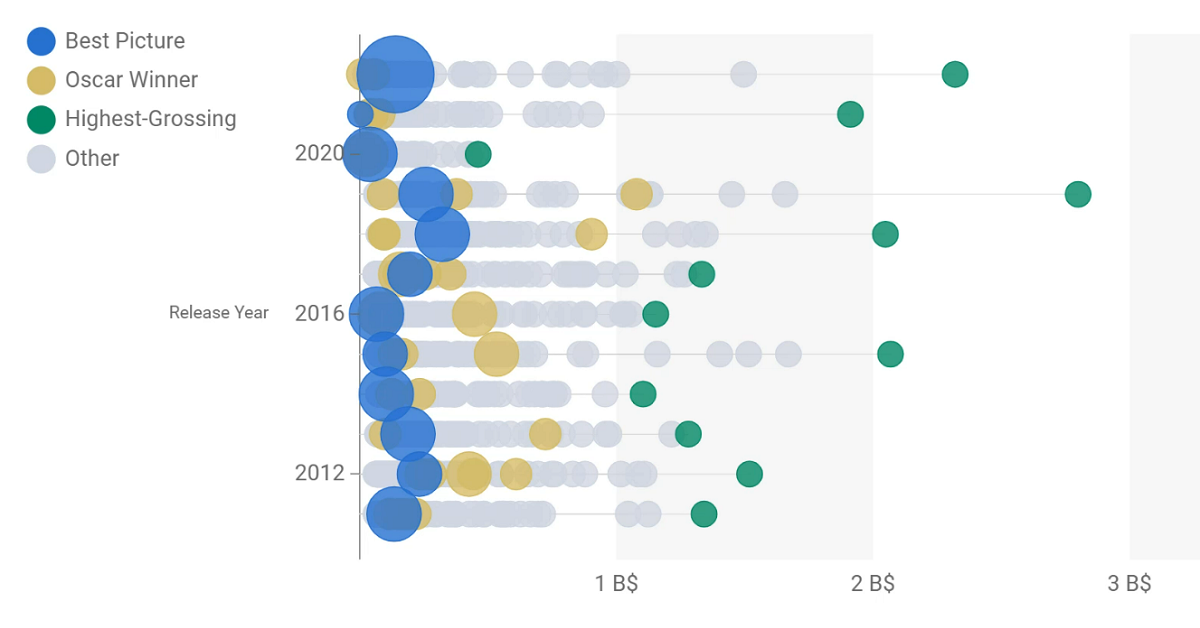
Best Picture Oscar Winners vs. Box Office Hits
When Oppenheimer won the Academy Award for Best Picture at the 2024 ceremony, it joined a list of Best Picture Oscar winners as a box office behemoth, having earned $958.7 million at the 2023 box office.
But as this data-driven exploration from Vizzu shows, the movie’s success is not par for the course. Over the past 30 years, there has been a complex relationship between Oscar accolades and box office performance.
Comparing Oscar Winners and Box Office Hits (1993–2023)
Using annual worldwide box office hauls from Box Office Mojo, Vizzu compared the earnings of Best Picture Oscar winners with those of the highest grossing movie of each year.
At last year’s event, Everything Everywhere All at Once won six Oscars (including Best Picture) and earned $143.4 million globally. That’s a decent haul, but pales in comparison with Avatar: The Way of Water, which grossed more than $2.3 billion.
As this table shows, more often than not, this divide between critical darling and commercial juggernaut has been the norm over since 1993:
| Film Year | Best Picture Winner | Box Office (Worldwide) | Box Office (Highest Grossing) |
|---|---|---|---|
| 2023 | Oppenheimer | $958.7M | $1,445.6M |
| 2022 | Everything Everywhere All at Once | $143.4M | $2,320.2M |
| 2021 | CODA | $1.9M | $1,912.2M |
| 2020 | Nomadland | $39.5M | $461.0M |
| 2019 | Parasite | $262.0M | $2,799.4M |
| 2018 | Green Book | $321.8M | $2,048.4M |
| 2017 | The Shape of Water | $195.2M | $1,332.5M |
| 2016 | Moonlight | $65.2M | $1,153.3M |
| 2015 | Spotlight | $98.7M | $2,068.2M |
| 2014 | Birdman or (The Unexpected Virtue of Ignorance) | $103.2M | $1,104.1M |
| 2013 | 12 Years a Slave | $187.7M | $1,280.8M |
| 2012 | Argo | $232.3M | $1,518.8M |
| 2011 | The Artist | $133.4M | $1,341.5M |
| 2010 | The King's Speech | $427.4M | $1,067.0M |
| 2009 | The Hurt Locker | $49.3M | $2,743.6M |
| 2008 | Slumdog Millionaire | $378.4M | $1,003.8M |
| 2007 | No Country for Old Men | $171.6M | $961.7M |
| 2006 | The Departed | $291.4M | $1,066.2M |
| 2005 | Crash | $98.4M | $895.9M |
| 2004 | Million Dollar Baby | $216.8M | $929.0M |
| 2003 | Lord of the Rings: The Return of the King | $1,140.7M | $1,140.7M |
| 2002 | Chicago | $306.8M | $936.7M |
| 2001 | A Beautiful Mind | $316.8M | $974.8M |
| 2000 | Gladiator | $460.6M | $546.4M |
| 1999 | American Beauty | $356.3M | $924.3M |
| 1998 | Shakespeare in Love | $289.3M | $553.7M |
| 1997 | Titanic | $1,843.4M | $1,843.4M |
| 1996 | The English Patient | $232.0M | $817.4M |
| 1995 | Braveheart | $213.2M | $366.1M |
| 1994 | Forrest Gump | $677.9M | $763.5M |
| 1993 | Schindler's List | $322.2M | $978.2M |
Only two films won Best Picture while topping the box office in their release year: The Lord of the Rings: The Return of the King in 2003 and Titanic in 1997.
Just seven more films won major Oscars—including Best Picture, Best Director, Best Actor/ Actress, Best Original/Adapted Screenplay, and Best Supporting Actor/Actress—while earning at least half as much as the top grossers of their release years:
- 2023: Oppenheimer
- 2013: Gravity
- 2008: The Dark Knight
- 2000: Gladiator
- 1998: Shakespeare in Love and Saving Private Ryan
- 1995: Braveheart
- 1994: Forrest Gump
This challenges the notion that blockbuster success and Oscar glory go hand-in-hand, but perhaps the success of Oppenheimer can help the box office kings reclaim their Oscar crowns.

-

 Education1 week ago
How Hard Is It to Get Into an Ivy League School?
-

 Technology2 weeks ago
Ranked: Semiconductor Companies by Industry Revenue Share
-

 Markets2 weeks ago
Ranked: The World’s Top Flight Routes, by Revenue
-

 Demographics2 weeks ago
Population Projections: The World’s 6 Largest Countries in 2075
-

 Markets2 weeks ago
The Top 10 States by Real GDP Growth in 2023
-

 Demographics2 weeks ago
The Smallest Gender Wage Gaps in OECD Countries
-

 Economy2 weeks ago
Where U.S. Inflation Hit the Hardest in March 2024
-

 Green2 weeks ago
Top Countries By Forest Growth Since 2001