Technology
Mapped: The Top Podcasts on Spotify Across Countries
The Top Spotify Podcast Across Countries
We are amidst the breakout era of podcasts. Since the beginning of the smartphone revolution, the digital audio format has picked up serious traction with audiences all over. In the U.S. alone, it’s estimated that there will be 132 million podcast listeners by 2022.
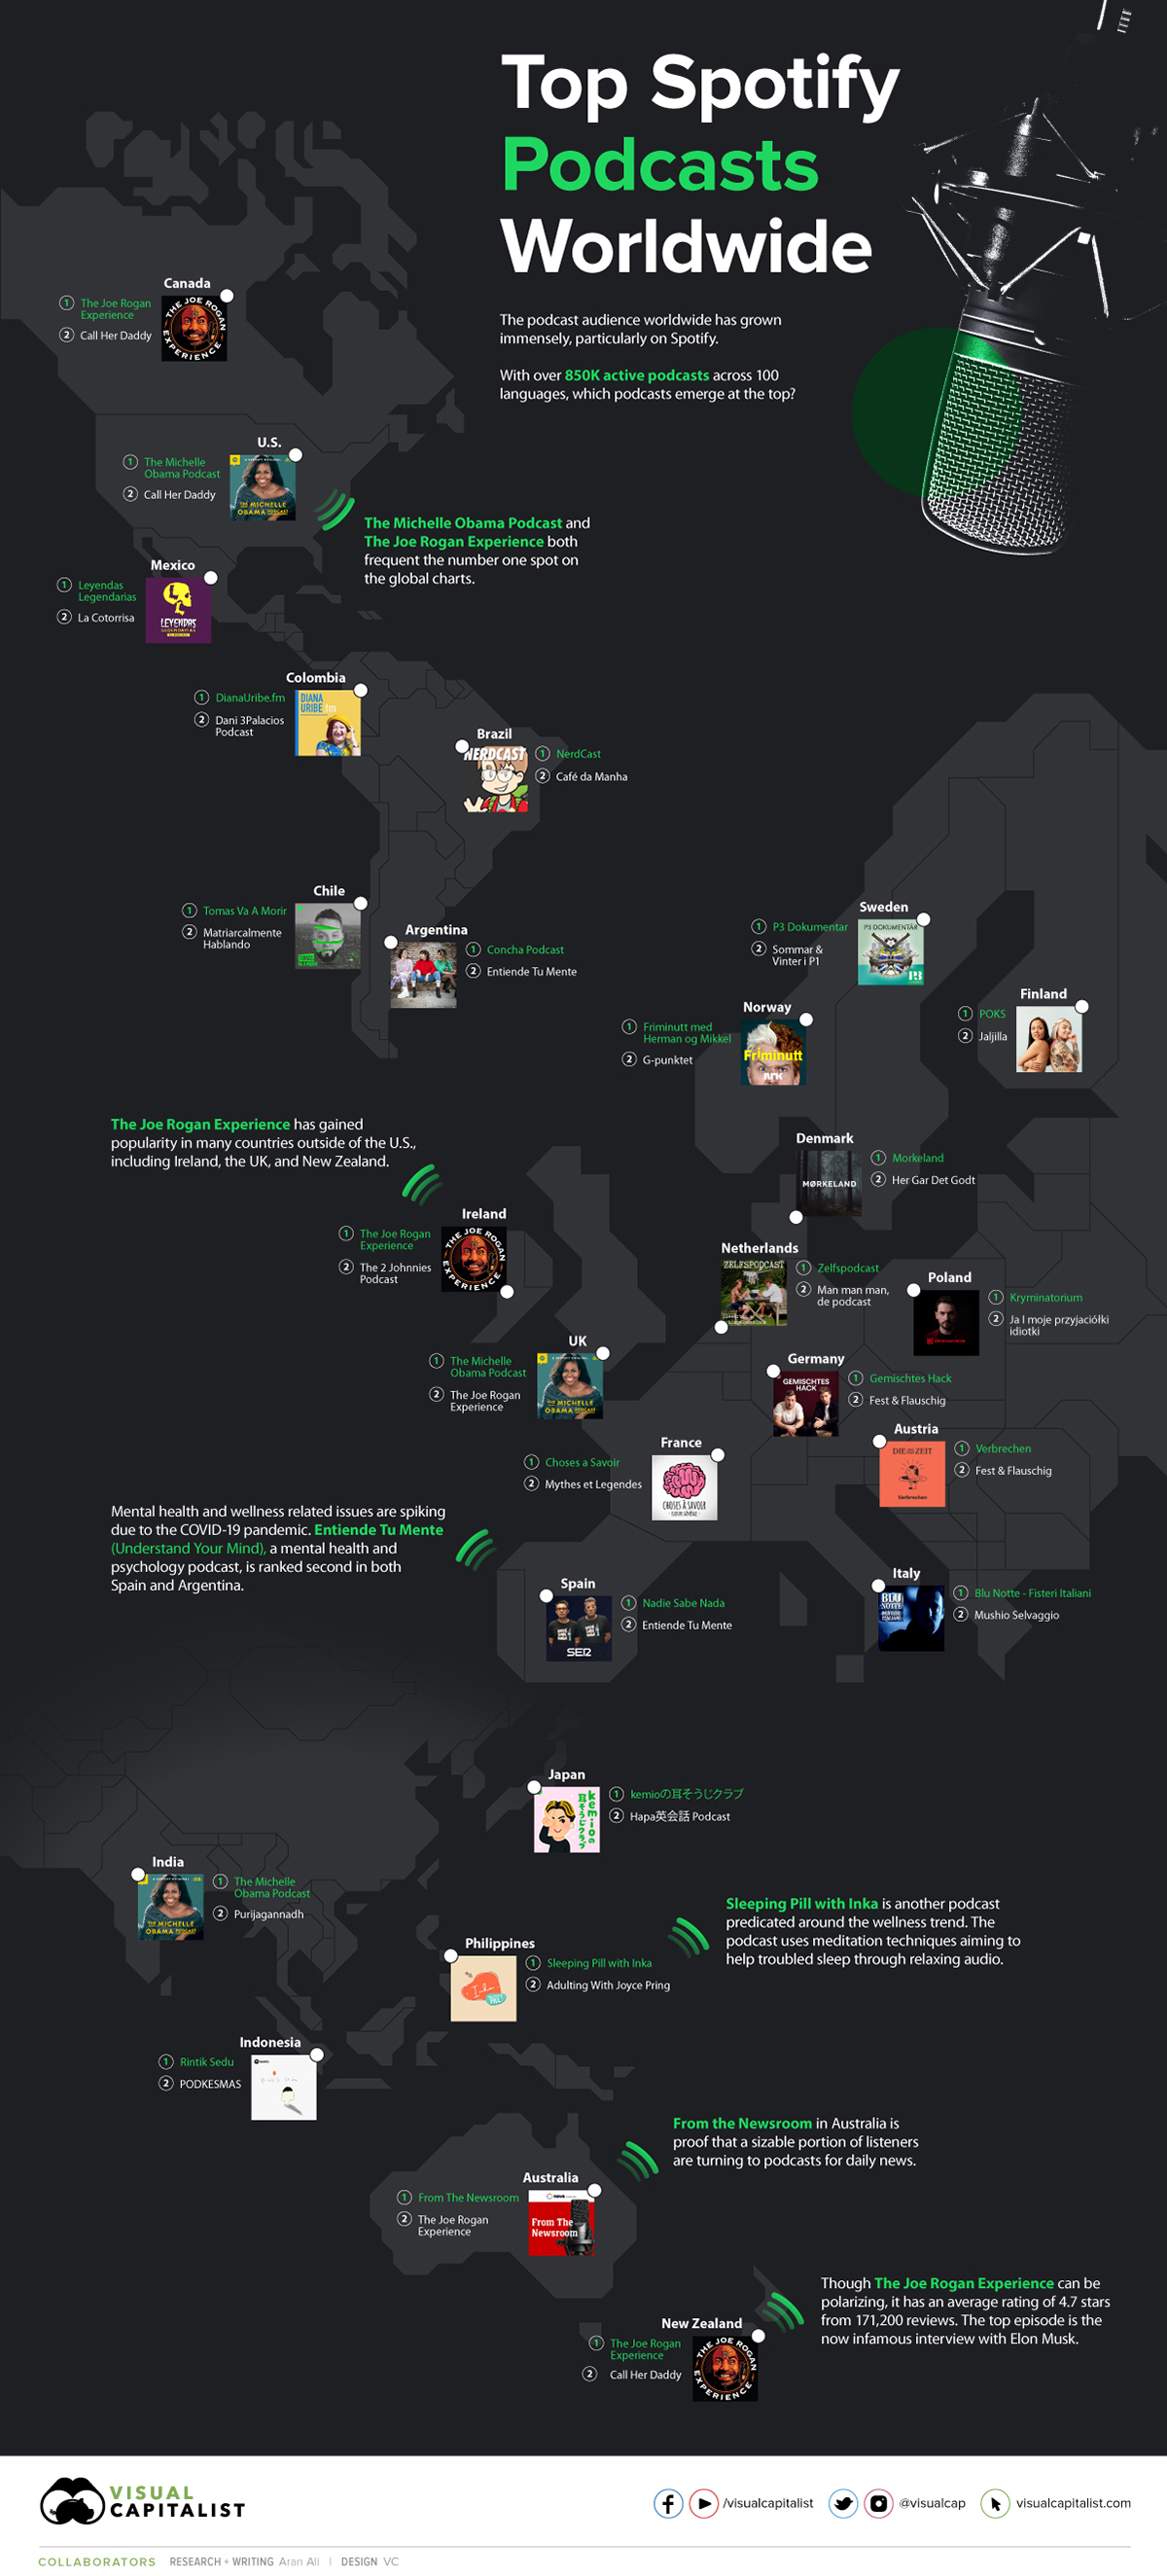
Today, there are 850,000 active podcasts available in 100 languages, with over 30 million episodes to tap into—perfect if you have an afternoon to yourself.
Worldwide Podcast Chart-Toppers
The data in this infographic comes from Spotify, the top global streaming service in the industry by paid users. How do the top podcasts fare on a per country basis?
Country | Top Podcast | Honorable Mention (Second Highest) |
---|---|---|
Canada | The Joe Rogan Experience | Call Her Daddy |
France | Choses a Savoir | Mythes et Legendes |
UK | The Michelle Obama Podcast | The Joe Rogan Experience |
Germany | Gemischtes Hack | Fest & Flauschig |
Italy | Blu Notte - Fisteri Italiani | Mushio Selvaggio |
U.S. | The Michelle Obama Podcast | Call Her Daddy |
Japan | kemioの耳そうじクラブ | Hapa英会話 Podcast |
Australia | From The Newsroom | The Joe Rogan Experience |
India | The Michelle Obama Podcast | Purijagannadh |
Ireland | The Joe Rogan Experience | The 2 Johnnies Podcast |
Mexico | Leyendas Legendarias | La Cotorrisa |
New Zealand | The Joe Rogan Experience | Call Her Daddy |
Argentina | Concha Podcast | Entiende Tu Mente |
Austria | Verbrechen | Fest & Flauschig |
Brazil | NerdCast | Café da Manha |
Chile | Tomas Va A Morir | Matriarcalmente Hablando |
Colombia | DianaUribe.fm | Dani 3Palacios Podcast |
Denmark | Morkeland | Her Gar Det Godt |
Finland | POKS | Jaliila |
Indonesia | Rintik Sedu | PODKESMAS |
Norway | Friminutt med Herman og Mikkel | G-punktet |
Philippines | Sleeping Pill with Inka | Adulting With Joyce Pring |
Poland | Kryminatorium | Ja I moje przyjaciółki idiotki |
Spain | Nadie Sabe Nada | Entiende Tu Mente |
Sweden | P3 Dokumentar | Sommar & Vinter i P1 |
Netherlands | Zelfspodcast | Man man man, de podcast |
Many of the top shows around the world follow a familiar interview or conversational format, but there are trends that deviate from that formula. In particular, there are a number of podcasts focused on health and wellness as well as current events.
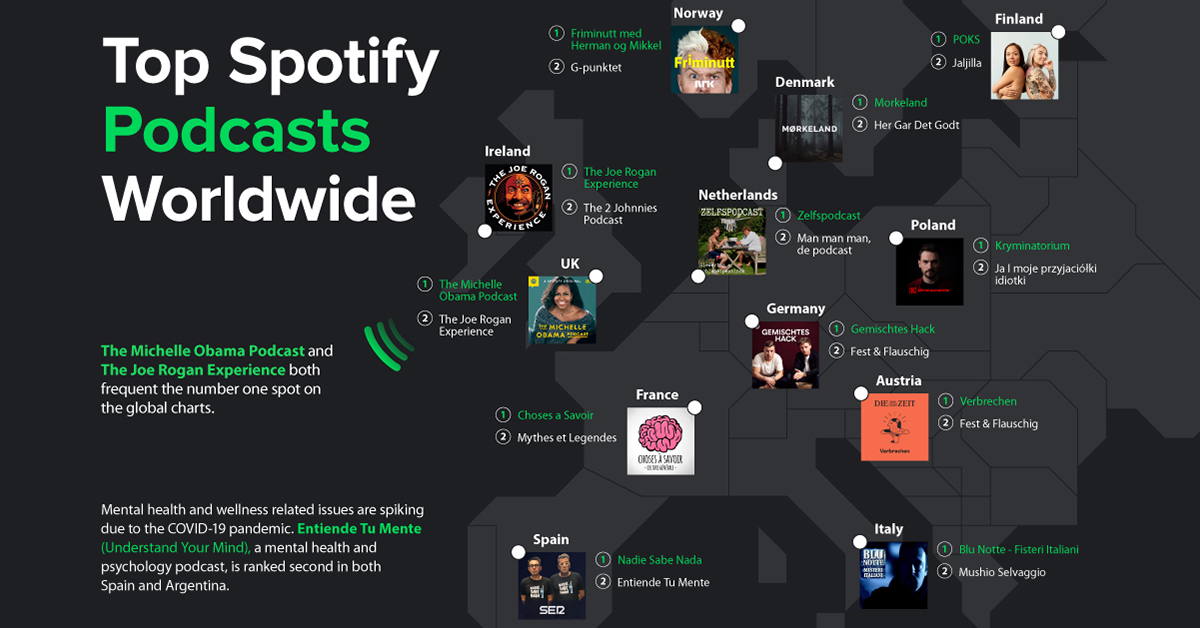
The early beginnings of podcasting were dominated by upstart content creators, but as the market has matured, big media outlets and A-list personalities have been vying for listeners’ attention in an increasingly crowded field. As it stands now, two podcasts from America carry a large presence in foreign markets, and the two big personalities—Michelle Obama and Joe Rogan—stand a notch above the rest.
The Rogan-Obama tug of war in the podcast realm has had its back and forths. Obama pulled ahead in many countries in August, but in September the pendulum swung in favor of Rogan.
Follow The Money
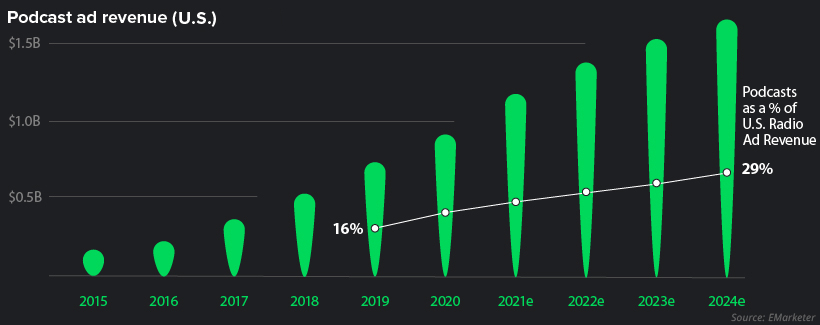
In 2015, ad revenue in the podcast industry was a minuscule $69 million across the board. It’s expected to reach over $1 billion by 2021, and to grow further from there.
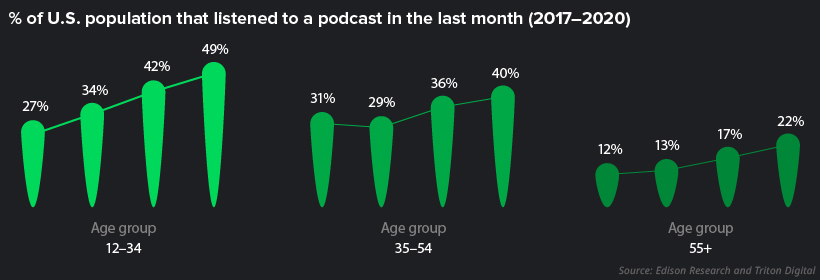
The podcast boom is powered by younger generations, and both millennials and Gen Z represent a sizable portion of the total podcast audience globally. In particular, demographic listenership numbers experience a big drop after the 35-54 age bracket.
Flexibility and variety are key features that are helping fuel the growth of the medium. One can keep up with serious world affairs or listen to Call Her Daddy—a podcast on sex and relationships by Barstool Sports, another podcast that frequently tops the charts.
Top Podcast Publishers by U.S. Audience
When it comes to key participants in the industry, National Public Radio (NPR) sits on the top spot with over 26 million unique monthly audience members. In close second, iHeartRadio holds a whopping 494 shows.
Podcast Publisher | U.S. Unique Monthly Audience | Global Downloads & Streams | Active Shows |
---|---|---|---|
NPR | 26,933,000 | 219,716,000 | 49 |
iHeartRadio | 26,182,000 | 234,417,000 | 494 |
New York Times | 13,102,000 | 145,961,000 | 15 |
Barstool Sports | 10,228,000 | 67,569,000 | 43 |
PRX | 9,035,000 | 82,245,000 | 87 |
Wondery | 8,794,000 | 57,261,000 | 98 |
ESPN/ABC | 8,472,000 | 66,685,000 | 96 |
NBC News | 6,751,000 | 44,219,000 | 26 |
Cumulus Media/Westwood One | 6,473,000 | 40,912,000 | 115 |
Warner Media | 6,350,000 | 33,503,000 | 113 |
This American Life/Serial | 5,924,000 | 22,722,000 | 2 |
Kast Media | 5,319,000 | 30,353,000 | 46 |
Daily Wire | 5,212,000 | 43,342,000 | 5 |
WNYC Studios | 5,209,000 | 35,381,000 | 52 |
All Things Comedy | 4,890,000 | 28,770,000 | 58 |
TED | 3,739,000 | 51,696,000 | 10 |
American Public Media | 3,362,000 | 17,997,000 | 50 |
Fox News Radio | 2,518,000 | 13,633,000 | 34 |
Slate | 1,951,000 | 13,812,000 | 97 |
WBUR | 1,105,000 | 6,758,000 | 18 |
If you’re bullish on podcasts, many in the top 20 are publicly traded entities who either stand alone, or are part of a larger corporation. Notable stocks include the New York Times, ESPN as part of Disney, and Warner Media as part of AT&T.
Spotify Today and Tomorrow
Spotify’s direct listing IPO was initially met with a lack of confidence, due to Big Tech’s entry in the space, as well as the profitability and monetization concerns that typically plague the music industry as a whole. However, the company has done well in abating those concerns, especially if you consider Spotify’s stock price, which has doubled in the last year. An impressive 21% of Spotify’s monthly active users engage with podcast content.
In addition, a wealth of personalities have entered the podcasting space. These big names suggest that the competition is dialing up.
In recent months, an exclusive deal between Spotify and Joe Rogan, valued at over $100 million took the podcasting world by storm. This is quite a monumental step for the podcast timeline, and one that suggests more deals could follow as Spotify looks to lock people into their platform with exclusivity deals.
Support the Future of Data Storytelling
Sorry to interrupt your reading, but we have a favor to ask. At Visual Capitalist we believe in a world where data can be understood by everyone. That’s why we want to build the VC App - the first app of its kind combining verifiable and transparent data with beautiful, memorable visuals. All available for free.
As a small, independent media company we don’t have the expertise in-house or the funds to build an app like this. So we’re asking our community to help us raise funds on Kickstarter.
If you believe in data-driven storytelling, join the movement and back us on Kickstarter!
Thank you.

Technology
Ranked: The Best-Selling Video Game Consoles of All Time
Video game consoles have changed drastically over the last 50 years. Here are some of the best-selling ones across the globe.

Ranked: The Best-Selling Video Game Consoles of All Time
In 1972, the first-ever commercially available home video game console hit the market—the Magnavox Odyssey. Players of the Odyssey had a choice between two built-in games that were stored directly in the device, and would use a joystick and dials as a controller.
Video game consoles have come a long way since then, and the console market has grown into a multi-billion dollar industry that’s expected to reach $72.67 billion in value by the end of 2022.
This graphic by Enrique Mendoza uses data from VGChartz to show the market leaders in the industry, by highlighting the top-selling video consoles of all time, as of May 8, 2022.
Nine Generations of Video Game Consoles
Before diving into the top-selling consoles, it’s worth taking a step back to touch on the evolution of home consoles to show how they’ve changed over the years.
We dug into the literature on the history of video game consoles, and found that most articles and blog posts on the topic cite nine different generations of devices.
Here’s a breakdown of each generation, and some of their most noteworthy systems:
1972: Gen One, Where it Began
Consoles in the first generation had pre-built games that were stored directly on the device. They include the Magnavox Odyssey and Atari’s Pong.
1976: Gen Two Emerges
In this generation, games were sold separately, rather than programmed into the device. Consoles of this gen include the Fairchild Channel F and the Atari 2600.
1983: Gen Three, the “8-bit Generation”
This era’s consoles typically had 8-bit processes which allowed for more advanced graphics for the time. A few notable consoles during this gen were the Sega SG-1000 and the Nintendo Famicom, released outside Japan as the Nintendo Entertainment System (NES).
1987: Gen Four Elevates Handheld Gaming
Home consoles were released with 16-bit systems, meaning that audio and graphics improved even more in this era. But an arguably bigger moment for this gen was the emergence of the Nintendo Game Boy.
1993: The 3D Start of Gen Five
This generation saw the move away from pixels and towards 3D polygons. Some consoles like the Sony PlayStation started using CD-ROMs instead of cartridges, which stored more data at a cheaper cost and changed the industry.
1998: Gen Six and the Internet
At the start of this generation, the three major players in the console space were Sony, Sega, and Nintendo. By the end, Sega would be replaced with Microsoft as it launched the Xbox and helped popularize online console gaming.
2005: HD Graphics and Motion Controls of Gen Seven
On one side of the market, Microsoft and Sony were competing with high-definition graphics, faster processers, and different forms (Blu-rays or DVDs). But Nintendo’s motion-sensing Nintendo Wii arguably defined this generation, and the handheld Nintendo DS swept the market as well.
2012: Gen Eight’s Modern Consoles
Consoles of this era started having increased connectivity and processing power, with full HD an expectation. It was also an extremely long generation, starting with Nintendo’s unsuccessful Wii U and ending with the ultra-successful Nintendo Switch, widely considered the first hybrid console with three different ways to play: TV mode, handheld mode, or tabletop mode.
2020: Gen Nine and Beyond
So far, this generation has brought upgraded graphics (up to 8K resolution), larger games, and game-streaming capabilities. Devices in this gen include the Xbox Series X/S and PlayStation 5, which both use solid state drives to increase speed and performance, while Nintendo has yet to introduce a 9th generation device.
The Best-Selling Game Consoles
The best-selling video game console of all time is Sony’s PlayStation 2 (PS2). More than 157 million systems have been sold around the world since its launch in March 2000.
Rank | Console | Manufacturer | Global lifetime sales (millions) |
---|---|---|---|
1 | PlayStation 2 (PS2) | Sony | 157.68 |
2 | Nintendo DS (DS) | Nintendo | 154.90 |
3 | Game Boy (GB) | Nintendo | 118.69 |
4 | PlayStation 4 (PS4) | Sony | 116.97 |
5 | Nintendo Switch (NS) | Nintendo | 107.21 |
6 | PlayStation (PS) | Sony | 102.50 |
7 | Nintendo Wii (Wii) | Nintendo | 101.64 |
8 | PlayStation 3 (PS3) | Sony | 87.41 |
9 | Xbox 360 (X360) | Microsoft | 85.8 |
10 | Game Boy Advance (GBA) | Nintendo | 81.51 |
11 | PlayStation Portable (PSP) | Sony | 81.09 |
12 | Nintendo 3DS (3DS) | Nintendo | 75.95 |
13 | Nintendo Entertainment System (NES) | Nintendo | 61.91 |
14 | Xbox One (XOne) | Microsoft | 50.57 |
15 | Super Nintendo Entertainment System (SNES) | Nintendo | 49.10 |
16 | Nintendo 64 (N64) | Nintendo | 32.93 |
17 | Sega Genesis (GEN) | Sega | 29.54 |
18 | Atari 2600 (2600) | Atari | 27.64 |
19 | Xbox (XB) | Microsoft | 24.65 |
20 | GameCube (GC) | Nintendo | 21.74 |
21 | PlayStation 5 (PS5) | Sony | 19.32 |
22 | PlayStation Vita (PSV) | Sony | 16.21 |
23 | Xbox Series X/S (XS) | Microsoft | 14.32 |
24 | Nintendo Wii U (WiiU) | Nintendo | 13.97 |
25 | GameGear (GG) | Sega | 10.62 |
26 | Sega Saturn (SAT) | Sega | 8.82 |
27 | Dreamcast (DC) | Sega | 8.20 |
28 | Atari 7800 (7800) | Atari | 4.30 |
Despite the fact the PS2’s been discontinued since 2013, no other gaming console has managed to top it—in fact, the next closest actively-sold consoles, the PS4 and Nintendo Switch, are each more than 40 million units behind.
One major factor for the PS2’s success was its built-in DVD player. At the time, DVD players were very expensive, and in many places a PS2 was a cheaper and effective alternative. It was also one of the first devices to be “backward compatible,” meaning users could play most of their PS1 games on the PS2. This meant players didn’t have to buy a whole new library of games when they made the switch to a PS2, and Sony could tap into its existing customer base.
But while Sony’s PS2 is the top-selling console on the list, Nintendo has more top-selling consoles on the list—almost half of the consoles on the list are manufactured by Nintendo (11), while only seven are made by Sony.
What Will it Take to Out-Sell the PS2?
As the PS4 has started taking a backseat to the PS5 in sales and promotion, the current most-likely contender for the best-selling console crown is the Nintendo Switch. Early in 2022, it was the fastest console to sell 100 million units.
With lots of hype around the possibilities of AR and VR, it’ll be interesting to see what new features come with the next generation of gaming consoles.
Will future devices ever beat the PS2’s record-breaking sales? Time will tell. But for now, the 22-year-old console continues to hold its well-earned spot at the top.
Technology
Visualizing The 50 Biggest Data Breaches From 2004–2021
In 2021, more than 5.9 billion user records were stolen. This graphic visualizes the 50 largest data breaches, by entity and sector, since 2004.

Visualizing The 50 Biggest Data Breaches From 2004–2021
As our world has become increasingly reliant on technology and data stored online, data breaches have become an omnipresent threat to users, businesses, and government agencies. In 2021, a new record was set with more than 5.9 billion user records stolen.
This graphic by Chimdi Nwosu visualizes the 50 largest data breaches since 2004, along with the sectors most impacted. Data was aggregated from company statements and news reports.
Understanding the Basics of Data Breaches
A data breach is an incident in which sensitive or confidential information is copied, transmitted or stolen by an unauthorized entity. This can occur as a result of malware attacks, payment card fraud, insider leaks, or unintended disclosure.
The targeted data is often customer PII (personally identifiable information), employee PII, intellectual property, corporate data or government agency data.
Date breaches can be perpetrated by lone hackers, organized cybercrime groups, or even national governments. Stolen information can then be used in other criminal enterprises such as identity theft, credit card fraud, or held for ransom payment.
Notable Data Breaches Since 2004
The largest data breach recorded occurred in 2013 when all three billion Yahoo accounts had their information compromised. In that cyberattack, the hackers were able to gather the personal information and passwords of users. While the full extent of the Yahoo data breach is still not fully realized, subsequent cybercrimes across the globe have been linked to the stolen information.
Here are the 50 largest data breaches by amount of user records stolen from 2004–2021.
Rank | Entity | Sector | Records Compromised | Year |
---|---|---|---|---|
1 | Yahoo | Web | 3.0B | 2013 |
2 | River City Media | Web | 1.4B | 2017 |
3 | Aadhaar | Government | 1.1B | 2018 |
4 | First American Corporation | Finance | 885M | 2019 |
5 | Spambot | Web | 711M | 2017 |
6 | Web | 700M | 2021 | |
7 | Tech | 533M | 2021 | |
8 | Yahoo | Web | 500M | 2014 |
9 | Marriott International | Retail | 500M | 2018 |
10 | Syniverse | Telecoms | 500M | 2021 |
11 | Web | 419M | 2019 | |
12 | Friend Finder Network | Web | 412M | 2016 |
13 | OxyData | Tech | 380M | 2019 |
14 | MySpace | Web | 360M | 2016 |
15 | Exactis | Data | 340M | 2018 |
16 | Tech | 330M | 2018 | |
17 | Airtel | Telecoms | 320M | 2019 |
18 | Indian citizens | Web | 275M | 2019 |
19 | Wattpad | Web | 270M | 2020 |
20 | Microsoft | Web | 250M | 2019 |
21 | Experian Brazil | Finance | 220M | 2021 |
22 | Chinese resume leak | Web | 202M | 2019 |
23 | Court Ventures | Finance | 200M | 2013 |
24 | Apollo | Tech | 200M | 2018 |
25 | Deep Root Analytics | Web | 198M | 2015 |
26 | Zynga | Gaming | 173M | 2019 |
27 | VK | Web | 171M | 2016 |
28 | Equifax | Finance | 163M | 2017 |
29 | Dubsmash | Web | 162M | 2019 |
30 | Massive American business hack | Finance | 160M | 2013 |
31 | MyFitnessPal | App | 150M | 2018 |
32 | Ebay | Web | 145M | 2014 |
33 | Canva | Web | 139M | 2019 |
34 | Heartland | Finance | 130M | 2009 |
35 | Nametests | App | 120M | 2018 |
36 | Tetrad | Finance | 120M | 2020 |
37 | Web | 117M | 2016 | |
38 | Pakistani mobile operators | Telecoms | 115M | 2020 |
39 | ElasticSearch | Tech | 108M | 2019 |
40 | Capital One | Finance | 106M | 2019 |
41 | Thailand visitors | Government | 106M | 2021 |
42 | Firebase | App | 100M | 2018 |
43 | Quora | Web | 100M | 2018 |
44 | Rambler.ru | Web | 98M | 2012 |
45 | TK / TJ Maxx | Retail | 94M | 2007 |
46 | MyHeritage | Web | 92M | 2018 |
47 | AOL | Web | 92M | 2004 |
48 | Dailymotion | Web | 85M | 2016 |
49 | Anthem | Health | 80M | 2015 |
50 | Sony Playstation Network | Gaming | 77M | 2011 |
The massive Yahoo hack accounted for roughly 30% of the 9.9 billion user records stolen from the Web sector—by far the most impacted sector. The next most-impacted sectors were Tech and Finance, with 2 billion and 1.6 billion records stolen, respectively.
Although these three sectors had the highest totals of user data lost, that doesn’t necessarily imply they have weaker security measures. Instead, it can probably be attributed to the sheer number of user records they compile.
Not all infamous data breaches are of a large scale. A smaller data breach in 2014 made headlines when Apple’s iCloud was hacked and the personal pictures of roughly 200 celebrities were disseminated across the internet. Although this highly targeted hack only affected a few hundred people, it highlighted how invasive and damaging data breaches can be to users.
The Cost of Data Breaches to Businesses
Every year data breaches cost businesses billions of dollars to prevent and contain, while also eroding consumer trust and potentially having an adverse effect on customer retention.
A 2021 IBM security report estimated that the average cost per data breach for companies in 2020 was $4.2 million, which represents a 10% increase from 2019. That increase is mainly attributed to the added security risk associated with having more people working remotely due to the COVID-19 pandemic.
Measures to Improve Data Security
Completely preventing data breaches is essentially impossible, as cybercrime enterprises are often persistent, dynamic, and sophisticated. Nevertheless, businesses can seek out innovative methods to prevent exposure of data and mitigate potential damages.
For example, after the iCloud attack in 2014, Apple began avidly encouraging users to adopt two-factor authentication in an effort to strengthen data security.
Regardless of the measures businesses take, the unfortunate reality is that data breaches are a cost of doing business in the modern world and will continue to be a concern to both companies and users.
-
Money2 weeks ago
Mapping the Migration of the World’s Millionaires
-
Markets2 weeks ago
Visualizing the Coming Shift in Global Economic Power (2006-2036p)
-
Datastream3 weeks ago
Ranked: These Are 10 of the World’s Least Affordable Housing Markets
-
Demographics1 week ago
Mapped: A Decade of Population Growth and Decline in U.S. Counties
-
Misc3 weeks ago
Visualizing Well-Known Airlines by Fleet Composition
-
Politics4 weeks ago
Which Countries Trust Their Government, and Which Ones Don’t?
-
Markets4 weeks ago
Ranked: Visualizing the Largest Trading Partners of the U.S.
-
Misc1 week ago
Iconic Infographic Map Compares the World’s Mountains and Rivers