Energy
Mainstream EV Adoption: 5 Speedbumps to Overcome
Mainstream EV Adoption: 5 Speedbumps to Overcome
Many would agree that a global shift to electric vehicles (EV) is an important step in achieving a carbon-free future. However, for various reasons, EVs have so far struggled to break into the mainstream, accounting for just 2.5% of global auto sales in 2019.
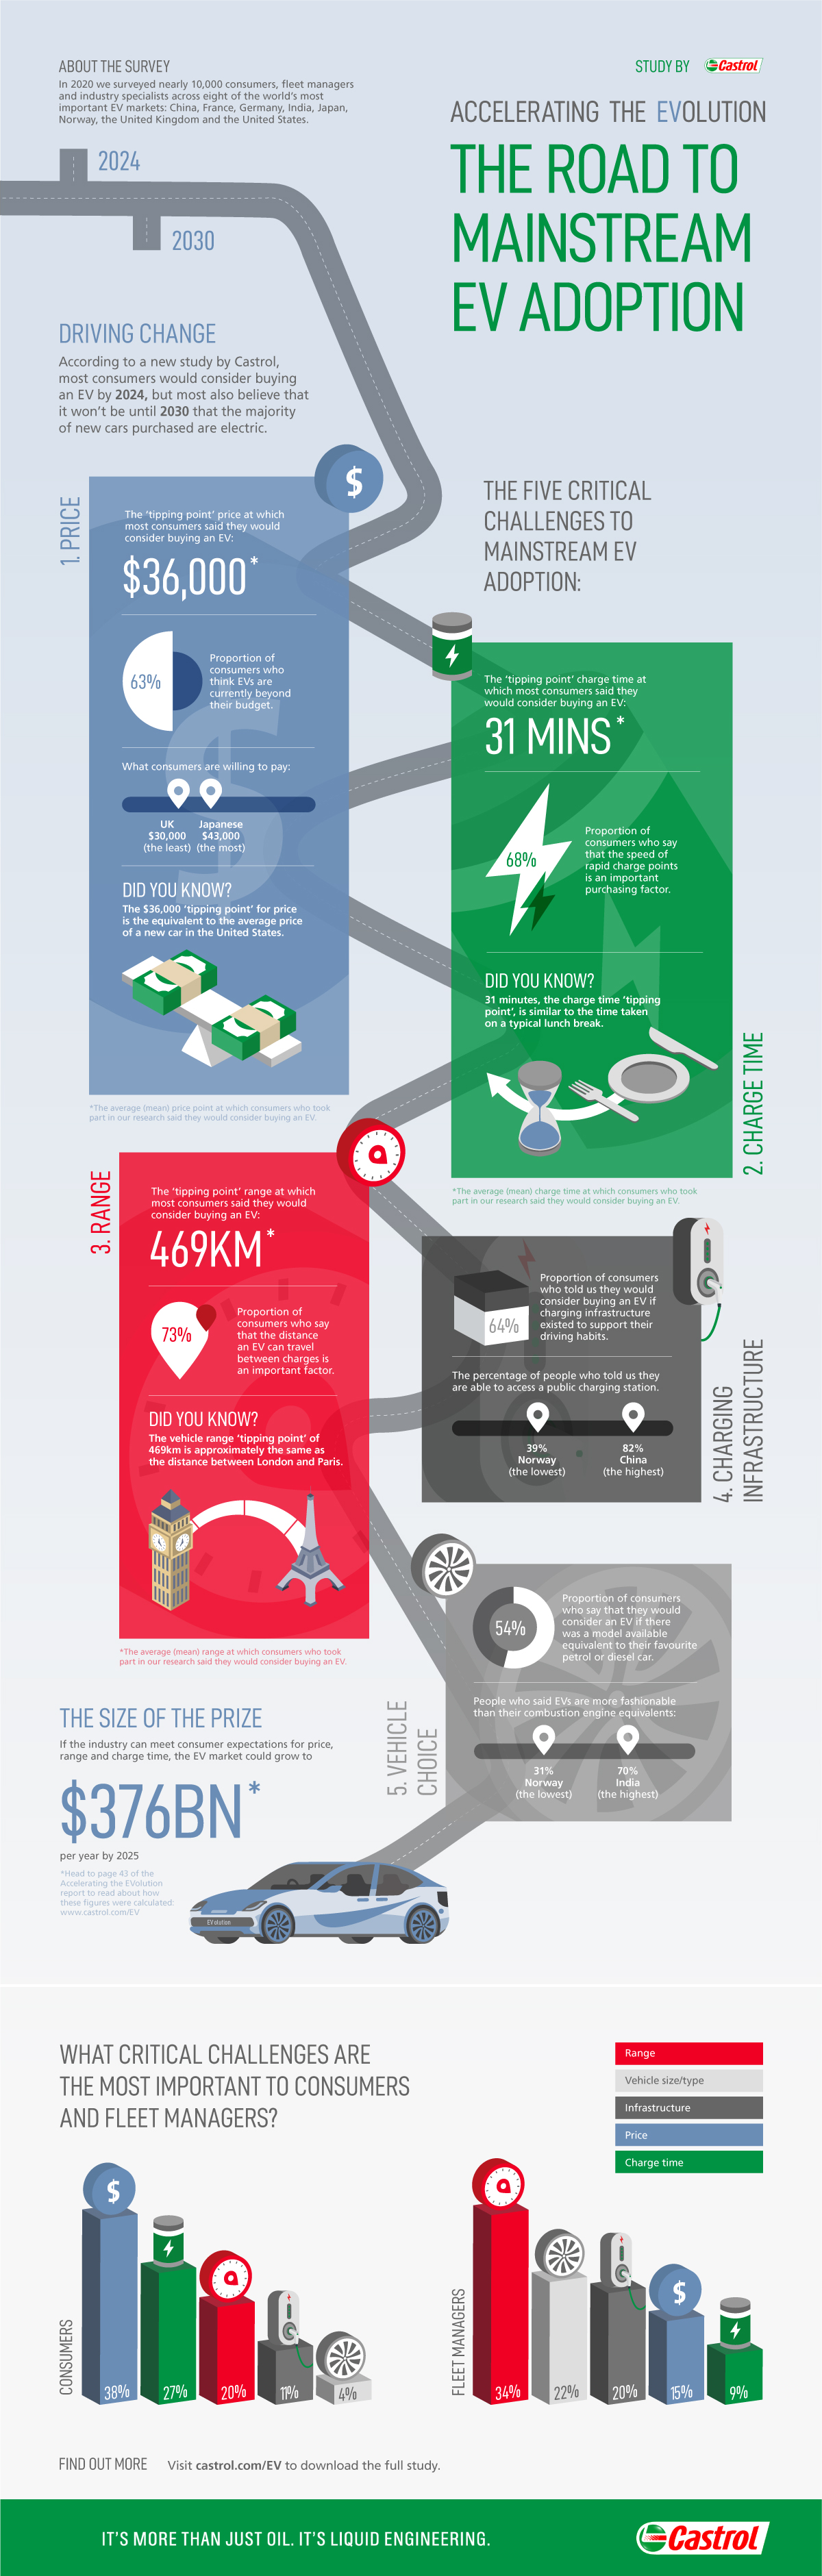
To understand why, this infographic from Castrol identifies the five critical challenges that EVs will need to overcome. All findings are based on a 2020 survey of 10,000 consumers, fleet managers, and industry specialists across eight significant EV markets.
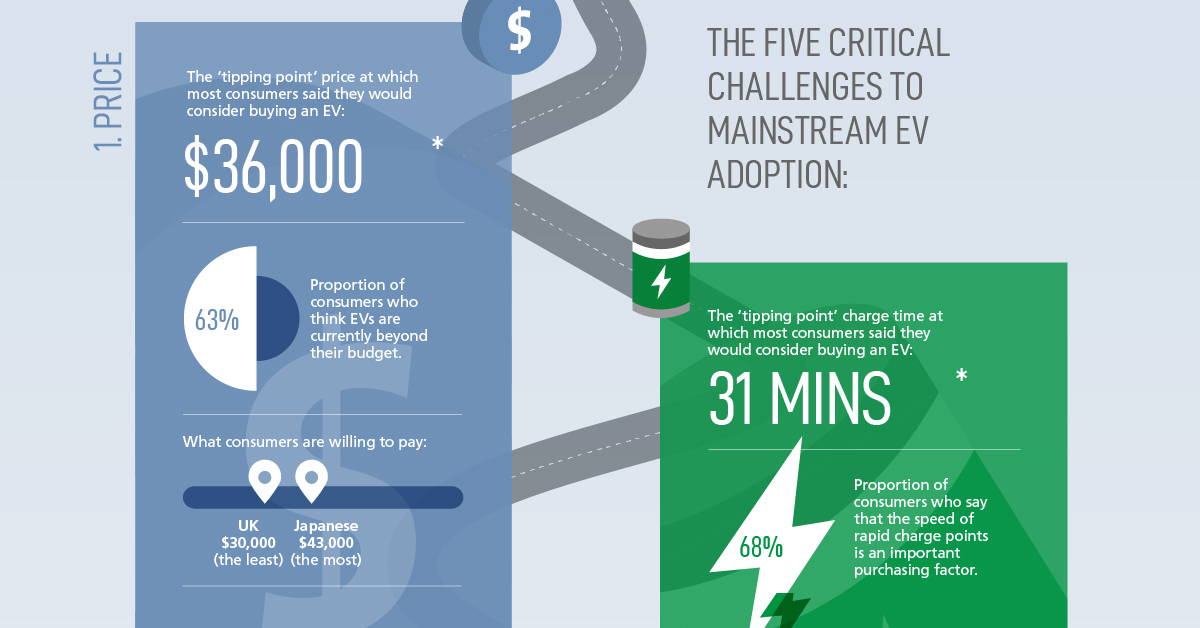
The Five Challenges to EV Adoption
Cars have relied on the internal combustion engine (ICE) since the early 1900s, and as a result, the ownership experience of an EV can be much more nuanced. This results in the five critical challenges we examine below.
Challenge #1: Price
The top challenge is price, with 63% of consumers believing that EVs are beyond their current budget. Though many cheaper EV models are being introduced, ICE vehicles still have the upper hand in terms of initial affordability. Note the emphasis on “initial”, because over the long term, EVs may actually be cheaper to maintain.
Taking into account all of the running and maintenance costs of [an EV], we have already reached relative cost parity in terms of ownership.
—President, EV consultancy, U.S.
For starters, an EV drivetrain has significantly fewer moving parts than an ICE equivalent, which could result in lower repair costs. Government subsidies and the cost of electricity are other aspects to consider.
So what is the tipping price that would convince most consumers to buy an EV? According to Castrol, it differs around the world.
| Country | EV Adoption Tipping Price ($) |
|---|---|
| 🇯🇵 Japan | $42,864 |
| 🇨🇳 China | $41,910 |
| 🇩🇪 Germany | $38,023 |
| 🇳🇴 Norway | $36,737 |
| 🇺🇸 U.S. | $35,765 |
| 🇫🇷 France | $31,820 |
| 🇮🇳 India | $30,572 |
| 🇬🇧 UK | $29,883 |
| Global Average | $35,947 |
Many budget-conscious buyers also rely on the used market, in which EVs have little presence. The rapid speed of innovation is another concern, with 57% of survey respondents citing possible depreciation as a factor that prevented them from buying an EV.
Challenge #2: Charge Time
Most ICE vehicles can be refueled in a matter of minutes, but there is much more uncertainty when it comes to charging an EV.
Using a standard home charger, it takes 10-20 hours to charge a typical EV to 80%. Even with an upgraded fast charger (3-22kW power), this could still take up to 4 hours. The good news? Next-gen charging systems capable of fully charging an EV in 20 minutes are slowly becoming available around the world.
Similar to the EV adoption tipping price, Castrol has also identified a charge time tipping point—the charge time required for mainstream EV adoption.
| Country | Charge Time Tipping Point (minutes) |
|---|---|
| 🇮🇳 India | 35 |
| 🇨🇳 China | 34 |
| 🇺🇸 U.S. | 30 |
| 🇬🇧 UK | 30 |
| 🇳🇴 Norway | 29 |
| 🇩🇪 Germany | 29 |
| 🇯🇵 Japan | 29 |
| 🇫🇷 France | 27 |
| Global Average | 31 |
If the industry can achieve an average 31 minute charge time, EVs could reach $224 billion in annual revenues across these eight markets alone.
Challenge #3: Range
Over 70% of consumers rank the total range of an EV as being important to them. However, today’s affordable EV models (below the average tipping price of $35,947) all have ranges that fall under 200 miles.
Traditional gas-powered vehicles, on the other hand, typically have a range between 310-620 miles. While Tesla offers several models boasting a 300+ mile range, their purchase prices are well above the average tipping price.
For the majority of consumers to consider an EV, the following range requirements will need to be met by vehicle manufacturers.
| Country | Range Tipping Point (miles) |
|---|---|
| 🇺🇸 U.S. | 321 |
| 🇳🇴 Norway | 315 |
| 🇨🇳 China | 300 |
| 🇩🇪 Germany | 293 |
| 🇫🇷 France | 289 |
| 🇯🇵 Japan | 283 |
| 🇬🇧 UK | 283 |
| 🇮🇳 India | 249 |
| Global Average | 291 |
Fleet managers, those who oversee vehicles for services such as deliveries, reported a higher average EV tipping range of 341 miles.
Challenge #4: Charging Infrastructure
Charging infrastructure is the fourth most critical challenge, with 64% of consumers saying they would consider an EV if charging was convenient.
Similar to charge times, there is much uncertainty surrounding infrastructure. For example, 65% of consumers living in urban areas have a charging point within 5 miles of their home, compared to just 26% for those in rural areas.
Significant investment in public charging infrastructure will be necessary to avoid bottlenecks as more people adopt EVs. China is a leader in this regard, with billions spent on EV infrastructure projects. The result is a network of over one million charging stations, providing 82% of Chinese consumers with convenient access.
Challenge #5: Vehicle Choice
The least important challenge is increasing the variety of EV models available. This issue is unlikely to persist for long, as industry experts believe 488 unique models will exist by 2025.
Despite variety being less influential than charge times or range, designing models that appeal to various consumer niches will likely help to accelerate EV adoption. Market research will be required, however, because attitudes towards EVs vary by country.
| Country | Consumers Who Believe EVs Are More Fashionable Than ICE Vehicles (%) |
|---|---|
| 🇮🇳 India | 70% |
| 🇨🇳 China | 68% |
| 🇫🇷 France | 46% |
| 🇩🇪 Germany | 40% |
| 🇬🇧 UK | 40% |
| 🇯🇵 Japan | 39% |
| 🇺🇸 U.S. | 33% |
| 🇳🇴 Norway | 31% |
| Global Average | 48% |
A majority of Chinese and Indian consumers view EVs more favorably than traditional ICE vehicles. This could be the result of a lower familiarity with cars in general—in 2000, for example, China had just four million cars spread across its population of over one billion.
EVs are the least alluring in the U.S. and Norway, which coincidentally have the highest GDP per capita among the eight countries surveyed. These consumers may be accustomed to a higher standard of quality as a result of their greater relative wealth.
So When Do EVs Become Mainstream?
As prices fall and capabilities improve, Castrol predicts a majority of consumers will consider buying an EV by 2024. Global mainstream adoption could take slightly longer, arriving in 2030.
Caution should be exhibited, as these estimates rely on the five critical challenges being solved in the short-term future. This hinges on a number of factors, including technological change, infrastructure investment, and a shift in consumer attitudes.
New challenges could also arise further down the road. EVs require a significant amount of minerals such as copper and lithium, and a global increase in production could put strain on the planet’s limited supply.


Energy
Charted: 4 Reasons Why Lithium Could Be the Next Gold Rush
Visual Capitalist has partnered with EnergyX to show why drops in prices and growing demand may make now the right time to invest in lithium.


4 Reasons Why You Should Invest in Lithium
Lithium’s importance in powering EVs makes it a linchpin of the clean energy transition and one of the world’s most precious minerals.
In this graphic, Visual Capitalist partnered with EnergyX to explore why now may be the time to invest in lithium.
1. Lithium Prices Have Dropped
One of the most critical aspects of evaluating an investment is ensuring that the asset’s value is higher than its price would indicate. Lithium is integral to powering EVs, and, prices have fallen fast over the last year:
| Date | LiOH·H₂O* | Li₂CO₃** |
|---|---|---|
| Feb 2023 | $76 | $71 |
| March 2023 | $71 | $61 |
| Apr 2023 | $43 | $33 |
| May 2023 | $43 | $33 |
| June 2023 | $47 | $45 |
| July 2023 | $44 | $40 |
| Aug 2023 | $35 | $35 |
| Sept 2023 | $28 | $27 |
| Oct 2023 | $24 | $23 |
| Nov 2023 | $21 | $21 |
| Dec 2023 | $17 | $16 |
| Jan 2024 | $14 | $15 |
| Feb 2024 | $13 | $14 |
Note: Monthly spot prices were taken as close to the 14th of each month as possible.
*Lithium hydroxide monohydrate MB-LI-0033
**Lithium carbonate MB-LI-0029
2. Lithium-Ion Battery Prices Are Also Falling
The drop in lithium prices is just one reason to invest in the metal. Increasing economies of scale, coupled with low commodity prices, have caused the cost of lithium-ion batteries to drop significantly as well.
In fact, BNEF reports that between 2013 and 2023, the price of a Li-ion battery dropped by 82%.
| Year | Price per KWh |
|---|---|
| 2023 | $139 |
| 2022 | $161 |
| 2021 | $150 |
| 2020 | $160 |
| 2019 | $183 |
| 2018 | $211 |
| 2017 | $258 |
| 2016 | $345 |
| 2015 | $448 |
| 2014 | $692 |
| 2013 | $780 |

3. EV Adoption is Sustainable
One of the best reasons to invest in lithium is that EVs, one of the main drivers behind the demand for lithium, have reached a price point similar to that of traditional vehicle.
According to the Kelly Blue Book, Tesla’s average transaction price dropped by 25% between 2022 and 2023, bringing it in line with many other major manufacturers and showing that EVs are a realistic transport option from a consumer price perspective.
| Manufacturer | September 2022 | September 2023 |
|---|---|---|
| BMW | $69,000 | $72,000 |
| Ford | $54,000 | $56,000 |
| Volkswagon | $54,000 | $56,000 |
| General Motors | $52,000 | $53,000 |
| Tesla | $68,000 | $51,000 |
4. Electricity Demand in Transport is Growing
As EVs become an accessible transport option, there’s an investment opportunity in lithium. But possibly the best reason to invest in lithium is that the IEA reports global demand for the electricity in transport could grow dramatically by 2030:
| Transport Type | 2022 | 2025 | 2030 |
|---|---|---|---|
| Buses 🚌 | 23,000 GWh | 50,000 GWh | 130,000 GWh |
| Cars 🚙 | 65,000 GWh | 200,000 GWh | 570,000 GWh |
| Trucks 🛻 | 4,000 GWh | 15,000 GWh | 94,000 GWh |
| Vans 🚐 | 6,000 GWh | 16,000 GWh | 72,000 GWh |
The Lithium Investment Opportunity
Lithium presents a potentially classic investment opportunity. Lithium and battery prices have dropped significantly, and recently, EVs have reached a price point similar to other vehicles. By 2030, the demand for clean energy, especially in transport, will grow dramatically.
With prices dropping and demand skyrocketing, now is the time to invest in lithium.
EnergyX is poised to exploit lithium demand with cutting-edge lithium extraction technology capable of extracting 300% more lithium than current processes.

-

 Lithium4 days ago
Ranked: The Top 10 EV Battery Manufacturers in 2023
Asia dominates this ranking of the world’s largest EV battery manufacturers in 2023.
-

 Energy1 week ago
The World’s Biggest Nuclear Energy Producers
China has grown its nuclear capacity over the last decade, now ranking second on the list of top nuclear energy producers.
-

 Energy1 month ago
The World’s Biggest Oil Producers in 2023
Just three countries accounted for 40% of global oil production last year.
-

 Energy1 month ago
How Much Does the U.S. Depend on Russian Uranium?
Currently, Russia is the largest foreign supplier of nuclear power fuel to the U.S.
-

 Uranium2 months ago
Charted: Global Uranium Reserves, by Country
We visualize the distribution of the world’s uranium reserves by country, with 3 countries accounting for more than half of total reserves.
-

 Energy3 months ago
Visualizing the Rise of the U.S. as Top Crude Oil Producer
Over the last decade, the United States has established itself as the world’s top producer of crude oil, surpassing Saudi Arabia and Russia.


-

 Debt1 week ago
How Debt-to-GDP Ratios Have Changed Since 2000
-

 Markets2 weeks ago
Ranked: The World’s Top Flight Routes, by Revenue
-

 Countries2 weeks ago
Population Projections: The World’s 6 Largest Countries in 2075
-

 Markets2 weeks ago
The Top 10 States by Real GDP Growth in 2023
-

 Demographics2 weeks ago
The Smallest Gender Wage Gaps in OECD Countries
-

 United States2 weeks ago
Where U.S. Inflation Hit the Hardest in March 2024
-

 Green2 weeks ago
Top Countries By Forest Growth Since 2001
-

 United States2 weeks ago
Ranked: The Largest U.S. Corporations by Number of Employees