Misc
Ranked: The 50 Most Popular Fast Food Chains in America


The 50 Most Popular Fast Food Chains in America
Millions of Americans eat at fast food restaurants every day—and they now have more options at their disposal than ever before.
From burgers to pad thai, there’s a quick service restaurant that’ll satisfy almost any appetite. With all this choice, which fast food chains are the most popular among consumers?
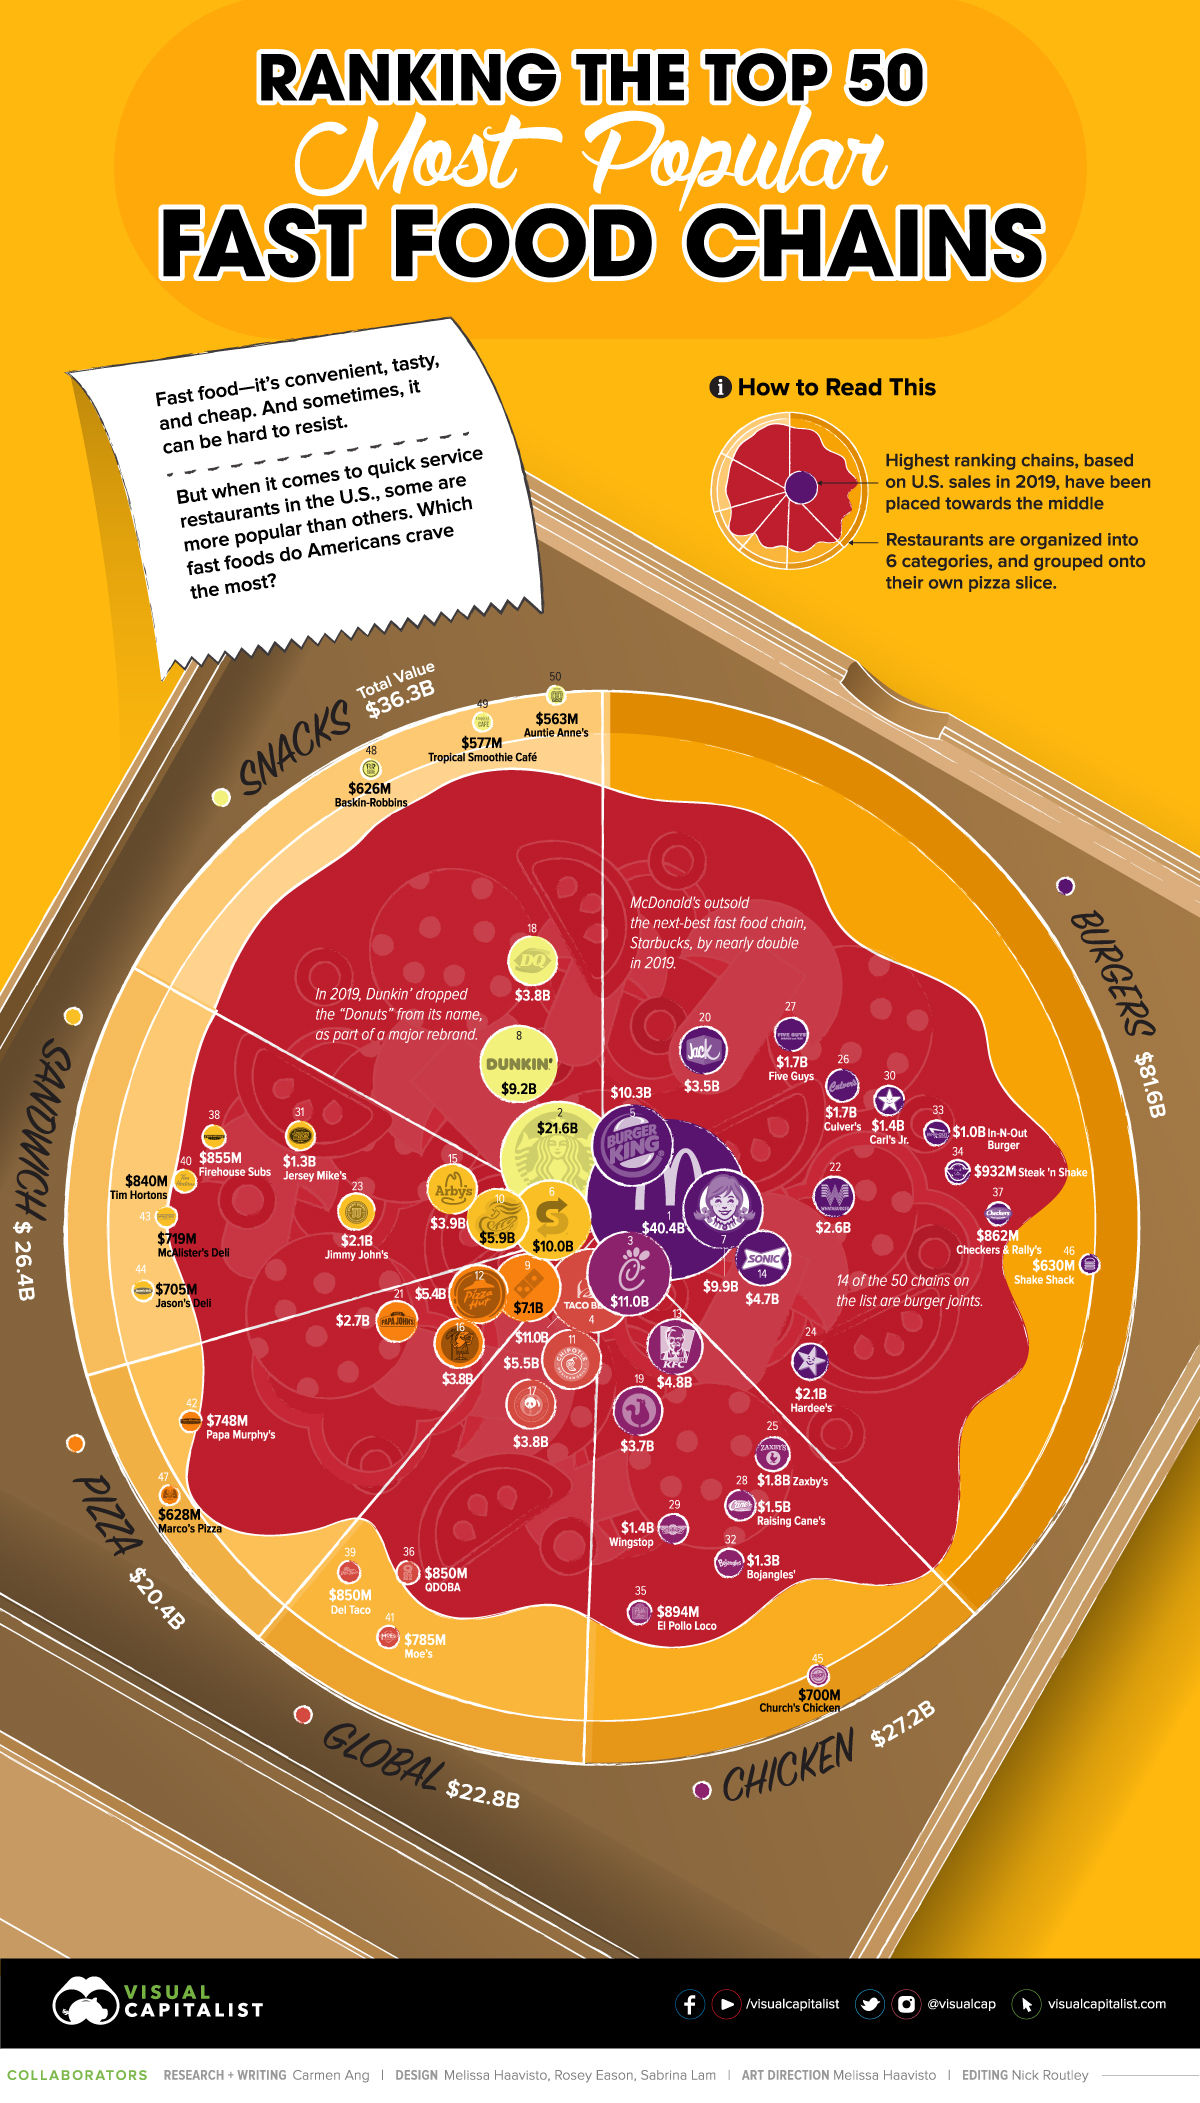
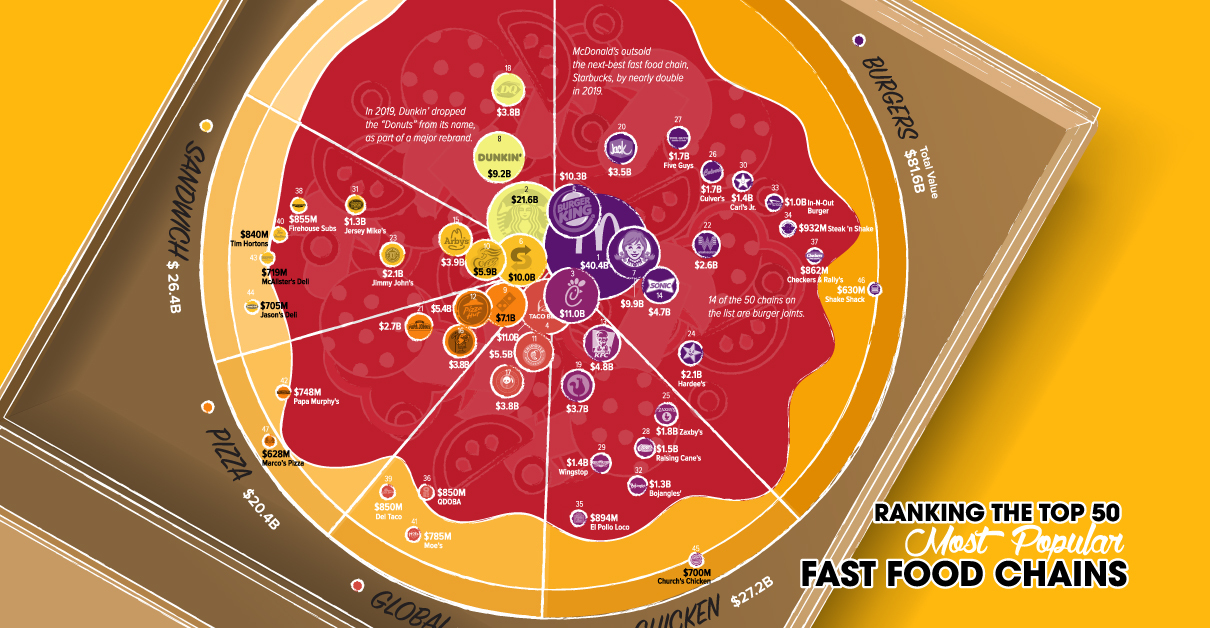
Using data from QSR Magazine, today’s infographic ranks the top 50 largest fast food chains in the U.S. by sales in 2019, providing insight into the types of foods Americans have been craving.
Fast Food Chains Ranked, by Revenue
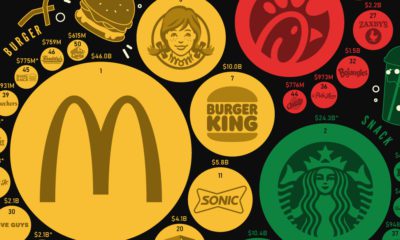
In 2019, the 50 largest fast food chains in the U.S. generated over $200 billion in revenue. How do these quick service giants stack up against each other?
| Rank | Company | Category | U.S. Sales, Billions (2019) |
|---|---|---|---|
| 1 | McDonald's | Burger | $40.41 |
| 2 | Starbucks | Snack | $21.55 |
| 3 | Chick-fil-A | Chicken | $11.00 |
| 4 | Taco Bell | Global | $11.00 |
| 5 | Burger King | Burger | $10.30 |
| 6 | Subway | Sandwich | $10.00 |
| 7 | Wendy's | Burger | $9.87 |
| 8 | Dunkin' | Snack | $9.22 |
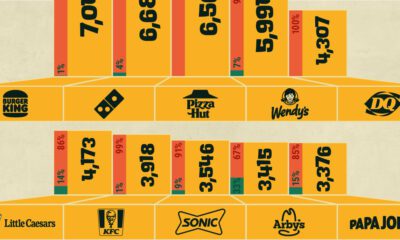
| 9 | Domino's | Pizza | $7.10 |
| 10 | Panera Bread | Sandwich | $5.93 |
| 11 | Chipotle | Global | $5.52 |
| 12 | Pizza Hut | Pizza | $5.38 |
| 13 | KFC | Chicken | $4.82 |
| 14 | Sonic Drive-In | Burger | $4.69 |
| 15 | Arby's | Sandwich | $3.89 |
| 16 | Little Caesars | Pizza | $3.85 |
| 17 | Panda Express | Global | $3.80 |
| 18 | Dairy Queen | Snack | $3.76 |
| 19 | Popeyes Louisiana Kitchen | Chicken | $3.75 |
| 20 | Jack in the Box | Burger | $3.51 |
| 21 | Papa John's | Pizza | $2.66 |
| 22 | Whataburger | Burger | $2.56 |
| 23 | Jimmy John's | Sandwich | $2.11 |
| 24 | Hardee's | Burger | $2.07 |
| 25 | Zaxby's | Chicken | $1.84 |
| 26 | Culver's | Burger | $1.73 |
| 27 | Five Guys | Burger | $1.66 |
| 28 | Raising Cane's | Chicken | $1.47 |
| 29 | Wingstop | Chicken | $1.40 |
| 30 | Carl's Jr. | Burger | $1.39 |
| 31 | Jersey Mike's | Sandwich | $1.34 |
| 32 | Bojangles' | Chicken | $1.29 |
| 33 | In-N-Out Burger | Burger | $1.00 |
| 34 | Steak 'n Shake | Burger | $0.93 |
| 35 | El Pollo Loco | Chicken | $0.89 |
| 36 | QDOBA | Global | $0.85 |
| 37 | Checkers/Rally's | Burger | $0.86 |
| 38 | Firehouse Subs | Sandwich | $0.86 |
| 39 | Del Taco | Global | $0.85 |
| 40 | Tim Hortons | Sandwich | $0.84 |
| 41 | Moe's | Global | $0.79 |
| 42 | Papa Murphy's | Pizza | $0.75 |
| 43 | McAlister's Deli | Sandwich | $0.72 |
| 44 | Jason's Deli | Sandwich | $0.71 |
| 45 | Church's Chicken | Chicken | $0.70 |
| 46 | Shake Shack | Burger | $0.63 |
| 47 | Marco's Pizza | Pizza | $0.63 |
| 48 | Baskin-Robbins | Snack | $0.63 |
| 49 | Tropical Smoothie Café | Snack | $0.58 |
| 50 | Auntie Anne's | Snack | $0.56 |
Unsurprisingly, McDonald’s comes in at number one with over $40 billion in sales. Despite a scandal involving its former CEO, McDonald’s still managed to significantly outsell its peers—the company made almost double that of the second-largest fast food chain, Starbucks.
But don’t worry, Starbucks did just fine for itself. With $21 billion in sales, the Seattle-based coffee chain saw a 5% increase compared to its numbers in 2018.
Top Selling Fast Food Categories
Based on the ranking, it’s clear that Americans still love their McDonald’s. But are burgers, in general, the most popular fast food item?
In short—yes. Burgers are king. Here’s a look at how burgers, pizza, chicken, and other food categories measure up:
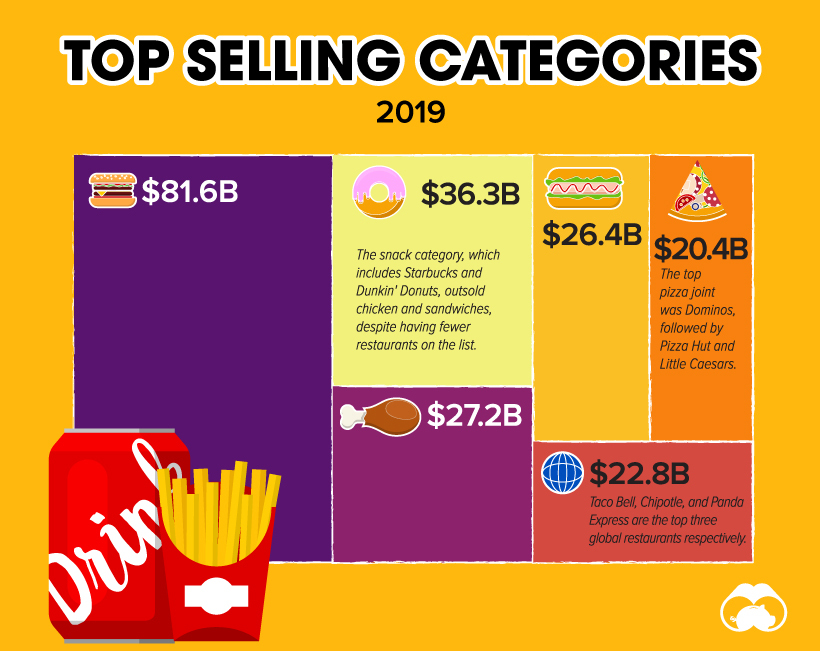
Burger joints remain the most popular fast food option among consumers—14 of the 50 chains on the list are classified as burger restaurants, with $80 billion in collective sales.
Snacks come in at second place, with a total of $36 billion in revenue. Boasting a broad variety of foods from iced coffee to donuts and ice cream, six of the restaurants on the list are included in this category. Starbucks is the most popular, followed by Dunkin’ and Dairy Queen respectively.
While the chicken and sandwich categories both have nine restaurants included in the ranking, chicken restaurants outsold sandwiches by almost $1 billion. This is largely due to Chick-fil-A, which makes up more than a third of all chicken restaurant sales included in the ranking.
COVID Closures
It’s important to note that these numbers reflect the fast food industry before the devastating impacts of COVID-19. The global pandemic has forced many fast food restaurants to adapt, and it’s also triggered a number of restaurant shutdowns.
For instance, McDonald’s is set to permanently close 200 of its 14,000 U.S. locations, and Dunkin’ will be closing 450 restaurants by the end of 2020. Starbucks has also announced it’s planning to permanently shut down up to 400 locations by mid-2021.
With online sales more important than ever, the chains with a strong digital presence may be in a better position to weather the storm. Chains with physical distancing options, such as drive-throughs, could also recover quicker.


Misc
How Hard Is It to Get Into an Ivy League School?
We detail the admission rates and average annual cost for Ivy League schools, as well as the median SAT scores required to be accepted.


How Hard Is It to Get Into an Ivy League School?
This was originally posted on our Voronoi app. Download the app for free on iOS or Android and discover incredible data-driven charts from a variety of trusted sources.
Ivy League institutions are renowned worldwide for their academic excellence and long-standing traditions. But how hard is it to get into one of the top universities in the U.S.?
In this graphic, we detail the admission rates and average annual cost for Ivy League schools, as well as the median SAT scores required to be accepted. The data comes from the National Center for Education Statistics and was compiled by 24/7 Wall St.
Note that “average annual cost” represents the net price a student pays after subtracting the average value of grants and/or scholarships received.
Harvard is the Most Selective
The SAT is a standardized test commonly used for college admissions in the United States. It’s taken by high school juniors and seniors to assess their readiness for college-level academic work.
When comparing SAT scores, Harvard and Dartmouth are among the most challenging universities to gain admission to. The median SAT scores for their students are 760 for reading and writing and 790 for math. Still, Harvard has half the admission rate (3.2%) compared to Dartmouth (6.4%).
| School | Admission rate (%) | SAT Score: Reading & Writing | SAT Score: Math | Avg Annual Cost* |
|---|---|---|---|---|
| Harvard University | 3.2 | 760 | 790 | $13,259 |
| Columbia University | 3.9 | 750 | 780 | $12,836 |
| Yale University | 4.6 | 760 | 780 | $16,341 |
| Brown University | 5.1 | 760 | 780 | $26,308 |
| Princeton University | 5.7 | 760 | 780 | $11,080 |
| Dartmouth College | 6.4 | 760 | 790 | $33,023 |
| University of Pennsylvania | 6.5 | 750 | 790 | $14,851 |
| Cornell University | 7.5 | 750 | 780 | $29,011 |
*Costs after receiving federal financial aid.
Additionally, Dartmouth has the highest average annual cost at $33,000. Princeton has the lowest at $11,100.
While student debt has surged in the United States in recent years, hitting $1.73 trillion in 2023, the worth of obtaining a degree from any of the schools listed surpasses mere academics. This is evidenced by the substantial incomes earned by former students.
Harvard grads, for example, have the highest average starting salary in the country, at $91,700.

-

 Real Estate2 weeks ago
Visualizing America’s Shortage of Affordable Homes
-

 Technology1 week ago
Ranked: Semiconductor Companies by Industry Revenue Share
-

 Money1 week ago
Which States Have the Highest Minimum Wage in America?
-

 Real Estate1 week ago
Ranked: The Most Valuable Housing Markets in America
-

 Business2 weeks ago
Charted: Big Four Market Share by S&P 500 Audits
-

 AI2 weeks ago
The Stock Performance of U.S. Chipmakers So Far in 2024
-

 Misc2 weeks ago
Almost Every EV Stock is Down After Q1 2024
-

 Money2 weeks ago
Where Does One U.S. Tax Dollar Go?