Technology
Why the Spotify IPO is Both Unusual and Intriguing
Why the Spotify IPO is Both Unusual and Intriguing
The Chart of the Week is a weekly Visual Capitalist feature on Fridays.
On April 3, 2018, the music streaming service Spotify is expected to hit the public markets for the first time.
However, while IPOs are usually large, hype-driven spectacles that involve investment bankers and roadshows to financial institutions, the Spotify IPO is taking quite a different route. For a variety of reasons, this will make the Spotify IPO both an unusual and intriguing event for investors.
Here’s what’s interesting about the impending listing of the Sweden-based unicorn.
1. A Rare Breed
Despite the tech IPO being a legendary exit strategy among startup founders and venture capitalists, the reality is that today tech IPOs are few and far between.
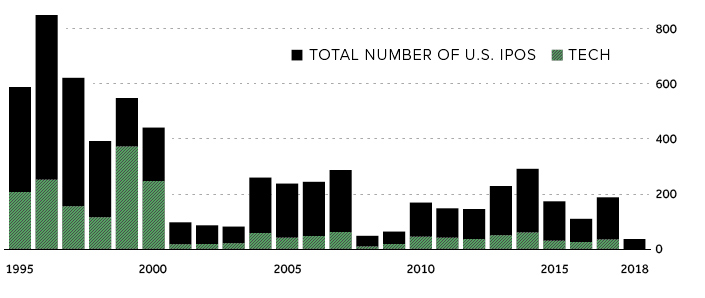
By the same token, IPOs are also traditionally a way for investors to get a handle on market sentiment. With fewer tech IPOs on the books, it means that investors will look even closer to the Spotify IPO to try and gauge market frothiness.
2. An Unusual Listing
However, the Spotify IPO is not conventional in any respect.
The company was forced to IPO as a result of an impending deadline that would have entitled existing holders of convertible debt the option to “unwind” their transactions and get new convertible notes.
Further, the IPO uses an unconventional route to market – instead of the traditional investment bank and roadshow, Spotify is direct-listing its shares on the market from the pockets of existing shareholders. Based on current valuations, Spotify is the largest and highest-profile company to ever try this approach on an exchange in the United States.
On the plus side, Spotify reduces its costs by going this route. On the negative, it could lead to more volatility.
For better or worse, direct-listing shares places the company’s fate solely in the hands of John Q. Public.
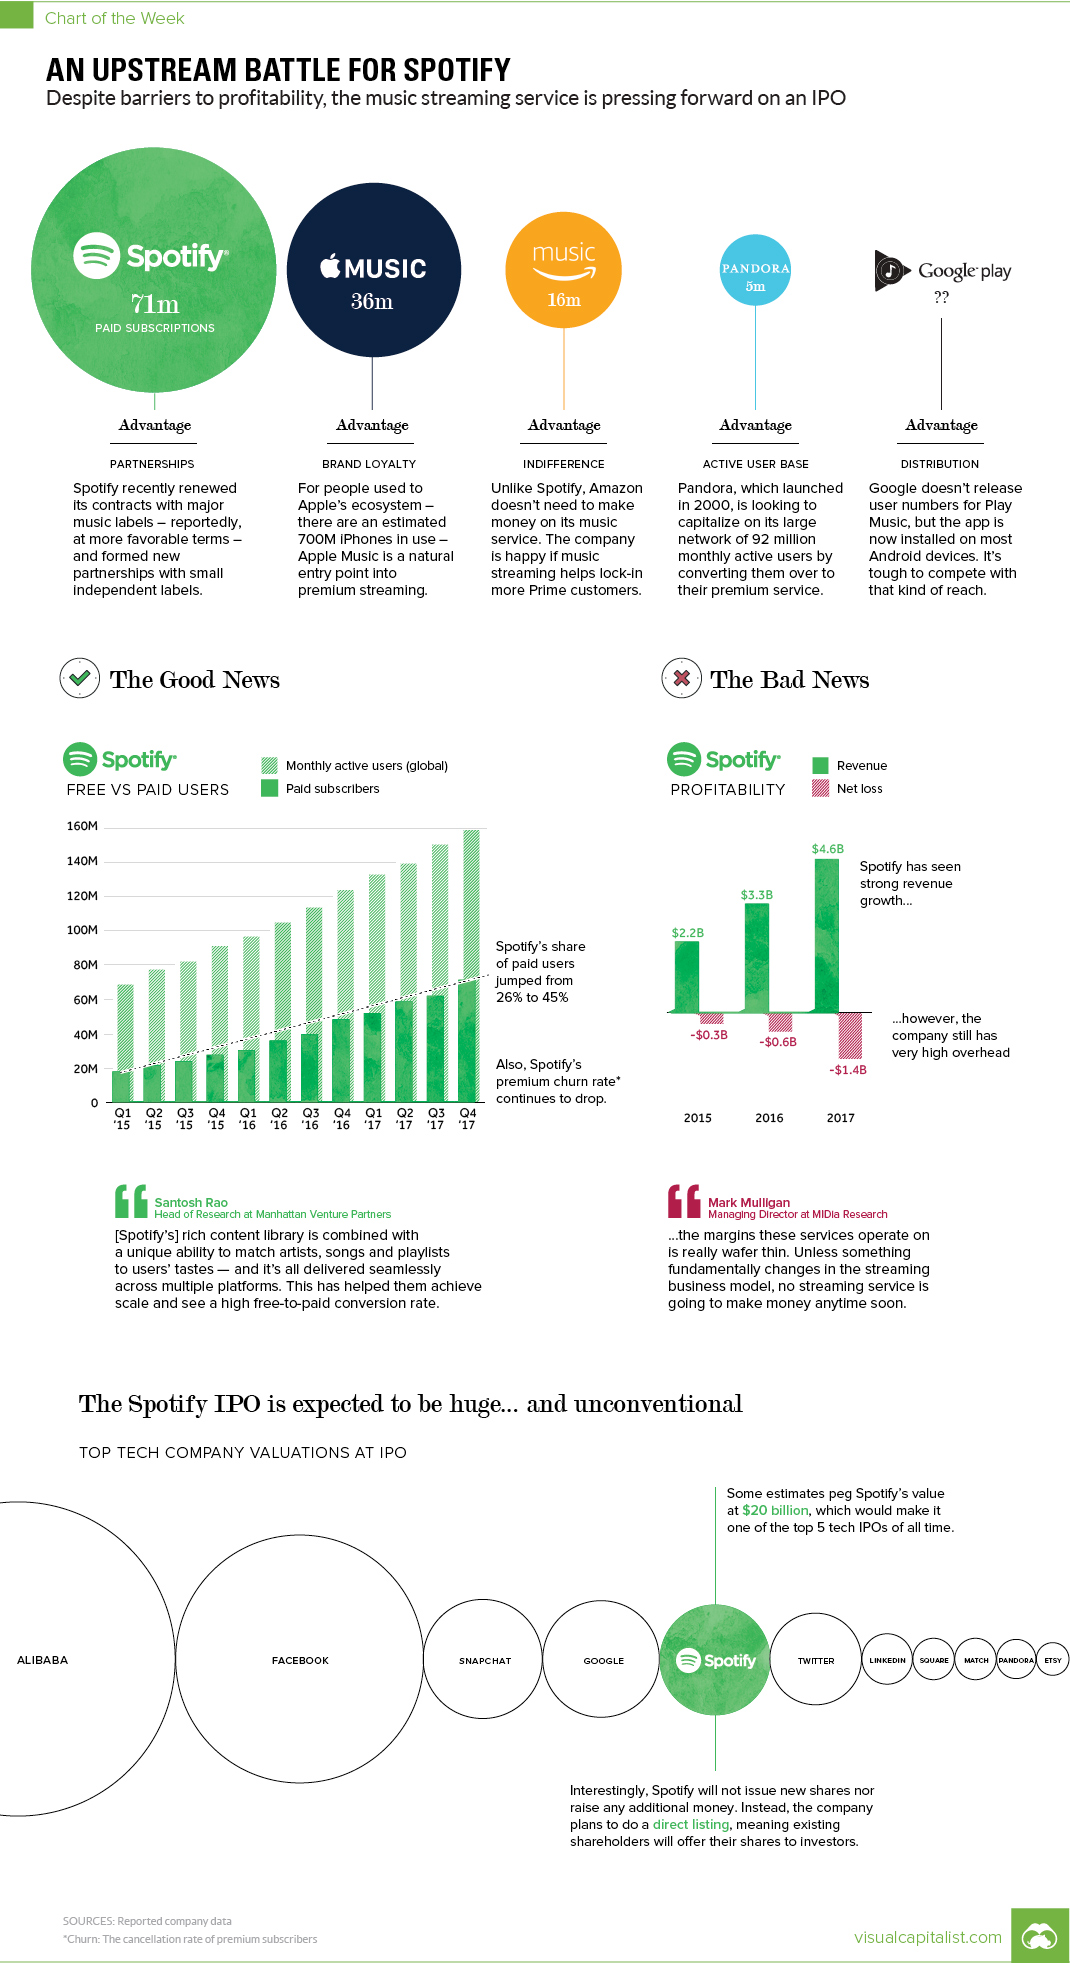
3. An Upstream Battle
In 2017, Spotify shares sold for a vast range that places the company’s valuation somewhere between $6.3 billion to $20.9 billion. In a more recent private transaction, it put the valuation at closer to $23 billion.
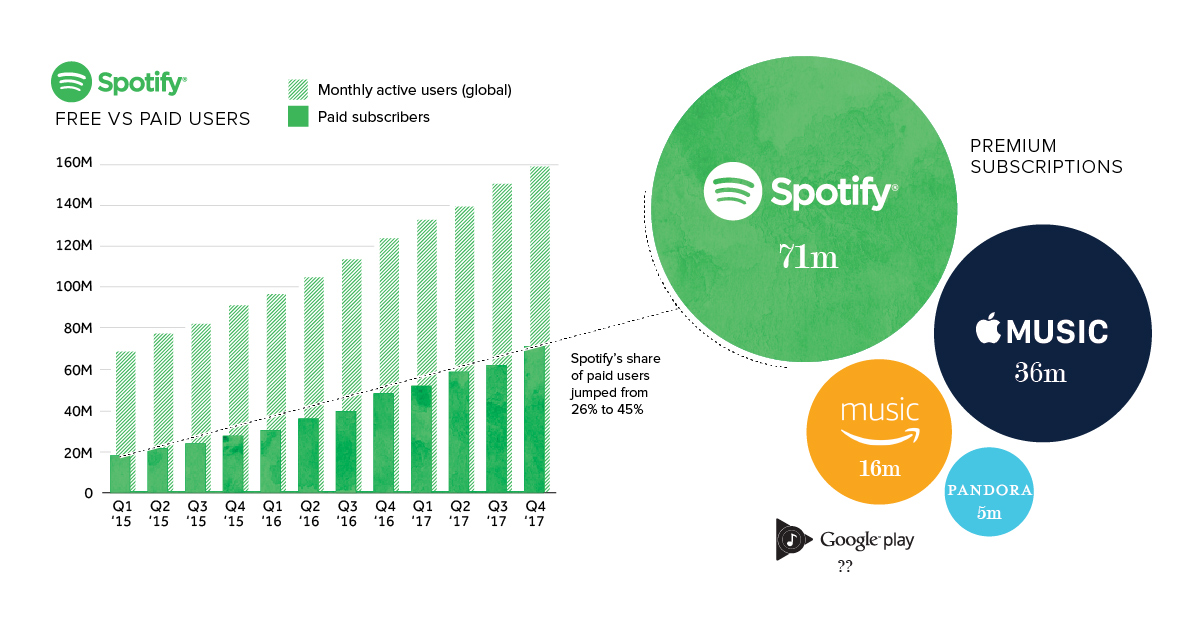
If the company IPOs at $20 billion, as some experts expect, it’d make the Spotify IPO one of the five biggest tech listings of all-time. However, as today’s chart shows, the company still faces many challenges.
Apple, Amazon, Google, and Pandora will all remain fierce competitors, each with distinct advantages in the music market. Further, while Spotify has seen strong revenue growth, it’s also seen growing losses – and industry experts question whether the slim margins will ever amount to anything significant.
If Spotify can wrangle control of the music market and squeeze out better margins, while keeping its current growth trajectory, the Spotify IPO will be one to remember for a long time.


Technology
All of the Grants Given by the U.S. CHIPS Act
Intel, TSMC, and more have received billions in subsidies from the U.S. CHIPS Act in 2024.


All of the Grants Given by the U.S. CHIPS Act
This was originally posted on our Voronoi app. Download the app for free on iOS or Android and discover incredible data-driven charts from a variety of trusted sources.
This visualization shows which companies are receiving grants from the U.S. CHIPS Act, as of April 25, 2024. The CHIPS Act is a federal statute signed into law by President Joe Biden that authorizes $280 billion in new funding to boost domestic research and manufacturing of semiconductors.
The grant amounts visualized in this graphic are intended to accelerate the production of semiconductor fabrication plants (fabs) across the United States.
Data and Company Highlights
The figures we used to create this graphic were collected from a variety of public news sources. The Semiconductor Industry Association (SIA) also maintains a tracker for CHIPS Act recipients, though at the time of writing it does not have the latest details for Micron.
| Company | Federal Grant Amount | Anticipated Investment From Company |
|---|---|---|
| 🇺🇸 Intel | $8,500,000,000 | $100,000,000,000 |
| 🇹🇼 TSMC | $6,600,000,000 | $65,000,000,000 |
| 🇰🇷 Samsung | $6,400,000,000 | $45,000,000,000 |
| 🇺🇸 Micron | $6,100,000,000 | $50,000,000,000 |
| 🇺🇸 GlobalFoundries | $1,500,000,000 | $12,000,000,000 |
| 🇺🇸 Microchip | $162,000,000 | N/A |
| 🇬🇧 BAE Systems | $35,000,000 | N/A |
BAE Systems was not included in the graphic due to size limitations
Intel’s Massive Plans
Intel is receiving the largest share of the pie, with $8.5 billion in grants (plus an additional $11 billion in government loans). This grant accounts for 22% of the CHIPS Act’s total subsidies for chip production.
From Intel’s side, the company is expected to invest $100 billion to construct new fabs in Arizona and Ohio, while modernizing and/or expanding existing fabs in Oregon and New Mexico. Intel could also claim another $25 billion in credits through the U.S. Treasury Department’s Investment Tax Credit.
TSMC Expands its U.S. Presence
TSMC, the world’s largest semiconductor foundry company, is receiving a hefty $6.6 billion to construct a new chip plant with three fabs in Arizona. The Taiwanese chipmaker is expected to invest $65 billion into the project.
The plant’s first fab will be up and running in the first half of 2025, leveraging 4 nm (nanometer) technology. According to TrendForce, the other fabs will produce chips on more advanced 3 nm and 2 nm processes.
The Latest Grant Goes to Micron
Micron, the only U.S.-based manufacturer of memory chips, is set to receive $6.1 billion in grants to support its plans of investing $50 billion through 2030. This investment will be used to construct new fabs in Idaho and New York.

-

 Debt1 week ago
How Debt-to-GDP Ratios Have Changed Since 2000
-

 Markets2 weeks ago
Ranked: The World’s Top Flight Routes, by Revenue
-

 Countries2 weeks ago
Population Projections: The World’s 6 Largest Countries in 2075
-

 Markets2 weeks ago
The Top 10 States by Real GDP Growth in 2023
-

 Demographics2 weeks ago
The Smallest Gender Wage Gaps in OECD Countries
-

 United States2 weeks ago
Where U.S. Inflation Hit the Hardest in March 2024
-

 Green2 weeks ago
Top Countries By Forest Growth Since 2001
-

 United States2 weeks ago
Ranked: The Largest U.S. Corporations by Number of Employees