Technology
Here’s What Happens Every Minute on the Internet in 2020
What Happens Every Minute on the Internet in 2020
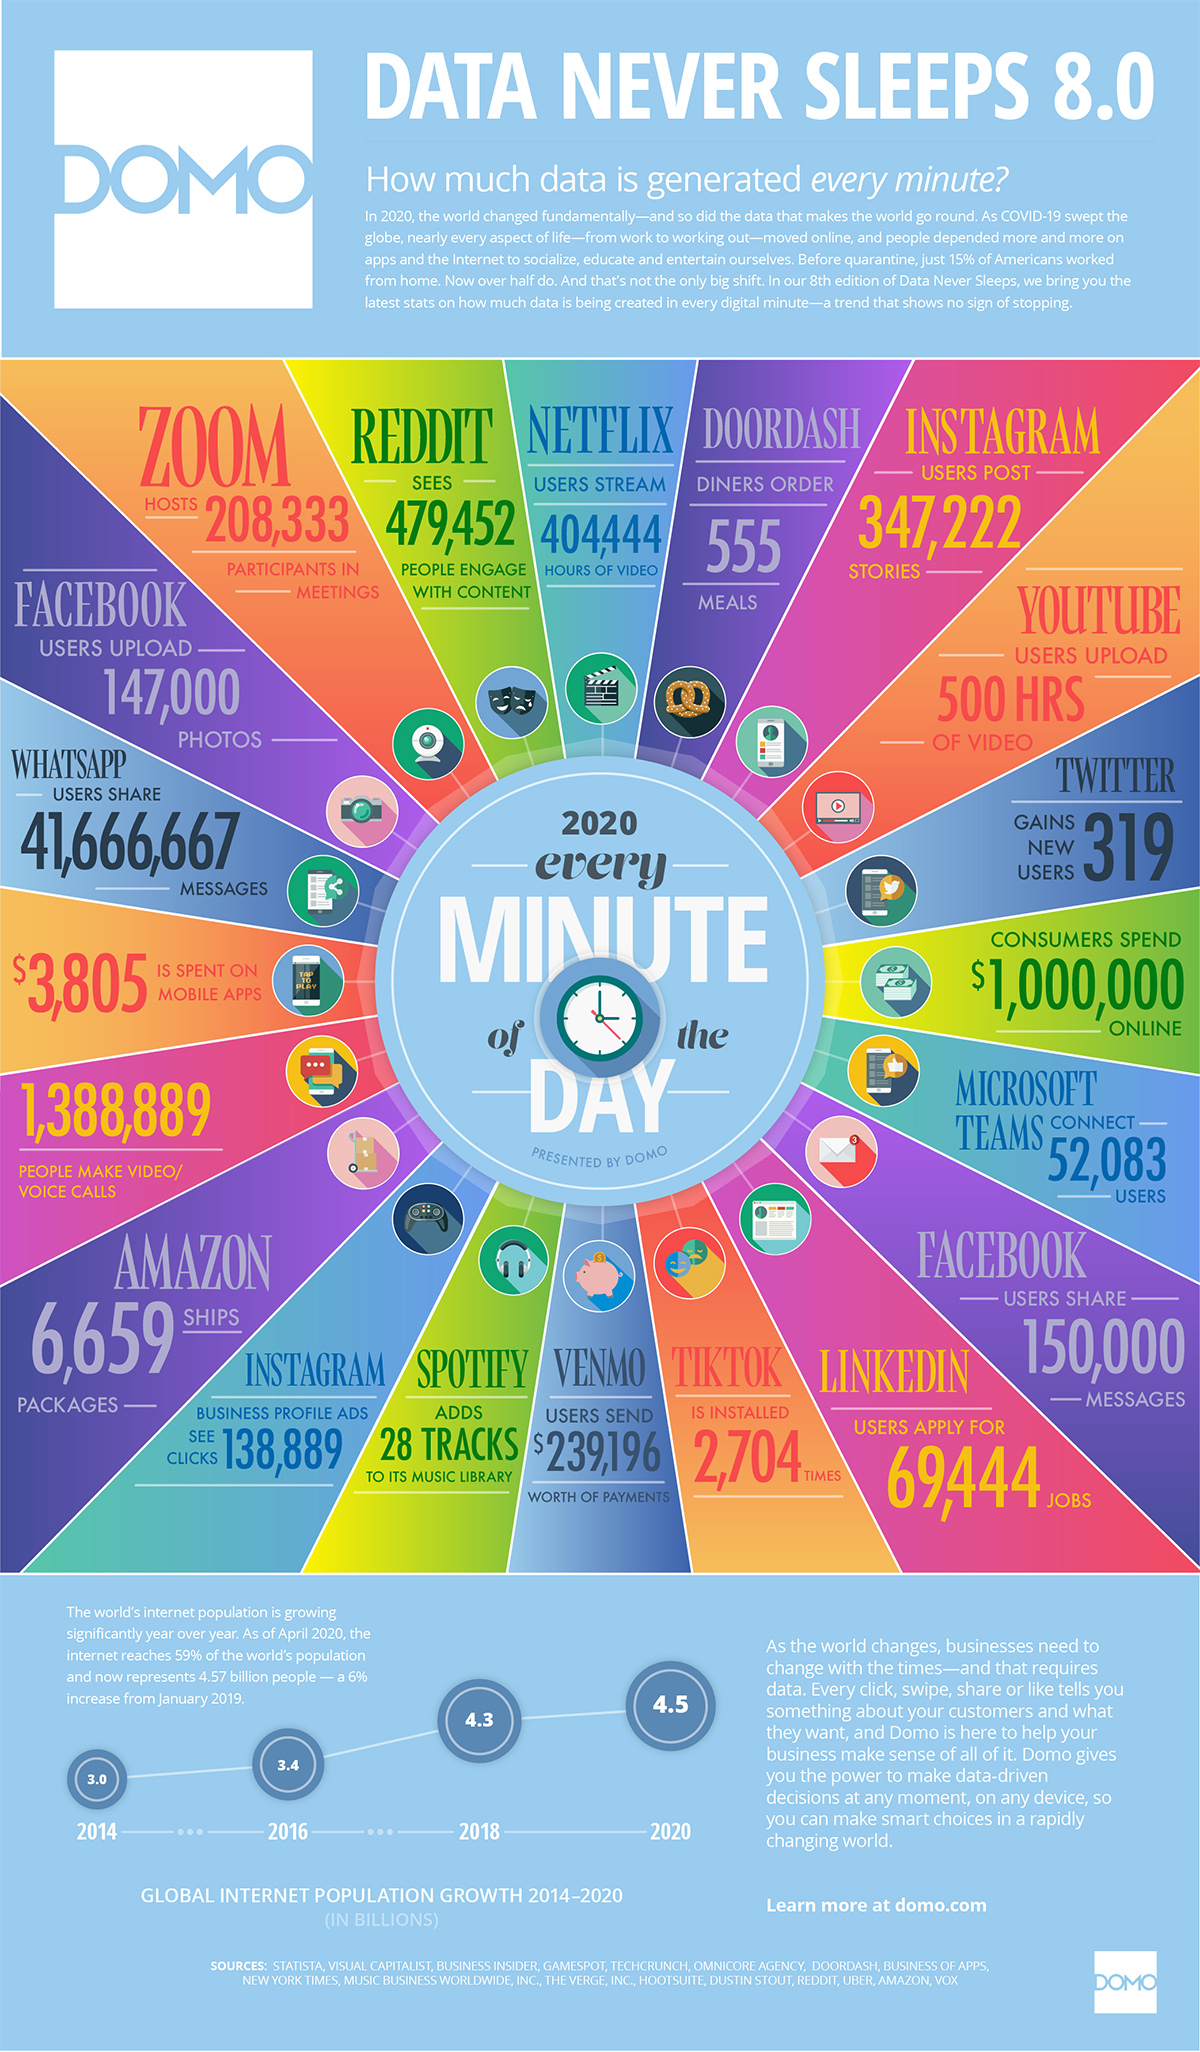
In 2020, an unfathomable amount of digital activity is occurring at any given moment. This ongoing explosion in activity is the aggregate output of 4.5 billion internet users today, a number that’s projected to increase even further in coming years.
This powerful visual from Domo helps capture what happens each minute in today’s hyper-connected internet era, and it’s actually the eighth edition produced since the year 2012.
What can we learn from the evolution of what happens in an internet minute?
How Times Have Changed
Over its relatively short history, the internet has been a catalyst for both the rise and demise of new companies and platforms.
By looking at which brands have appeared in the graphic in earlier years, we can roughly chart the prominence of certain tech segments, as well as observe brands with the most staying power.
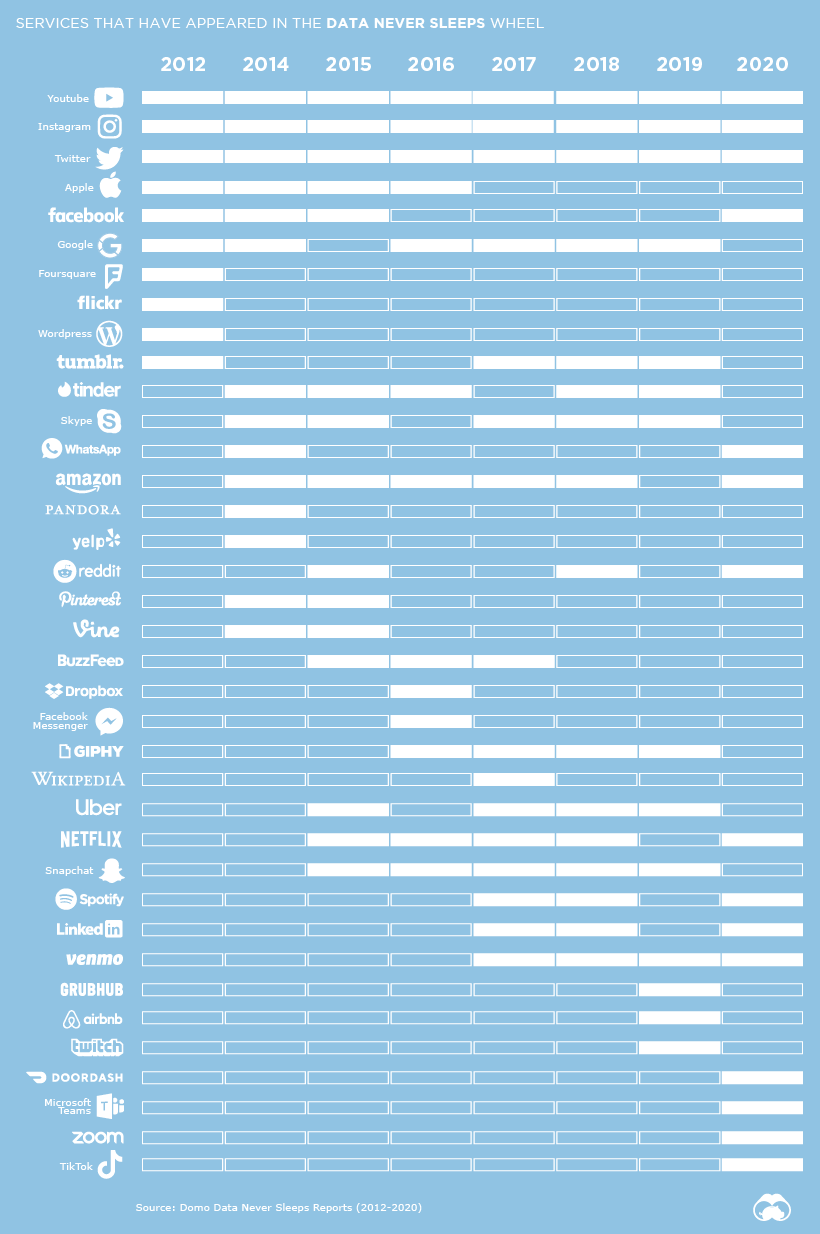
As you can see above, platforms like Tumblr, Flickr, and Foursquare showed some promise, but eventually got omitted from the graphic as they dropped off in relevance.
Meanwhile, tech companies like Facebook, Amazon, and Google have had impressive staying power, evolving to become some of the biggest companies in the world. In the process, they’ve caught up to longer-standing titans like Apple and Microsoft at the top of the food chain.
The New “New Thing”
Not surprisingly, much of the internet landscape looks different in 2020. Here are a few of the digital hot spots today.
Cash Transfers
Nearly $240,000 worth of transactions occur on Venmo per minute. This has served as a catalyst for parent company PayPal, which evolved along successfully with fintech trends. PayPal’s stock now trades at near all-time highs.
E-Commerce
Even before COVID-19 resulted in shuttered storefronts and surging online orders, e-commerce was a booming industry. It’s now estimated that $1 million is now spent per minute online. Amazon ships an astounding 6,659 packages every minute to keep up with this demand.
Collaboration Tools
In a predominantly remote-working environment, tools like Zoom and Microsoft Teams host 208,333 and 52,083 users each minute respectively. Particularly in the pandemic era, it seems that this trend is here to stay.
Accelerated Turnover
The accelerated world we are in today means that many companies do not sustain a competitive advantage for as long. Social media companies have dwindled as observed above, and this is similarly reflected in the average lifespan of an S&P 500 company.
A typical company’s tenure on the S&P 500 is expected to shrink rapidly in the next few years:
- 1964: 33 years
- 2016: 24 years
- 2027E: 12 years
Companies are shaving anywhere between 15-20 years off those highs, with estimates of further declines. This metric symbolizes the rapid evolution of the business landscape.
What Lies Ahead
It’s seemingly easy to forget mankind is still very early in the developments when it comes to the internet. But in this short period, its rise to prominence and the broad digitization of the world has left us with a very eventful timeline.
If the last decade serves as a reference point, one can expect further and intensifying competition among tech companies. After all, the reward—winning in today’s digital economy—reaps much greater value.
All signs point to internet activity advancing to further heights, if not because of 5G and its associated breakthroughs, then perhaps due to the steady rise in people gaining internet access.


Technology
All of the Grants Given by the U.S. CHIPS Act
Intel, TSMC, and more have received billions in subsidies from the U.S. CHIPS Act in 2024.


All of the Grants Given by the U.S. CHIPS Act
This was originally posted on our Voronoi app. Download the app for free on iOS or Android and discover incredible data-driven charts from a variety of trusted sources.
This visualization shows which companies are receiving grants from the U.S. CHIPS Act, as of April 25, 2024. The CHIPS Act is a federal statute signed into law by President Joe Biden that authorizes $280 billion in new funding to boost domestic research and manufacturing of semiconductors.
The grant amounts visualized in this graphic are intended to accelerate the production of semiconductor fabrication plants (fabs) across the United States.
Data and Company Highlights
The figures we used to create this graphic were collected from a variety of public news sources. The Semiconductor Industry Association (SIA) also maintains a tracker for CHIPS Act recipients, though at the time of writing it does not have the latest details for Micron.
| Company | Federal Grant Amount | Anticipated Investment From Company |
|---|---|---|
| 🇺🇸 Intel | $8,500,000,000 | $100,000,000,000 |
| 🇹🇼 TSMC | $6,600,000,000 | $65,000,000,000 |
| 🇰🇷 Samsung | $6,400,000,000 | $45,000,000,000 |
| 🇺🇸 Micron | $6,100,000,000 | $50,000,000,000 |
| 🇺🇸 GlobalFoundries | $1,500,000,000 | $12,000,000,000 |
| 🇺🇸 Microchip | $162,000,000 | N/A |
| 🇬🇧 BAE Systems | $35,000,000 | N/A |
BAE Systems was not included in the graphic due to size limitations
Intel’s Massive Plans
Intel is receiving the largest share of the pie, with $8.5 billion in grants (plus an additional $11 billion in government loans). This grant accounts for 22% of the CHIPS Act’s total subsidies for chip production.
From Intel’s side, the company is expected to invest $100 billion to construct new fabs in Arizona and Ohio, while modernizing and/or expanding existing fabs in Oregon and New Mexico. Intel could also claim another $25 billion in credits through the U.S. Treasury Department’s Investment Tax Credit.
TSMC Expands its U.S. Presence
TSMC, the world’s largest semiconductor foundry company, is receiving a hefty $6.6 billion to construct a new chip plant with three fabs in Arizona. The Taiwanese chipmaker is expected to invest $65 billion into the project.
The plant’s first fab will be up and running in the first half of 2025, leveraging 4 nm (nanometer) technology. According to TrendForce, the other fabs will produce chips on more advanced 3 nm and 2 nm processes.
The Latest Grant Goes to Micron
Micron, the only U.S.-based manufacturer of memory chips, is set to receive $6.1 billion in grants to support its plans of investing $50 billion through 2030. This investment will be used to construct new fabs in Idaho and New York.

-

 Debt1 week ago
How Debt-to-GDP Ratios Have Changed Since 2000
-

 Markets2 weeks ago
Ranked: The World’s Top Flight Routes, by Revenue
-

 Countries2 weeks ago
Population Projections: The World’s 6 Largest Countries in 2075
-

 Markets2 weeks ago
The Top 10 States by Real GDP Growth in 2023
-

 Demographics2 weeks ago
The Smallest Gender Wage Gaps in OECD Countries
-

 United States2 weeks ago
Where U.S. Inflation Hit the Hardest in March 2024
-

 Green2 weeks ago
Top Countries By Forest Growth Since 2001
-

 United States2 weeks ago
Ranked: The Largest U.S. Corporations by Number of Employees