Technology
A Visual Breakdown of Global Music Consumption
Article/Editing:
A Visual Breakdown of Global Music Consumption
To maximize any chance of success in the music business, aspiring artists must gain an understanding of how music is consumed and how that is changing alongside technology.
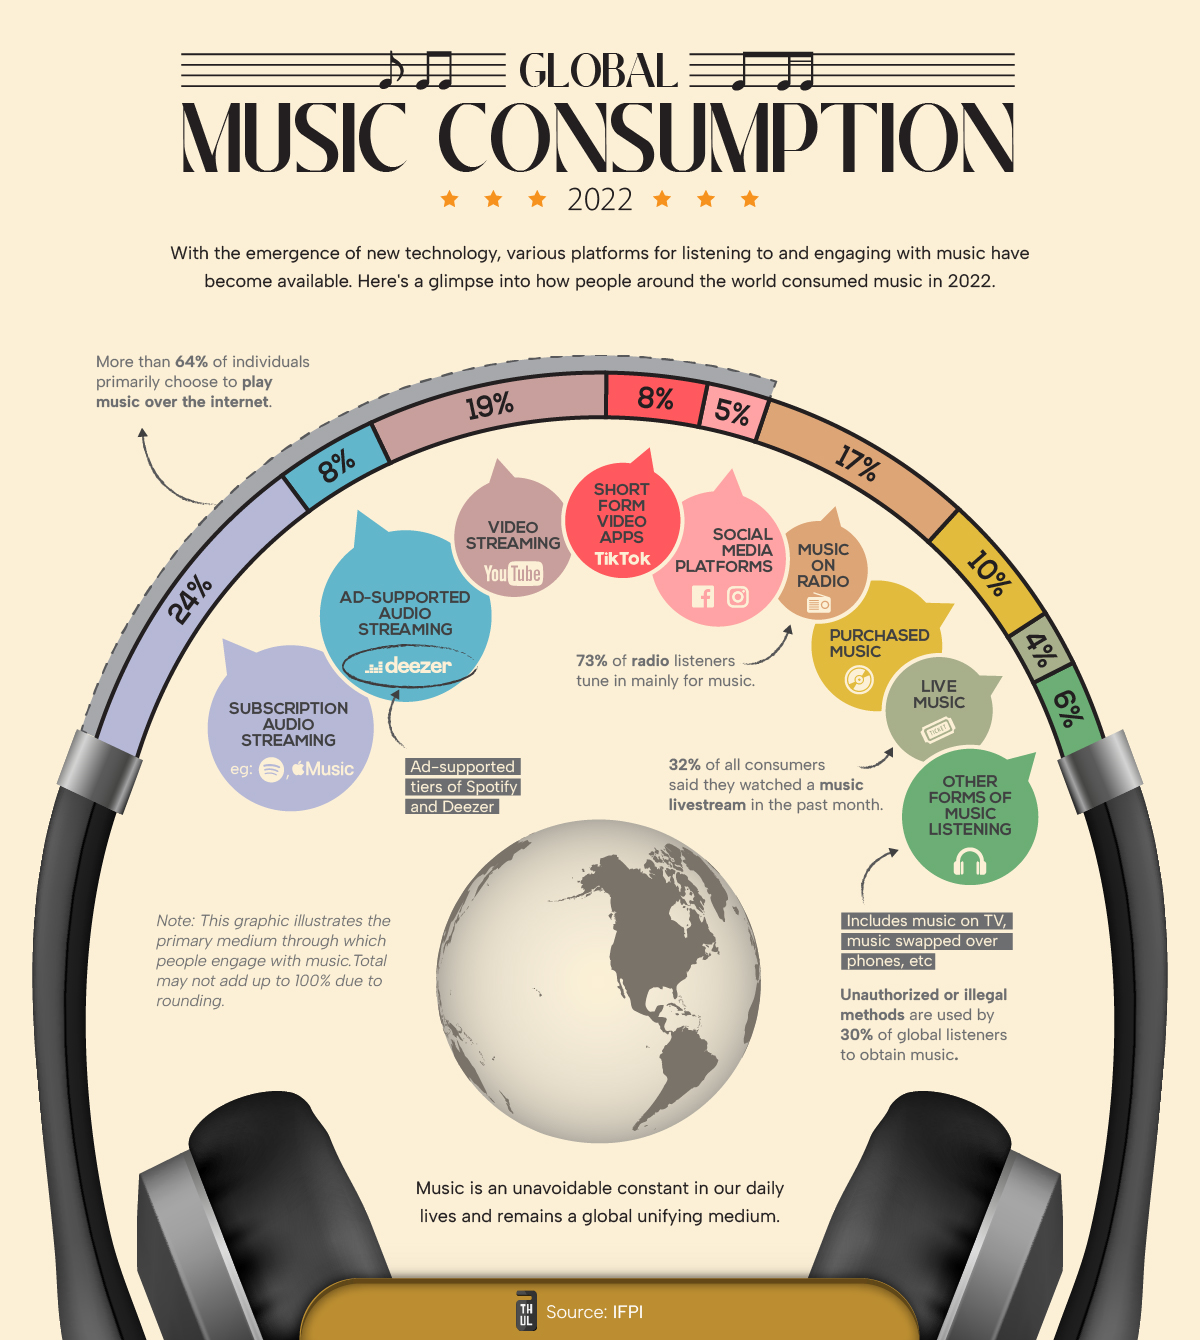
This graphic from Athul Alexander highlights global music consumption habits. Data is from 2022 and is sourced from a survey of over 44,000 people from 22 countries by IFPI that asked people their primary mode for consuming music.
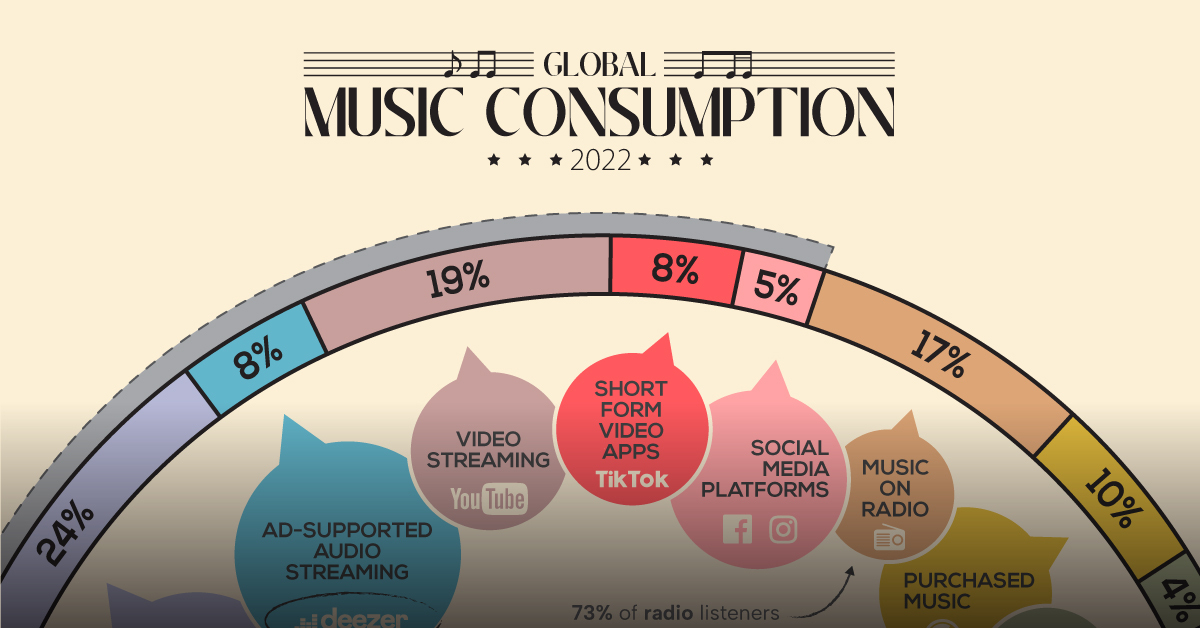
As of 2022, paid subscription services (i.e. Apple Music, Spotify) are the most preferred option for listeners, accounting for nearly one-fourth of main platform share.
| Rank | Service | Share | Examples |
|---|---|---|---|
| 1 | Paid Audio Streaming | 24% | Spotify, Apple Music |
| 2 | Video Streaming | 19% | YouTube |
| 3 | Radio | 17% | |
| 4 | Purchased Music | 10% | Vinyls, CDs, purchased digital albums |
| 5 | Ad-Supported Audio Streaming | 8% | Amazon, Deezer |
| 6 | Short-form Videos | 8% | TikTok |
| 7 | Social Media Videos | 5% | Facebook, Instagram |
| 8 | Live Music | 4% | concerts, livestreams |
| 9 | Other | 6% | music on TV, phone-to-phone transfers |
Short-form video platforms like TikTok, with an 8% share of primary music listeners, are a fast-growing medium. Several young artists have found initial success and traction using these platforms over the past few years.
And though video “killed the radio star,” it hasn’t killed listening to music on the radio. A healthy, 17% of respondents picked radio as their primary avenue for listening to music.
Streaming Supremacy and Virality
There’s no doubt that the internet has revolutionized how music is being consumed.
Including all video and music streaming, internet-based music consumption was the primary choice for 64% of respondents. That’s not even accounting for livestreams or music purchased through the internet.
| Platform | Share |
|---|---|
| Internet-based | 64% |
| Non-Internet Based | 37% |
This internet-heavy metric is being reflected on the business side as well, with 75% of the music industry’s revenues in the U.S. coming from streaming.
However, for artists, streaming revenue is usually the third-biggest earner after live performances and sales.
But utilizing streaming to its fullest potential keeps modern artists in the loop. For example, Beyoncé was one of the first artists to utilize streaming platforms to release an album completely unannounced in 2013, a marketing move that has been replicated many times since.
Source: IFPI
Data note: IFPI surveyed over 44,000 people from 22 countries, asking them about their primary mode of consuming music. They exclude India and China from their global figures to prevent the size of the population from influencing the global weighted average. Percentages may also not add up to 100 because of rounded figures.

This article was published as a part of Visual Capitalist's Creator Program, which features data-driven visuals from some of our favorite Creators around the world.


Brands
How Tech Logos Have Evolved Over Time
From complete overhauls to more subtle tweaks, these tech logos have had quite a journey. Featuring: Google, Apple, and more.


How Tech Logos Have Evolved Over Time
This was originally posted on our Voronoi app. Download the app for free on iOS or Android and discover incredible data-driven charts from a variety of trusted sources.
One would be hard-pressed to find a company that has never changed its logo. Granted, some brands—like Rolex, IBM, and Coca-Cola—tend to just have more minimalistic updates. But other companies undergo an entire identity change, thus necessitating a full overhaul.
In this graphic, we visualized the evolution of prominent tech companies’ logos over time. All of these brands ranked highly in a Q1 2024 YouGov study of America’s most famous tech brands. The logo changes are sourced from 1000logos.net.
How Many Times Has Google Changed Its Logo?
Google and Facebook share a 98% fame rating according to YouGov. But while Facebook’s rise was captured in The Social Network (2010), Google’s history tends to be a little less lionized in popular culture.
For example, Google was initially called “Backrub” because it analyzed “back links” to understand how important a website was. Since its founding, Google has undergone eight logo changes, finally settling on its current one in 2015.
| Company | Number of Logo Changes |
|---|---|
| 8 | |
| HP | 8 |
| Amazon | 6 |
| Microsoft | 6 |
| Samsung | 6 |
| Apple | 5* |
Note: *Includes color changes. Source: 1000Logos.net
Another fun origin story is Microsoft, which started off as Traf-O-Data, a traffic counter reading company that generated reports for traffic engineers. By 1975, the company was renamed. But it wasn’t until 2012 that Microsoft put the iconic Windows logo—still the most popular desktop operating system—alongside its name.
And then there’s Samsung, which started as a grocery trading store in 1938. Its pivot to electronics started in the 1970s with black and white television sets. For 55 years, the company kept some form of stars from its first logo, until 1993, when the iconic encircled blue Samsung logo debuted.
Finally, Apple’s first logo in 1976 featured Isaac Newton reading under a tree—moments before an apple fell on his head. Two years later, the iconic bitten apple logo would be designed at Steve Jobs’ behest, and it would take another two decades for it to go monochrome.

-

 Maps1 week ago
The Largest Earthquakes in the New York Area (1970-2024)
-

 Money2 weeks ago
Where Does One U.S. Tax Dollar Go?
-

 Automotive2 weeks ago
Almost Every EV Stock is Down After Q1 2024
-

 AI2 weeks ago
The Stock Performance of U.S. Chipmakers So Far in 2024
-

 Markets2 weeks ago
Charted: Big Four Market Share by S&P 500 Audits
-

 Real Estate2 weeks ago
Ranked: The Most Valuable Housing Markets in America
-

 Money2 weeks ago
Which States Have the Highest Minimum Wage in America?
-

 AI2 weeks ago
Ranked: Semiconductor Companies by Industry Revenue Share