Culture
Animated: Best Picture Oscar Winners vs. Box Office Hits
Article/Editing:
Best Picture Oscar Winners vs. Box Office Hits
When Oppenheimer won the Academy Award for Best Picture at the 2024 ceremony, it joined a list of Best Picture Oscar winners as a box office behemoth, having earned $958.7 million at the 2023 box office.
But as this data-driven exploration from Vizzu shows, the movie’s success is not par for the course. Over the past 30 years, there has been a complex relationship between Oscar accolades and box office performance.
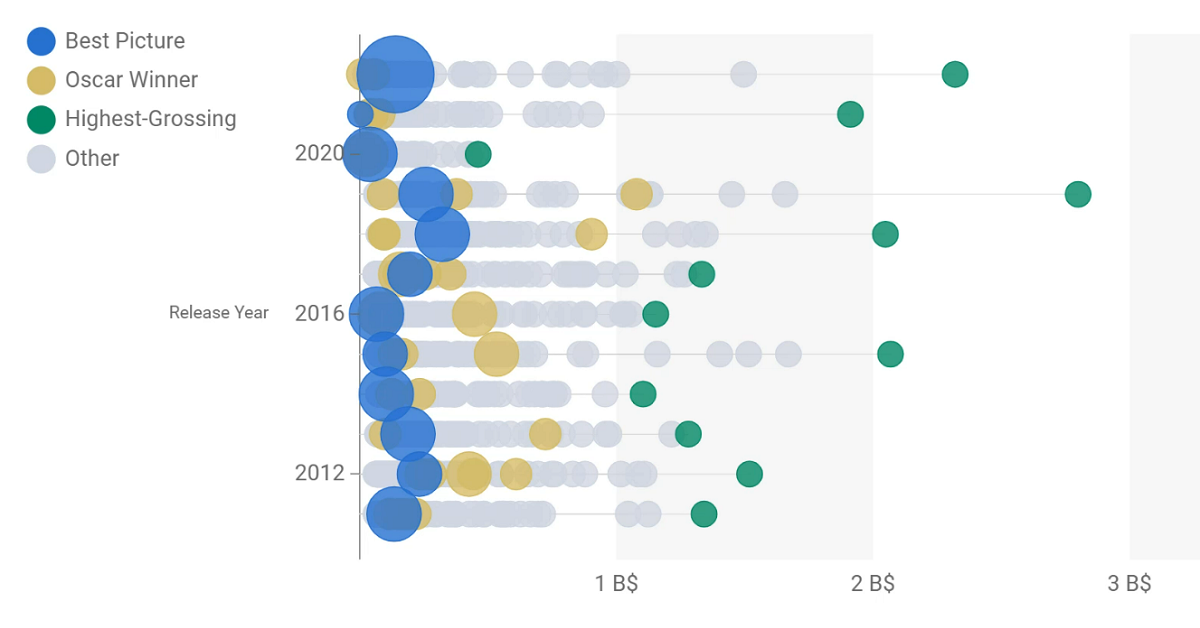
Comparing Oscar Winners and Box Office Hits (1993–2023)
Using annual worldwide box office hauls from Box Office Mojo, Vizzu compared the earnings of Best Picture Oscar winners with those of the highest grossing movie of each year.
At last year’s event, Everything Everywhere All at Once won six Oscars (including Best Picture) and earned $143.4 million globally. That’s a decent haul, but pales in comparison with Avatar: The Way of Water, which grossed more than $2.3 billion.
As this table shows, more often than not, this divide between critical darling and commercial juggernaut has been the norm over since 1993:
| Film Year | Best Picture Winner | Box Office (Worldwide) | Box Office (Highest Grossing) |
|---|---|---|---|
| 2023 | Oppenheimer | $958.7M | $1,445.6M |
| 2022 | Everything Everywhere All at Once | $143.4M | $2,320.2M |
| 2021 | CODA | $1.9M | $1,912.2M |
| 2020 | Nomadland | $39.5M | $461.0M |
| 2019 | Parasite | $262.0M | $2,799.4M |
| 2018 | Green Book | $321.8M | $2,048.4M |
| 2017 | The Shape of Water | $195.2M | $1,332.5M |
| 2016 | Moonlight | $65.2M | $1,153.3M |
| 2015 | Spotlight | $98.7M | $2,068.2M |
| 2014 | Birdman or (The Unexpected Virtue of Ignorance) | $103.2M | $1,104.1M |
| 2013 | 12 Years a Slave | $187.7M | $1,280.8M |
| 2012 | Argo | $232.3M | $1,518.8M |
| 2011 | The Artist | $133.4M | $1,341.5M |
| 2010 | The King's Speech | $427.4M | $1,067.0M |
| 2009 | The Hurt Locker | $49.3M | $2,743.6M |
| 2008 | Slumdog Millionaire | $378.4M | $1,003.8M |
| 2007 | No Country for Old Men | $171.6M | $961.7M |
| 2006 | The Departed | $291.4M | $1,066.2M |
| 2005 | Crash | $98.4M | $895.9M |
| 2004 | Million Dollar Baby | $216.8M | $929.0M |
| 2003 | Lord of the Rings: The Return of the King | $1,140.7M | $1,140.7M |
| 2002 | Chicago | $306.8M | $936.7M |
| 2001 | A Beautiful Mind | $316.8M | $974.8M |
| 2000 | Gladiator | $460.6M | $546.4M |
| 1999 | American Beauty | $356.3M | $924.3M |
| 1998 | Shakespeare in Love | $289.3M | $553.7M |
| 1997 | Titanic | $1,843.4M | $1,843.4M |
| 1996 | The English Patient | $232.0M | $817.4M |
| 1995 | Braveheart | $213.2M | $366.1M |
| 1994 | Forrest Gump | $677.9M | $763.5M |
| 1993 | Schindler's List | $322.2M | $978.2M |
Only two films won Best Picture while topping the box office in their release year: The Lord of the Rings: The Return of the King in 2003 and Titanic in 1997.
Just seven more films won major Oscars—including Best Picture, Best Director, Best Actor/ Actress, Best Original/Adapted Screenplay, and Best Supporting Actor/Actress—while earning at least half as much as the top grossers of their release years:
- 2023: Oppenheimer
- 2013: Gravity
- 2008: The Dark Knight
- 2000: Gladiator
- 1998: Shakespeare in Love and Saving Private Ryan
- 1995: Braveheart
- 1994: Forrest Gump
This challenges the notion that blockbuster success and Oscar glory go hand-in-hand, but perhaps the success of Oppenheimer can help the box office kings reclaim their Oscar crowns.

This article was published as a part of Visual Capitalist's Creator Program, which features data-driven visuals from some of our favorite Creators around the world.


Brands
How Tech Logos Have Evolved Over Time
From complete overhauls to more subtle tweaks, these tech logos have had quite a journey. Featuring: Google, Apple, and more.


How Tech Logos Have Evolved Over Time
This was originally posted on our Voronoi app. Download the app for free on iOS or Android and discover incredible data-driven charts from a variety of trusted sources.
One would be hard-pressed to find a company that has never changed its logo. Granted, some brands—like Rolex, IBM, and Coca-Cola—tend to just have more minimalistic updates. But other companies undergo an entire identity change, thus necessitating a full overhaul.
In this graphic, we visualized the evolution of prominent tech companies’ logos over time. All of these brands ranked highly in a Q1 2024 YouGov study of America’s most famous tech brands. The logo changes are sourced from 1000logos.net.
How Many Times Has Google Changed Its Logo?
Google and Facebook share a 98% fame rating according to YouGov. But while Facebook’s rise was captured in The Social Network (2010), Google’s history tends to be a little less lionized in popular culture.
For example, Google was initially called “Backrub” because it analyzed “back links” to understand how important a website was. Since its founding, Google has undergone eight logo changes, finally settling on its current one in 2015.
| Company | Number of Logo Changes |
|---|---|
| 8 | |
| HP | 8 |
| Amazon | 6 |
| Microsoft | 6 |
| Samsung | 6 |
| Apple | 5* |
Note: *Includes color changes. Source: 1000Logos.net
Another fun origin story is Microsoft, which started off as Traf-O-Data, a traffic counter reading company that generated reports for traffic engineers. By 1975, the company was renamed. But it wasn’t until 2012 that Microsoft put the iconic Windows logo—still the most popular desktop operating system—alongside its name.
And then there’s Samsung, which started as a grocery trading store in 1938. Its pivot to electronics started in the 1970s with black and white television sets. For 55 years, the company kept some form of stars from its first logo, until 1993, when the iconic encircled blue Samsung logo debuted.
Finally, Apple’s first logo in 1976 featured Isaac Newton reading under a tree—moments before an apple fell on his head. Two years later, the iconic bitten apple logo would be designed at Steve Jobs’ behest, and it would take another two decades for it to go monochrome.

-

 Debt1 week ago
How Debt-to-GDP Ratios Have Changed Since 2000
-

 Markets2 weeks ago
Ranked: The World’s Top Flight Routes, by Revenue
-

 Countries2 weeks ago
Population Projections: The World’s 6 Largest Countries in 2075
-

 Markets2 weeks ago
The Top 10 States by Real GDP Growth in 2023
-

 Demographics2 weeks ago
The Smallest Gender Wage Gaps in OECD Countries
-

 United States2 weeks ago
Where U.S. Inflation Hit the Hardest in March 2024
-

 Green2 weeks ago
Top Countries By Forest Growth Since 2001
-

 United States2 weeks ago
Ranked: The Largest U.S. Corporations by Number of Employees