Media
U.S. Streaming Subscribers: Projections for 2027
![]() See this visualization first on the Voronoi app.
See this visualization first on the Voronoi app.
U.S. Streaming Subscribers: Projections for 2027
This was originally posted on our Voronoi app. Download the app for free on iOS or Android and discover incredible data-driven charts from a variety of trusted sources.
The U.S. is witnessing a surge in video streaming subscriptions, fueled by high demand for original content. Projected revenue in the Subscription Video on Demand (SVoD) market is set to reach $43.97 billion by 2024.
In a scenario of intense competition among various streaming platforms, Prime Video is expected to stand out over the next few years.
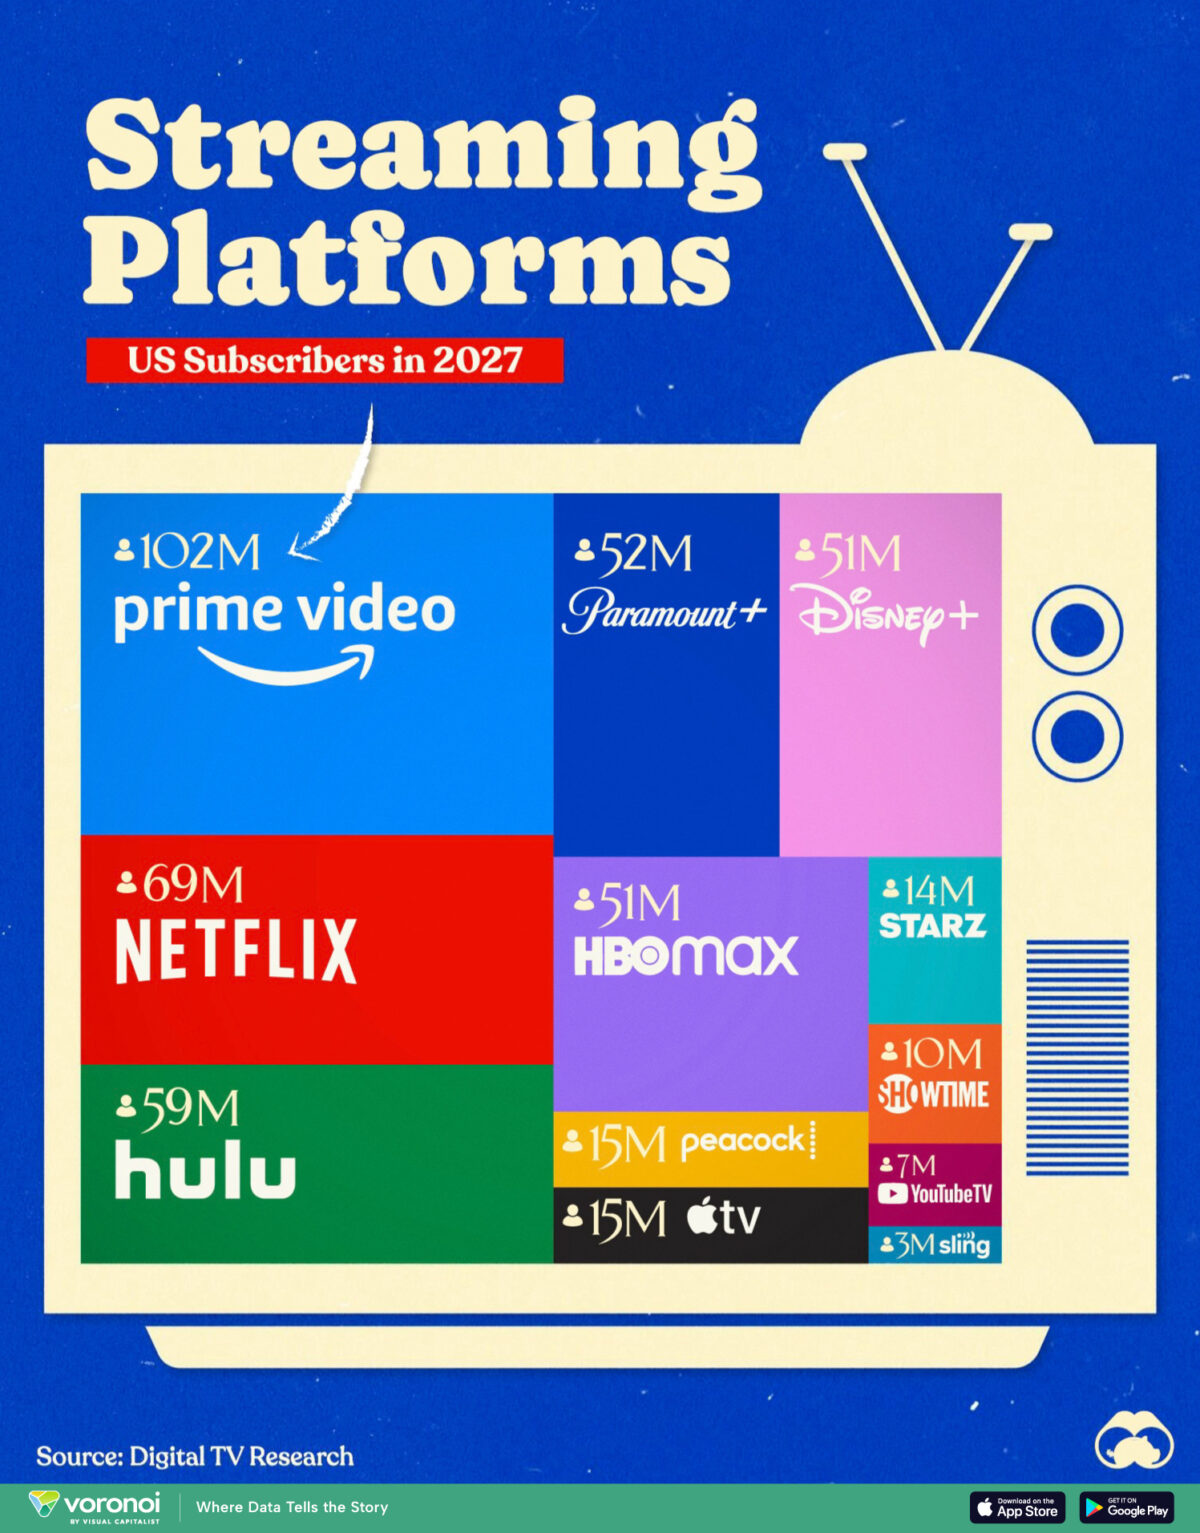
This graphic presents the forecasted number of U.S. subscribers on major streaming platforms in 2027, based on a report published by Digital TV Research in 2022.
Prime Video to Be the Most Popular by a Wide Margin
Prime Video is anticipated to be the most popular platform by a considerable margin, boasting over 100 million subscribers, surpassing Netflix with 69 million and Hulu with 59 million.
This dominance is attributed to its integration with the Amazon Prime Membership, which boasts an estimated 167.2 million members in the U.S.
| Platform | Number of U.S. subscribers (M) |
|---|---|
| Amazon Prime Video | 102 |
| Netflix | 69 |
| Hulu | 59 |
| Paramount+ | 52 |
| Disney+ | 51 |
| HBO Max | 51 |
| Peacock | 15 |
| Apple TV | 15 |
| Starz | 14 |
| Showtime | 10 |
| YouTube TV | 7 |
| Sling TV | 3 |
In 2022, Prime Video surpassed Netflix after years of dominance. Although Netflix is anticipated to maintain its position as the second most popular streaming service, numerous competitors are in close pursuit.
Netflix is projected to gain only two million U.S. subscribers between 2021 and 2027, a growth rate significantly lower than that of Disney+ (12M), Paramount+ (26M), and HBO Max (31M).
Netflix Continues Dominance on Global Stage
Despite conceding the U.S. market to Prime Video, Netflix is poised to maintain its dominance on a global scale.
Digital TV Research forecasts that Netflix will remain the largest single platform, projecting an addition of 44 million subscribers between 2023 and 2029, bringing its total to 298 million.


Culture
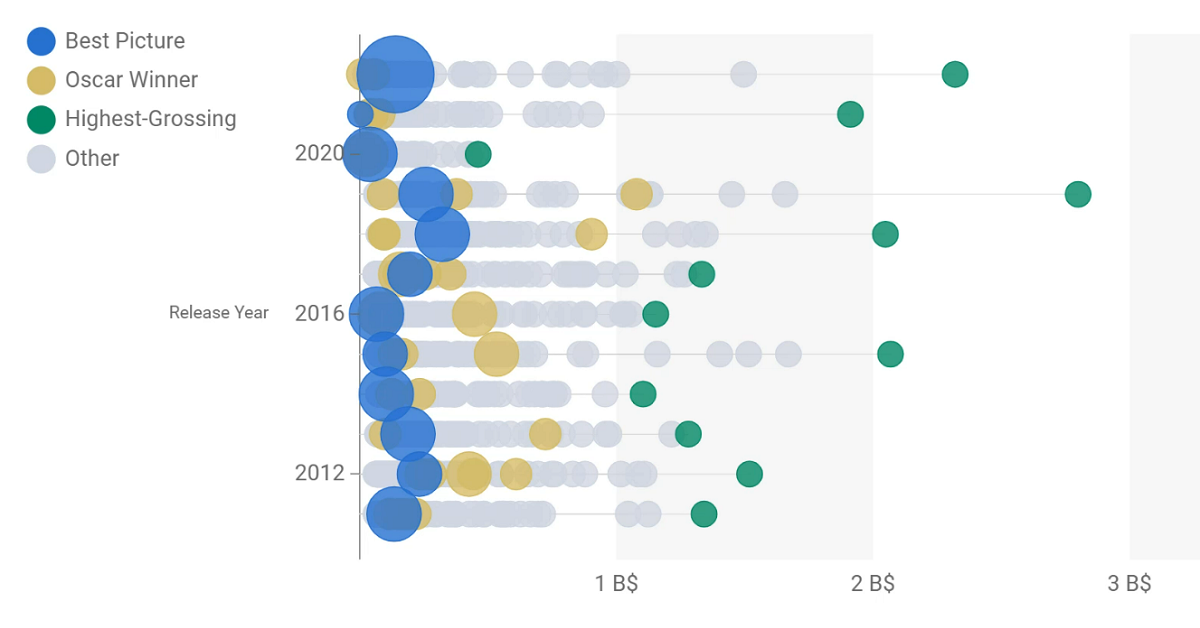
Animated: Best Picture Oscar Winners vs. Box Office Hits
This data-driven exploration examines the relationship between Best Picture Oscar winners and box office performance over the past 30 years.
 Creator Program
Best Picture Oscar Winners vs. Box Office Hits
When Oppenheimer won the Academy Award for Best Picture at the 2024 ceremony, it joined a list of Best Picture Oscar winners as a box office behemoth, having earned $958.7 million at the 2023 box office.
But as this data-driven exploration from Vizzu shows, the movie’s success is not par for the course. Over the past 30 years, there has been a complex relationship between Oscar accolades and box office performance.
Comparing Oscar Winners and Box Office Hits (1993–2023)
Using annual worldwide box office hauls from Box Office Mojo, Vizzu compared the earnings of Best Picture Oscar winners with those of the highest grossing movie of each year.
At last year’s event, Everything Everywhere All at Once won six Oscars (including Best Picture) and earned $143.4 million globally. That’s a decent haul, but pales in comparison with Avatar: The Way of Water, which grossed more than $2.3 billion.
As this table shows, more often than not, this divide between critical darling and commercial juggernaut has been the norm over since 1993:
| Film Year | Best Picture Winner | Box Office (Worldwide) | Box Office (Highest Grossing) |
|---|---|---|---|
| 2023 | Oppenheimer | $958.7M | $1,445.6M |
| 2022 | Everything Everywhere All at Once | $143.4M | $2,320.2M |
| 2021 | CODA | $1.9M | $1,912.2M |
| 2020 | Nomadland | $39.5M | $461.0M |
| 2019 | Parasite | $262.0M | $2,799.4M |
| 2018 | Green Book | $321.8M | $2,048.4M |
| 2017 | The Shape of Water | $195.2M | $1,332.5M |
| 2016 | Moonlight | $65.2M | $1,153.3M |
| 2015 | Spotlight | $98.7M | $2,068.2M |
| 2014 | Birdman or (The Unexpected Virtue of Ignorance) | $103.2M | $1,104.1M |
| 2013 | 12 Years a Slave | $187.7M | $1,280.8M |
| 2012 | Argo | $232.3M | $1,518.8M |
| 2011 | The Artist | $133.4M | $1,341.5M |
| 2010 | The King's Speech | $427.4M | $1,067.0M |
| 2009 | The Hurt Locker | $49.3M | $2,743.6M |
| 2008 | Slumdog Millionaire | $378.4M | $1,003.8M |
| 2007 | No Country for Old Men | $171.6M | $961.7M |
| 2006 | The Departed | $291.4M | $1,066.2M |
| 2005 | Crash | $98.4M | $895.9M |
| 2004 | Million Dollar Baby | $216.8M | $929.0M |
| 2003 | Lord of the Rings: The Return of the King | $1,140.7M | $1,140.7M |
| 2002 | Chicago | $306.8M | $936.7M |
| 2001 | A Beautiful Mind | $316.8M | $974.8M |
| 2000 | Gladiator | $460.6M | $546.4M |
| 1999 | American Beauty | $356.3M | $924.3M |
| 1998 | Shakespeare in Love | $289.3M | $553.7M |
| 1997 | Titanic | $1,843.4M | $1,843.4M |
| 1996 | The English Patient | $232.0M | $817.4M |
| 1995 | Braveheart | $213.2M | $366.1M |
| 1994 | Forrest Gump | $677.9M | $763.5M |
| 1993 | Schindler's List | $322.2M | $978.2M |
Only two films won Best Picture while topping the box office in their release year: The Lord of the Rings: The Return of the King in 2003 and Titanic in 1997.
Just seven more films won major Oscars—including Best Picture, Best Director, Best Actor/ Actress, Best Original/Adapted Screenplay, and Best Supporting Actor/Actress—while earning at least half as much as the top grossers of their release years:
- 2023: Oppenheimer
- 2013: Gravity
- 2008: The Dark Knight
- 2000: Gladiator
- 1998: Shakespeare in Love and Saving Private Ryan
- 1995: Braveheart
- 1994: Forrest Gump
This challenges the notion that blockbuster success and Oscar glory go hand-in-hand, but perhaps the success of Oppenheimer can help the box office kings reclaim their Oscar crowns.

-

 Education1 week ago
How Hard Is It to Get Into an Ivy League School?
-

 Technology2 weeks ago
Ranked: Semiconductor Companies by Industry Revenue Share
-

 Markets2 weeks ago
Ranked: The World’s Top Flight Routes, by Revenue
-

 Demographics2 weeks ago
Population Projections: The World’s 6 Largest Countries in 2075
-

 Markets2 weeks ago
The Top 10 States by Real GDP Growth in 2023
-

 Demographics2 weeks ago
The Smallest Gender Wage Gaps in OECD Countries
-

 Economy2 weeks ago
Where U.S. Inflation Hit the Hardest in March 2024
-

 Green2 weeks ago
Top Countries By Forest Growth Since 2001