Economy
You’re Grounded: The COVID-19 Effect on Global Flight Capacity


You’re Grounded: The COVID-19 Effect on Flight Capacity
It’s not an exaggeration to say that the COVID-19 pandemic has thrown the world into a tailspin.
As the number of new cases continues to surge in parts of the world, numbers are beginning to decline in others as public health officials and governments tirelessly work to slow the contagion and reach of the virus.
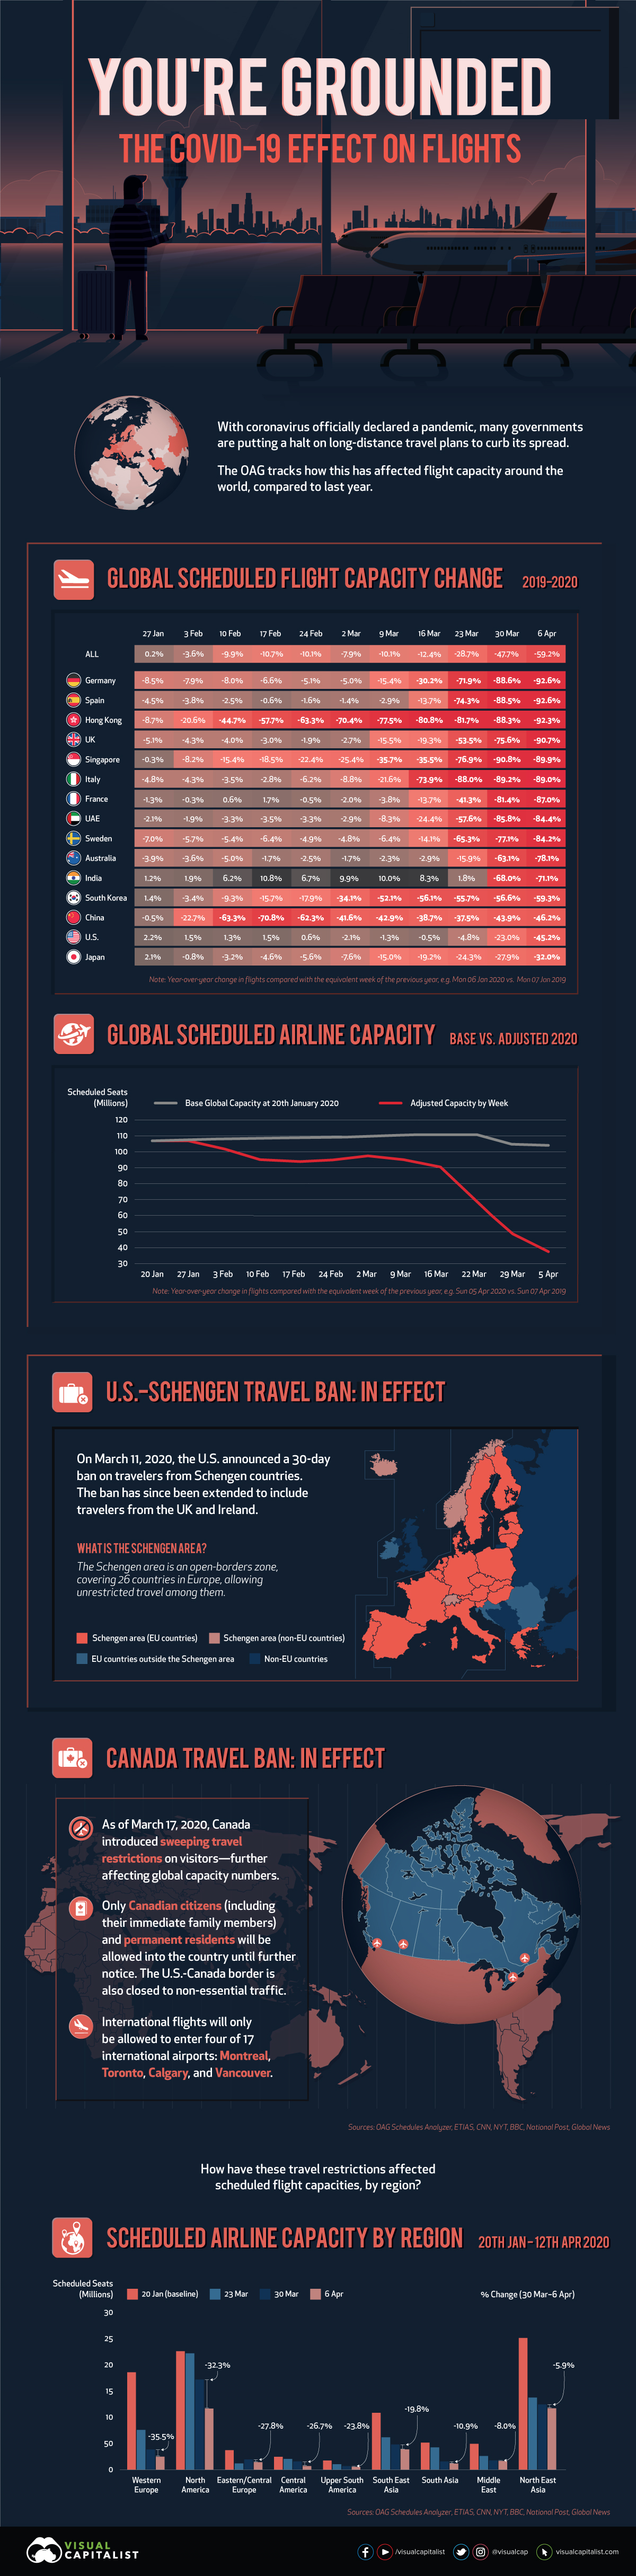
The potent combination of trip cancellations and country-specific restrictions on international flights has had a staggering impact on the $880 billion global airline industry. Today’s visualization highlights data from the OAG Aviation Worldwide, which tracks how global flight capacity differs from last year’s numbers.
Note: this post has been updated on April 7, 2020 to reflect the latest data.
Asia Faced the First Hard Landing
Nearly all countries have some type of travel advisory in place, with many encouraging people to avoid non-essential travel even before COVID-19 was officially considered a pandemic by the World Health Organization (WHO).
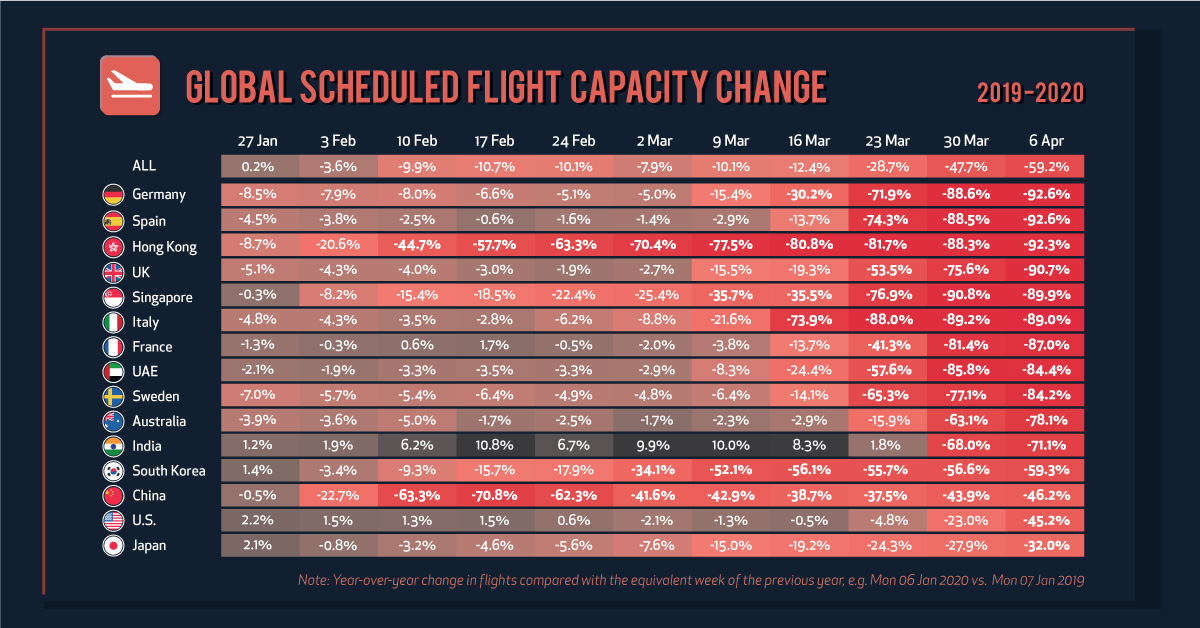
The earliest impacts of these were felt in February, as flight capacity in and out of China dropped sharply around Lunar New Year. Also, the country’s sharpest year-over-year drop was recorded on February 17, 2020, with a 71% drop in flights compared to the same date in 2019. However, there’s some good news: life in China is slowly returning back to normal, as Wuhan eases its lockdown after almost two and a half months.
Flight capacity for Hong Kong, which was already seeing its traveler numbers declining due to months-long protests, continues its slump. As of April 6, 2020, scheduled flights were down by an immense 92.3% compared to 2019—the most of any Asian jurisdiction represented in the data.
India showed one of the most drastic declines, from 1.8% down to -68% on March 30, 2020. This resulted from a 21-day lockdown order on March 24, 2020—with only four hours of notice for its 1.3 billion citizens.
Monitoring the Situation Elsewhere
Meanwhile in Europe, Italy saw a 22% drop in flights coinciding with the announcement of a national lockdown March 9, 2020. Now that the situation has intensified, flights to and from Italy have plummeted 89% from their normal rates.
Germany and Spain are seeing the highest declines in scheduled flights worldwide, with approximately 92.6% less capacity as of April 6, 2020. Flight capacity in the region has plummeted thanks to widespread restrictions.
On March 11, 2020, the U.S. enforced a 30-day ban on travelers from the Schengen Area, a free-travel zone consisting of 26 countries in Europe, and has since extended to include the UK and Ireland. As a result, U.S. flight capacity is beginning its descent, dropping 45.2% by April 6, 2020 as the ban may be extended, and to even more countries.
Meanwhile, as of March 17, the U.S.-Canada border is closed for all non-essential travel. This follows a previous announcement from the Canadian government that it would be curbing entry to only Canadian citizens, family members, permanent residents, diplomats, and Americans.
Broadly speaking, countries around the world are taking similar actions to limit the spread of the virus and “flatten the curve”:
| Measure Taken | Example Countries* |
|---|---|
| Suspending flights from specific countries | 🇺🇸United States, 🇹🇷Turkey |
| Returning citizens must enter through specific airports | 🇨🇦Canada, 🇺🇸United States |
| Mandatory screening | 🇮🇹Italy, 🇧🇴Bolivia |
| 14 day self-quarantine | 🇮🇱Israel, 🇬🇷Greece |
| Complete closure of borders | 🇬🇹Guatemala, 🇵🇪Peru |
*As of March 17, 2020
More Turbulent Times Ahead?
As both COVID-19 and the global response to it continues to evolve, here are the largest flight capacity reductions across different regions in the past few weeks, compared to a baseline from Jan 20, 2020:
| Region | 20 Jan 2020 Flights | 23 Mar 2020 Flights | 30 Mar 2020 Flights | 06 Apr 2020 Flights | % Change (6 Apr vs 30 Mar) |
|---|---|---|---|---|---|
| Western Europe | 18,606,424 | 7,595,264 | 3,840,536 | 2,476,034 | -35.5% |
| North America | 22,644,121 | 22,236,625 | 17,221,751 | 11,658,243 | -32.3% |
| Eastern/Central Europe | 3,701,241 | 1,176,139 | 1,930,546 | 1,393,600 | -27.8% |
| Central America | 2,444,383 | 2,040,677 | 1,548,458 | 1,135,163 | -26.7% |
| Upper South America | 1,737,713 | 1,011,930 | 673,016 | 513,056 | -23.8% |
| Southeast Asia | 10,866,623 | 6,177,093 | 4,810,945 | 3,856,977 | -19.8% |
| South Asia | 5,160,958 | 4,245,635 | 1,538,918 | 1,371,156 | -10.9% |
| Middle East | 4,930,030 | 2,580,466 | 1,760,809 | 1,619,546 | -8.0% |
| Northeast Asia | 25,278,594 | 13,782,879 | 12,465,267 | 11,730,667 | -5.9% |
Source: OAG
Naturally, the economic impact on airlines has been immense. Many airlines worldwide face the threat of bankruptcy in coming months, if these declining trends continue. To hedge against these domino effects of the outbreak, U.S. airlines are requesting upwards of $60 billion in bailouts and direct assistance from the government.
COVID-19 is throwing everything up in the air—including the fate of airline companies. It’s not yet clear when these stringent travel restrictions may be lifted, but one can only hope that these airlines do not have to continue to weather the storm much longer.


Economy
Economic Growth Forecasts for G7 and BRICS Countries in 2024
The IMF has released its economic growth forecasts for 2024. How do the G7 and BRICS countries compare?


G7 & BRICS Real GDP Growth Forecasts for 2024
The International Monetary Fund’s (IMF) has released its real gross domestic product (GDP) growth forecasts for 2024, and while global growth is projected to stay steady at 3.2%, various major nations are seeing declining forecasts.
This chart visualizes the 2024 real GDP growth forecasts using data from the IMF’s 2024 World Economic Outlook for G7 and BRICS member nations along with Saudi Arabia, which is still considering an invitation to join the bloc.
Get the Key Insights of the IMF’s World Economic Outlook
Want a visual breakdown of the insights from the IMF’s 2024 World Economic Outlook report?
This visual is part of a special dispatch of the key takeaways exclusively for VC+ members.
Get the full dispatch of charts by signing up to VC+.
Mixed Economic Growth Prospects for Major Nations in 2024
Economic growth projections by the IMF for major nations are mixed, with the majority of G7 and BRICS countries forecasted to have slower growth in 2024 compared to 2023.
Only three BRICS-invited or member countries, Saudi Arabia, the UAE, and South Africa, have higher projected real GDP growth rates in 2024 than last year.
| Group | Country | Real GDP Growth (2023) | Real GDP Growth (2024P) |
|---|---|---|---|
| G7 | 🇺🇸 U.S. | 2.5% | 2.7% |
| G7 | 🇨🇦 Canada | 1.1% | 1.2% |
| G7 | 🇯🇵 Japan | 1.9% | 0.9% |
| G7 | 🇫🇷 France | 0.9% | 0.7% |
| G7 | 🇮🇹 Italy | 0.9% | 0.7% |
| G7 | 🇬🇧 UK | 0.1% | 0.5% |
| G7 | 🇩🇪 Germany | -0.3% | 0.2% |
| BRICS | 🇮🇳 India | 7.8% | 6.8% |
| BRICS | 🇨🇳 China | 5.2% | 4.6% |
| BRICS | 🇦🇪 UAE | 3.4% | 3.5% |
| BRICS | 🇮🇷 Iran | 4.7% | 3.3% |
| BRICS | 🇷🇺 Russia | 3.6% | 3.2% |
| BRICS | 🇪🇬 Egypt | 3.8% | 3.0% |
| BRICS-invited | 🇸🇦 Saudi Arabia | -0.8% | 2.6% |
| BRICS | 🇧🇷 Brazil | 2.9% | 2.2% |
| BRICS | 🇿🇦 South Africa | 0.6% | 0.9% |
| BRICS | 🇪🇹 Ethiopia | 7.2% | 6.2% |
| 🌍 World | 3.2% | 3.2% |
China and India are forecasted to maintain relatively high growth rates in 2024 at 4.6% and 6.8% respectively, but compared to the previous year, China is growing 0.6 percentage points slower while India is an entire percentage point slower.
On the other hand, four G7 nations are set to grow faster than last year, which includes Germany making its comeback from its negative real GDP growth of -0.3% in 2023.
Faster Growth for BRICS than G7 Nations
Despite mostly lower growth forecasts in 2024 compared to 2023, BRICS nations still have a significantly higher average growth forecast at 3.6% compared to the G7 average of 1%.
While the G7 countries’ combined GDP is around $15 trillion greater than the BRICS nations, with continued higher growth rates and the potential to add more members, BRICS looks likely to overtake the G7 in economic size within two decades.
BRICS Expansion Stutters Before October 2024 Summit
BRICS’ recent expansion has stuttered slightly, as Argentina’s newly-elected president Javier Milei declined its invitation and Saudi Arabia clarified that the country is still considering its invitation and has not joined BRICS yet.
Even with these initial growing pains, South Africa’s Foreign Minister Naledi Pandor told reporters in February that 34 different countries have submitted applications to join the growing BRICS bloc.
Any changes to the group are likely to be announced leading up to or at the 2024 BRICS summit which takes place October 22-24 in Kazan, Russia.
Get the Full Analysis of the IMF’s Outlook on VC+
This visual is part of an exclusive special dispatch for VC+ members which breaks down the key takeaways from the IMF’s 2024 World Economic Outlook.
For the full set of charts and analysis, sign up for VC+.

-

 Mining1 week ago
Gold vs. S&P 500: Which Has Grown More Over Five Years?
-

 Markets2 weeks ago
Ranked: The Most Valuable Housing Markets in America
-

 Money2 weeks ago
Which States Have the Highest Minimum Wage in America?
-

 AI2 weeks ago
Ranked: Semiconductor Companies by Industry Revenue Share
-

 Markets2 weeks ago
Ranked: The World’s Top Flight Routes, by Revenue
-

 Countries2 weeks ago
Population Projections: The World’s 6 Largest Countries in 2075
-

 Markets2 weeks ago
The Top 10 States by Real GDP Growth in 2023
-

 Demographics2 weeks ago
The Smallest Gender Wage Gaps in OECD Countries