Misc
Mapped: Top Countries by Tourist Spending
Mapped: Top Countries by Tourist Spending
Many people spend their days looking forward to their next getaway. But do you know exactly how much these vacation plans contribute economically to your chosen destination?
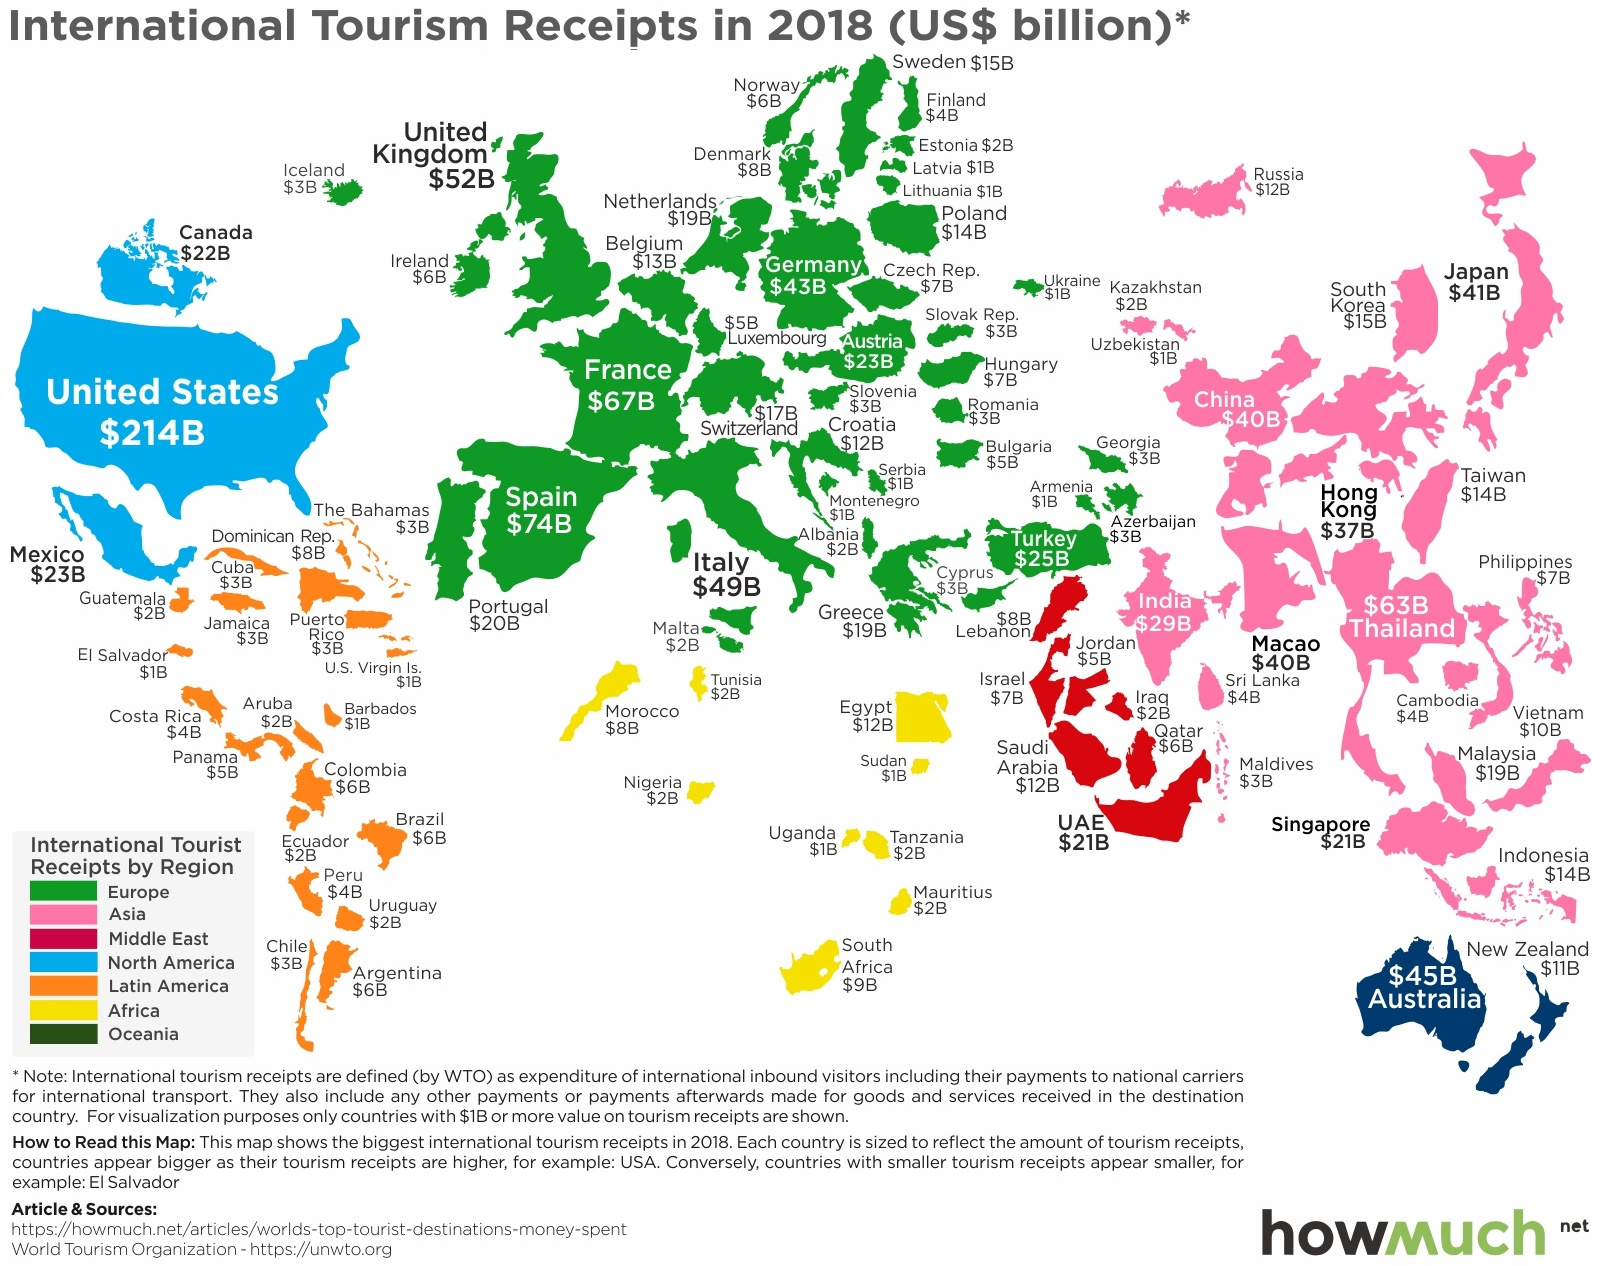
Today’s visualization from HowMuch.net highlights the countries in which tourists spend the most money. Locations have been resized based on spending amounts, which come from the latest data from the World Tourism Organization (UNWTO).
Oh, The Places Tourists Will Go
Across the different regions, Europe’s combined tourist spending dominates at $570 billion. Easy access to closely-located countries, both via rail networks and a shared currency, may be a reason why almost 710 million visitors toured the region in 2018.
Asia-Pacific, which includes Australia and numerous smaller islands, saw the greatest growth in tourism expenditures. Total spending reached $435 billion in 2018—a 7% year-over-year increase, from 348 million visitors. Not surprisingly, some areas such as Macao (SAR) tend to rely heavily on tourists as a primary economic driver.
Here’s how other continental regions fared, in terms of tourist spending and visitors:
- Americas
Total expenditures: $333 billion
Total visitors: 216 million
Expenses per visitor: $1,542 - Middle East
Total expenditures: $73 billion
Total visitors: 60 million
Expenses per visitor: $1,216 - Africa
Total expenditures: $38 billion
Total visitors: 67 million
Expenses per visitor: $567
Of course, these numbers only paint a rudimentary picture of global tourism, as they vary greatly even within these regions. Let’s look closer at the individual country data for 2018, compared to previous years.
The Top Tourist Hotspots, By Country
It seems that many tourists are gravitating towards the same destinations, as evidenced by both the number of arrivals and overall expenditures for 2017 and 2018 alike.
| Country | 2018 Spending | 2018 Arrivals | Country | 2017 Spending | 2017 Arrivals | |
|---|---|---|---|---|---|---|
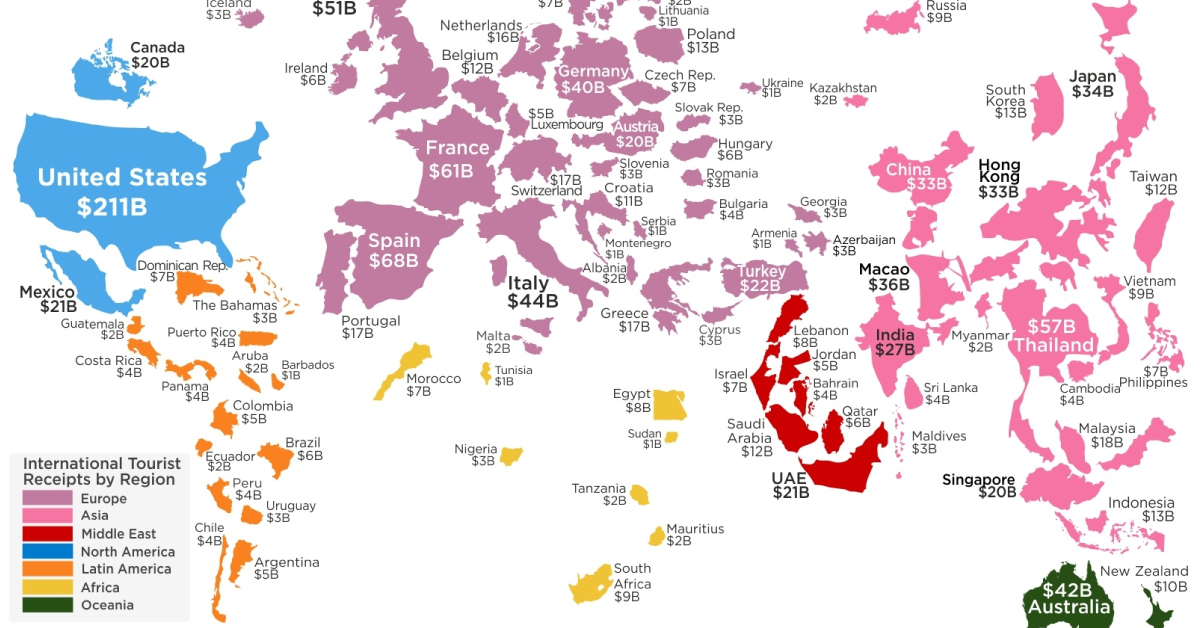
| 1. U.S. 🇺🇸 | $214.5B | 79.6M | 1. U.S. 🇺🇸 | $210.7B | 74.8M | |
| 2. Spain 🇪🇸 | $73.8B | 82.8M | 2. Spain 🇪🇸 | $68B | 81.8M | |
| 2. France 🇫🇷 | $67.4B | 89.4M | 3. France 🇫🇷 | $60.7B | 86.9M | |
| 4. Thailand 🇹🇭 | $63B | 38.3M | 4. Thailand 🇹🇭 | $57.5B | 35.4M | |
| 5. UK 🇬🇧 | $51.9B | 36.3M | 5. UK 🇬🇧 | 51.2B | 37.7M | |
| 6. Italy 🇮🇹 | $49.3B | 62.1M | 6. Italy 🇮🇹 | $44.2B | 58.3M | |
| 7. Australia 🇦🇺 | $45B | 9.2M | 7. Australia 🇦🇺 | $41.7B | 8.8M | |
| 8. Germany 🇩🇪 | $43B | 38.9M | 8. Germany 🇩🇪 | $39.8B | 37.5M | |
| 9. Japan 🇯🇵 | $41.1B | 31.2M | 9. Macao (SAR) 🇲🇴 | $35.6B | 17M | |
| 10. China 🇨🇳 | $40.4B | 62.9M | 10. Japan 🇯🇵 | $34.1B | 28.6M |
Source: World Tourism Organization (UNWTO).
Note that data is for international tourism only and does not include domestic tourism.
The top contenders have remained fairly consistent, as each country brings something unique to the table—from natural wonders to historic and man-made structures.
Where Highest-Spending Tourists Come From
The nationality of tourists also seems to be a factor in these total expenditures. Chinese tourists spent $277 billion internationally in 2018, likely thanks to the increasing consumption of an emerging, affluent middle class.
Interestingly, this amount is almost twice the combined $144 billion that American tourists spent overseas in the same year.


VC+
VC+: Get Our Key Takeaways From the IMF’s World Economic Outlook
A sneak preview of the exclusive VC+ Special Dispatch—your shortcut to understanding IMF’s World Economic Outlook report.

Have you read IMF’s latest World Economic Outlook yet? At a daunting 202 pages, we don’t blame you if it’s still on your to-do list.
But don’t worry, you don’t need to read the whole April release, because we’ve already done the hard work for you.
To save you time and effort, the Visual Capitalist team has compiled a visual analysis of everything you need to know from the report—and our upcoming VC+ Special Dispatch will be available exclusively to VC+ members on Thursday, April 25th.
If you’re not already subscribed to VC+, make sure you sign up now to receive the full analysis of the IMF report, and more (we release similar deep dives every week).
For now, here’s what VC+ members can expect to receive.
Your Shortcut to Understanding IMF’s World Economic Outlook
With long and short-term growth prospects declining for many countries around the world, this Special Dispatch offers a visual analysis of the key figures and takeaways from the IMF’s report including:
- The global decline in economic growth forecasts
- Real GDP growth and inflation forecasts for major nations in 2024
- When interest rate cuts will happen and interest rate forecasts
- How debt-to-GDP ratios have changed since 2000
- And much more!

Get the Full Breakdown in the Next VC+ Special Dispatch
VC+ members will receive the full Special Dispatch on Thursday, April 25th.
Make sure you join VC+ now to receive exclusive charts and the full analysis of key takeaways from IMF’s World Economic Outlook.
Don’t miss out. Become a VC+ member today.
What You Get When You Become a VC+ Member
VC+ is Visual Capitalist’s premium subscription. As a member, you’ll get the following:
- Special Dispatches: Deep dive visual briefings on crucial reports and global trends
- Markets This Month: A snappy summary of the state of the markets and what to look out for
- The Trendline: Weekly curation of the best visualizations from across the globe
- Global Forecast Series: Our flagship annual report that covers everything you need to know related to the economy, markets, geopolitics, and the latest tech trends
- VC+ Archive: Hundreds of previously released VC+ briefings and reports that you’ve been missing out on, all in one dedicated hub
You can get all of the above, and more, by joining VC+ today.

-

 Green1 week ago
Ranked: The Countries With the Most Air Pollution in 2023
-

 Automotive2 weeks ago
Almost Every EV Stock is Down After Q1 2024
-

 AI2 weeks ago
The Stock Performance of U.S. Chipmakers So Far in 2024
-

 Markets2 weeks ago
Charted: Big Four Market Share by S&P 500 Audits
-

 Real Estate2 weeks ago
Ranked: The Most Valuable Housing Markets in America
-

 Money2 weeks ago
Which States Have the Highest Minimum Wage in America?
-

 AI2 weeks ago
Ranked: Semiconductor Companies by Industry Revenue Share
-

 Travel2 weeks ago
Ranked: The World’s Top Flight Routes, by Revenue