Markets
Charting the Rise and Fall of the Global Luxury Goods Market


The Rise and Fall of the Global Luxury Goods Market
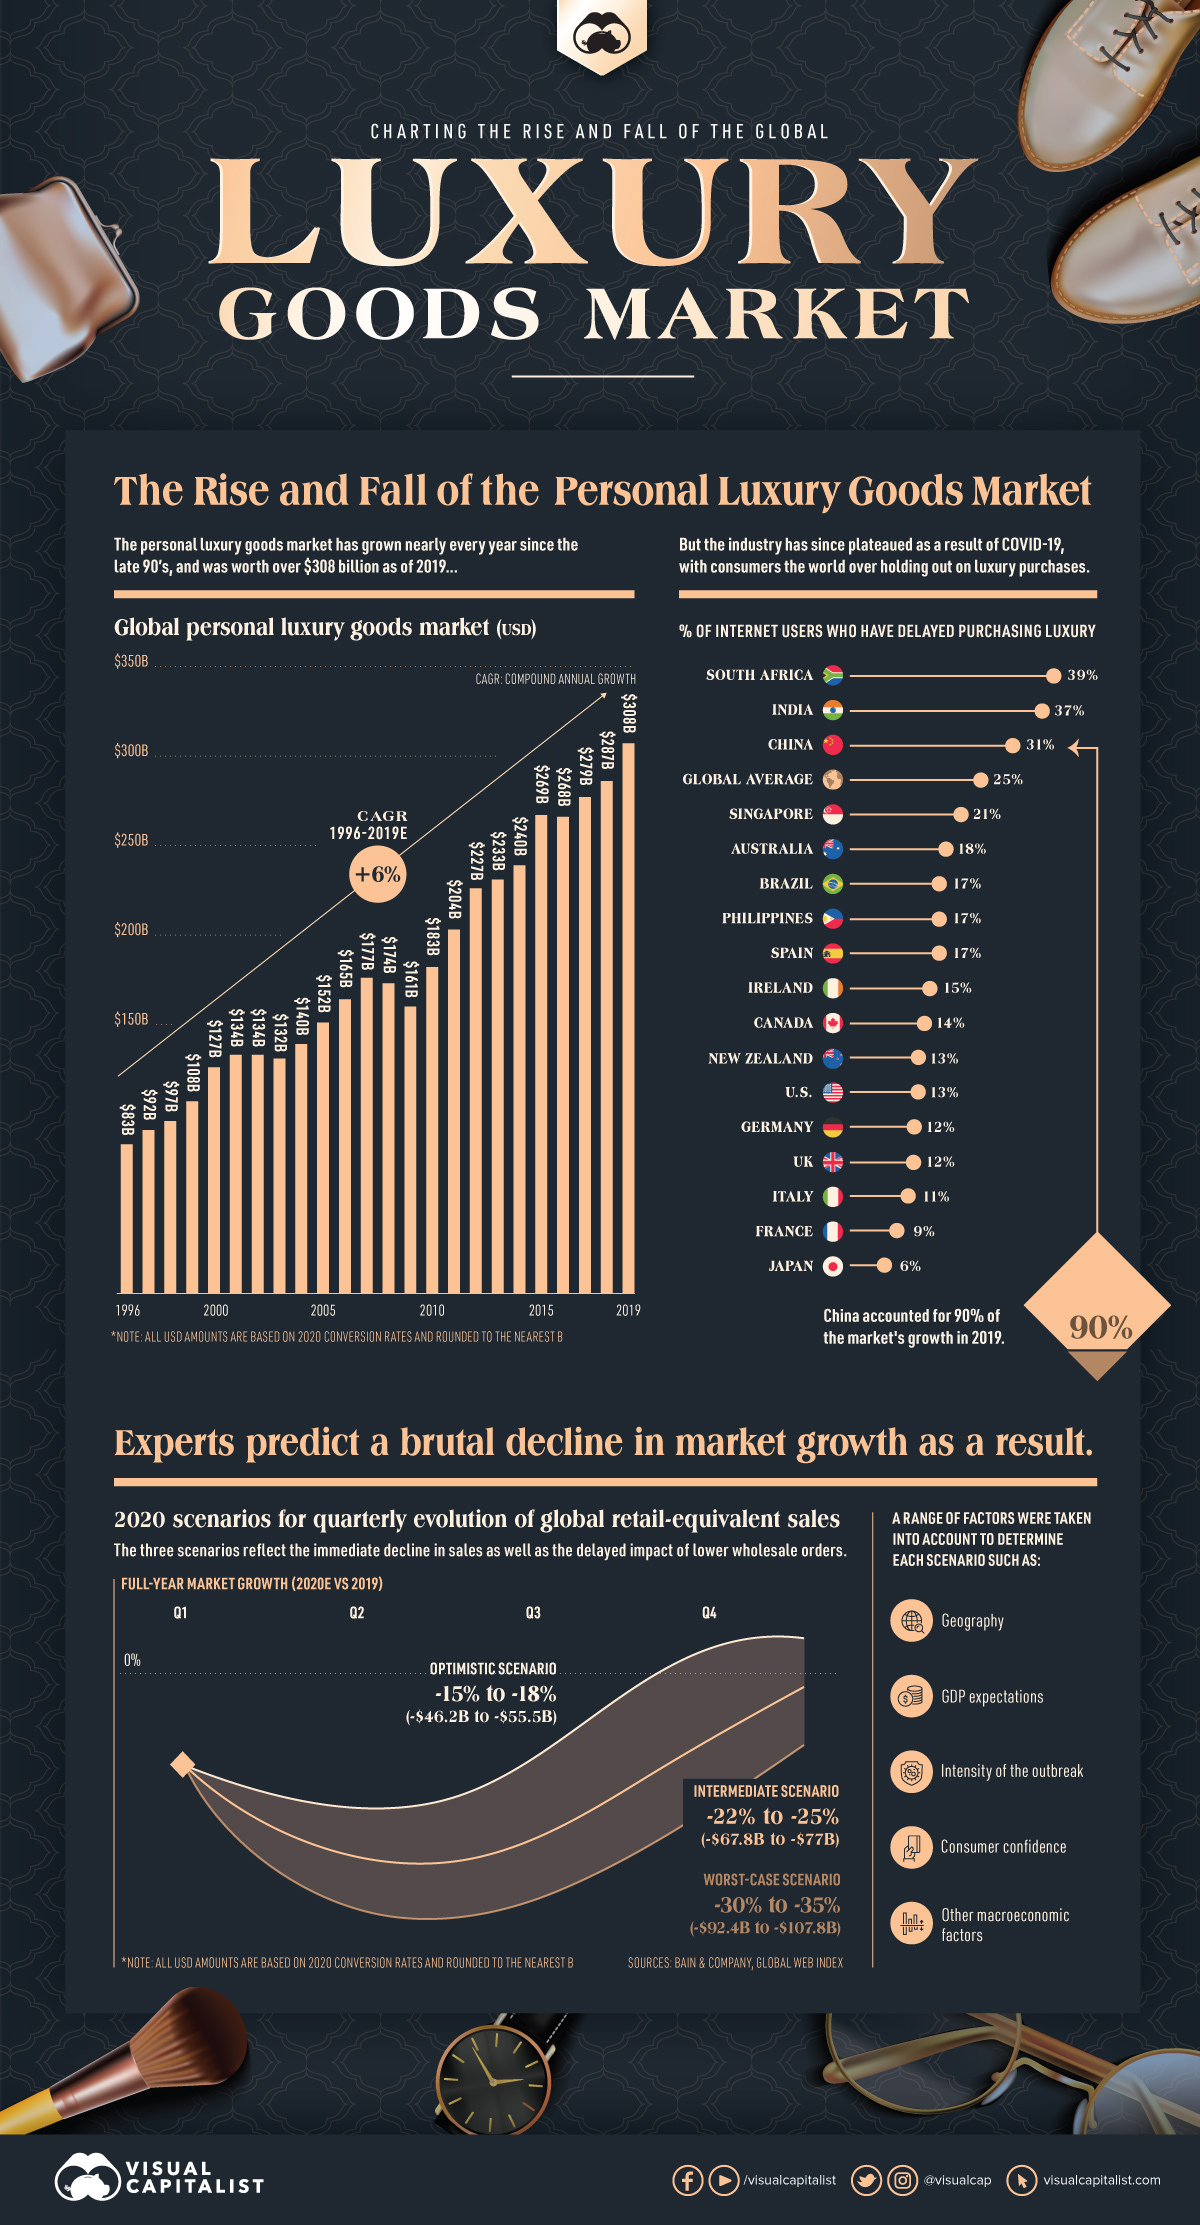
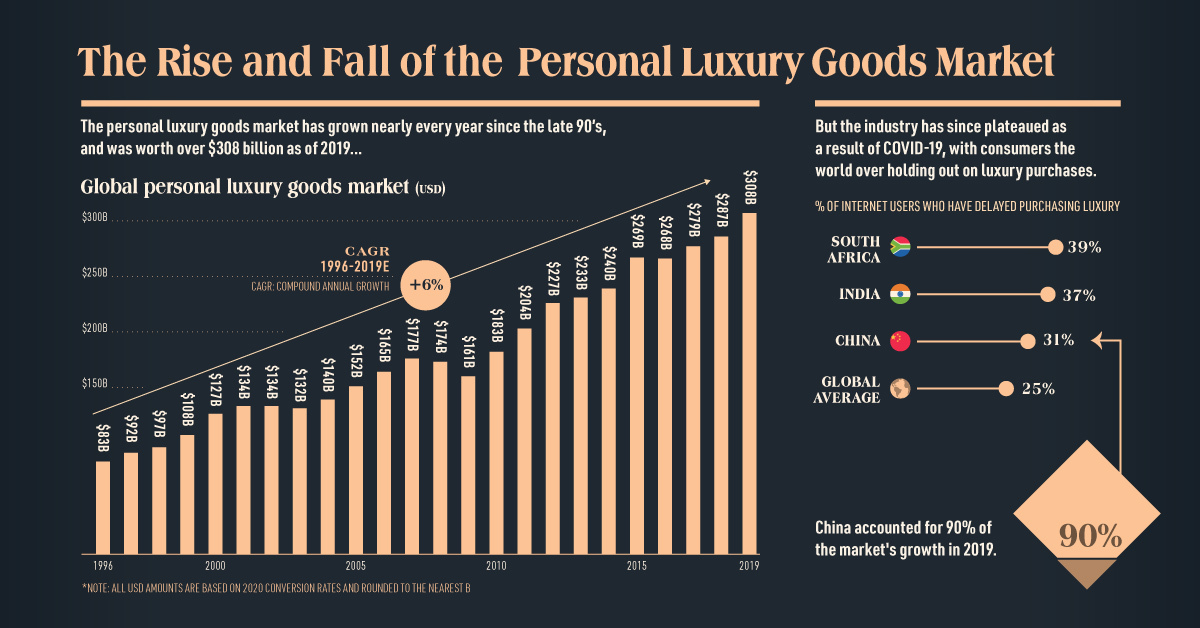
Global demand for personal luxury goods has been steadily increasing for decades, resulting in an industry worth $308 billion in 2019.
However, the insatiable desire for consumers to own nice things was suddenly interrupted by the coming of COVID-19, and experts are predicting a brutal contraction of up to one-third of the current luxury good market size this year.
Will the industry bounce back? Or will it return as something noticeably different?
A Once Promising Trajectory
The global luxury goods market—which includes beauty, apparel, and accessories—has compounded at a 6% pace since the 1990s.
Recent years of growth in the personal luxury goods market can be mostly attributed to Chinese consumers. This geographic market accounted for 90% of total sales growth in 2019, followed by the Europe and the Americas.
Analysts suggest that China’s younger luxury goods consumers in particular have significant spending power, with an average spend of $6,000 (¥41,000) per person in pre-COVID times.
An Industry Now in Distress
The lethal combination of reduced foot traffic and decreased consumer spending in the first quarter of 2020 has brought the retail industry to its knees.
In fact, more than 80% of fashion and luxury players will experience financial distress as a result of extended store closures.
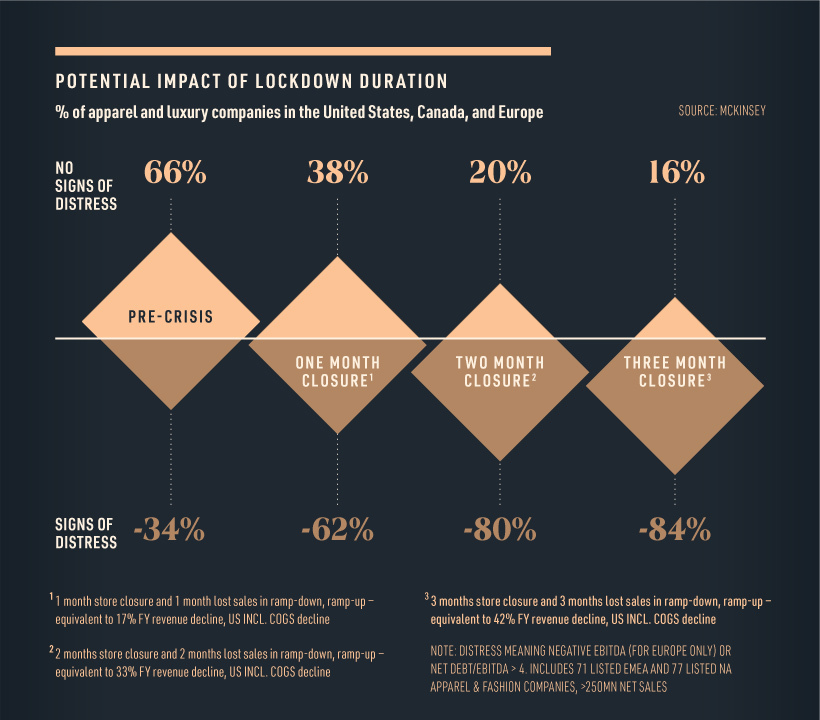
With iconic luxury retailers such as Neiman Marcus filing for bankruptcy, the pressure on the luxury industry is clear. It should be noted however, that companies who were experiencing distress before the COVID-19 outbreak will be the hardest hit.
Predicting the Collapse
In a recent report, Bain & Company estimated a 25% to 30% global luxury market contraction for the first quarter of 2020 based on several economic variables. They have also modeled three scenarios to predict the performance for the remainder of 2020.
- Optimistic scenario: A limited market contraction of 15% to 18%, assuming increased consumer demand for the second and third quarter of the year, roughly equating to a sales decline of $46 billion to $56 billion.
- Intermediate scenario: A moderate market contraction of between 22% and 25%, or $68 to $77 billion.
- Worst-case scenario: A steep contraction of between 30% and 35%, equating to $92 billion to $108 billion. This assumes a longer period of sales decline.
Although there are signs of recovery in China, the industry is not expected to fully return to 2019 levels until 2022 at the earliest. By that stage, the industry could have transformed entirely.
Changing Consumer Mindsets
Since the beginning of the pandemic, one-quarter of consumers have delayed purchasing luxury items. In fact, a portion of those who have delayed purchasing luxury goods are now considering entirely new avenues, such as seeking out cheaper alternatives.
However, most people surveyed claim that they will postpone buying luxury items until they can get a better deal on price.
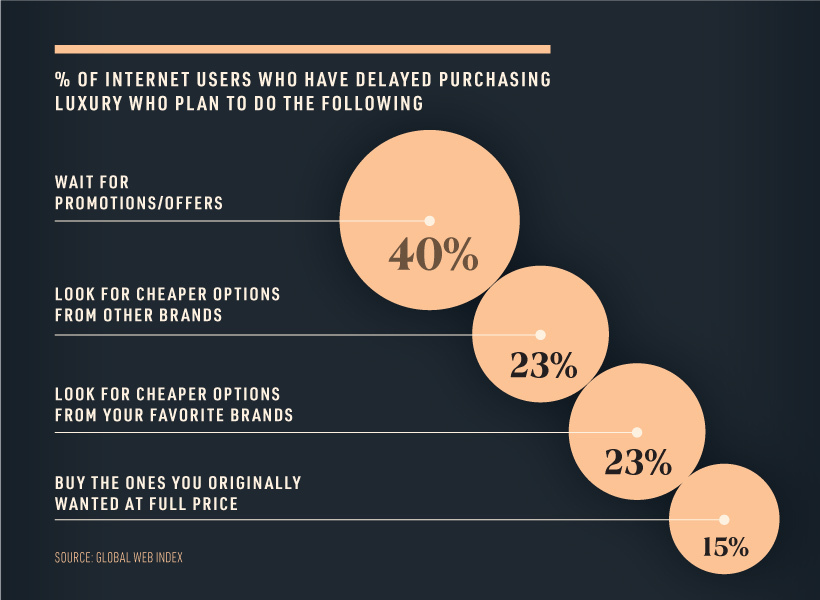
This frugal mindset could spark an interesting behavioral shift, and set the stage for a new category to emerge from the ashes—the second-hand luxury market.
Numerous sources claim that pre-owned luxury could in fact overtake the traditional luxury market, and the pandemic economy could very well be a tipping point.
The Future of Luxury
Medium-term market growth could be driven by a number of factors, from a global growing middle class and their demand for luxury products, as well as retailers’ sudden shift to e-commerce.
While analysts can only rely on predictions to determine the future of personal luxury, it is clear that the industry is at a crossroads.


Markets
The European Stock Market: Attractive Valuations Offer Opportunities
On average, the European stock market has valuations that are nearly 50% lower than U.S. valuations. But how can you access the market?


European Stock Market: Attractive Valuations Offer Opportunities
Europe is known for some established brands, from L’Oréal to Louis Vuitton. However, the European stock market offers additional opportunities that may be lesser known.
The above infographic, sponsored by STOXX, outlines why investors may want to consider European stocks.
Attractive Valuations
Compared to most North American and Asian markets, European stocks offer lower or comparable valuations.
| Index | Price-to-Earnings Ratio | Price-to-Book Ratio |
|---|---|---|
| EURO STOXX 50 | 14.9 | 2.2 |
| STOXX Europe 600 | 14.4 | 2 |
| U.S. | 25.9 | 4.7 |
| Canada | 16.1 | 1.8 |
| Japan | 15.4 | 1.6 |
| Asia Pacific ex. China | 17.1 | 1.8 |
Data as of February 29, 2024. See graphic for full index names. Ratios based on trailing 12 month financials. The price to earnings ratio excludes companies with negative earnings.
On average, European valuations are nearly 50% lower than U.S. valuations, potentially offering an affordable entry point for investors.
Research also shows that lower price ratios have historically led to higher long-term returns.
Market Movements Not Closely Connected
Over the last decade, the European stock market had low-to-moderate correlation with North American and Asian equities.
The below chart shows correlations from February 2014 to February 2024. A value closer to zero indicates low correlation, while a value of one would indicate that two regions are moving in perfect unison.
| EURO STOXX 50 | STOXX EUROPE 600 | U.S. | Canada | Japan | Asia Pacific ex. China |
|
|---|---|---|---|---|---|---|
| EURO STOXX 50 | 1.00 | 0.97 | 0.55 | 0.67 | 0.24 | 0.43 |
| STOXX EUROPE 600 | 1.00 | 0.56 | 0.71 | 0.28 | 0.48 | |
| U.S. | 1.00 | 0.73 | 0.12 | 0.25 | ||
| Canada | 1.00 | 0.22 | 0.40 | |||
| Japan | 1.00 | 0.88 | ||||
| Asia Pacific ex. China | 1.00 |
Data is based on daily USD returns.
European equities had relatively independent market movements from North American and Asian markets. One contributing factor could be the differing sector weights in each market. For instance, technology makes up a quarter of the U.S. market, but health care and industrials dominate the broader European market.
Ultimately, European equities can enhance portfolio diversification and have the potential to mitigate risk for investors.
Tracking the Market
For investors interested in European equities, STOXX offers a variety of flagship indices:
| Index | Description | Market Cap |
|---|---|---|
| STOXX Europe 600 | Pan-regional, broad market | €10.5T |
| STOXX Developed Europe | Pan-regional, broad-market | €9.9T |
| STOXX Europe 600 ESG-X | Pan-regional, broad market, sustainability focus | €9.7T |
| STOXX Europe 50 | Pan-regional, blue-chip | €5.1T |
| EURO STOXX 50 | Eurozone, blue-chip | €3.5T |
Data is as of February 29, 2024. Market cap is free float, which represents the shares that are readily available for public trading on stock exchanges.
The EURO STOXX 50 tracks the Eurozone’s biggest and most traded companies. It also underlies one of the world’s largest ranges of ETFs and mutual funds. As of November 2023, there were €27.3 billion in ETFs and €23.5B in mutual fund assets under management tracking the index.
“For the past 25 years, the EURO STOXX 50 has served as an accurate, reliable and tradable representation of the Eurozone equity market.”
— Axel Lomholt, General Manager at STOXX
Partnering with STOXX to Track the European Stock Market
Are you interested in European equities? STOXX can be a valuable partner:
- Comprehensive, liquid and investable ecosystem
- European heritage, global reach
- Highly sophisticated customization capabilities
- Open architecture approach to using data
- Close partnerships with clients
- Part of ISS STOXX and Deutsche Börse Group
With a full suite of indices, STOXX can help you benchmark against the European stock market.
Learn how STOXX’s European indices offer liquid and effective market access.

-

 Economy2 days ago
Economic Growth Forecasts for G7 and BRICS Countries in 2024
The IMF has released its economic growth forecasts for 2024. How do the G7 and BRICS countries compare?
-

 Markets1 week ago
U.S. Debt Interest Payments Reach $1 Trillion
U.S. debt interest payments have surged past the $1 trillion dollar mark, amid high interest rates and an ever-expanding debt burden.
-

 United States2 weeks ago
Ranked: The Largest U.S. Corporations by Number of Employees
We visualized the top U.S. companies by employees, revealing the massive scale of retailers like Walmart, Target, and Home Depot.
-

 Markets2 weeks ago
The Top 10 States by Real GDP Growth in 2023
This graphic shows the states with the highest real GDP growth rate in 2023, largely propelled by the oil and gas boom.
-

 Markets2 weeks ago
Ranked: The World’s Top Flight Routes, by Revenue
In this graphic, we show the highest earning flight routes globally as air travel continued to rebound in 2023.
-

 Markets3 weeks ago
Ranked: The Most Valuable Housing Markets in America
The U.S. residential real estate market is worth a staggering $47.5 trillion. Here are the most valuable housing markets in the country.


-

 Education1 week ago
How Hard Is It to Get Into an Ivy League School?
-

 Technology2 weeks ago
Ranked: Semiconductor Companies by Industry Revenue Share
-
Markets2 weeks ago
Ranked: The World’s Top Flight Routes, by Revenue
-

 Demographics2 weeks ago
Population Projections: The World’s 6 Largest Countries in 2075
-
Markets2 weeks ago
The Top 10 States by Real GDP Growth in 2023
-

 Demographics2 weeks ago
The Smallest Gender Wage Gaps in OECD Countries
-

 Economy2 weeks ago
Where U.S. Inflation Hit the Hardest in March 2024
-

 Green2 weeks ago
Top Countries By Forest Growth Since 2001