Connect with us

Healthcare

Where COVID-19 is Rising and Falling Around the World

Published

on

Where covid-19 is rising and falling

Where COVID-19 is Rising and Falling Around the World

It’s been just over two months since New York declared a state of emergency, and global stock markets were hammered as the fears of a full-blown crisis began to take hold.

Since then, we’ve seen detailed, daily coronavirus coverage in most of the major news outlets. With such a wealth of information available, it can be hard to keep track of the big picture of what’s happening around the world.

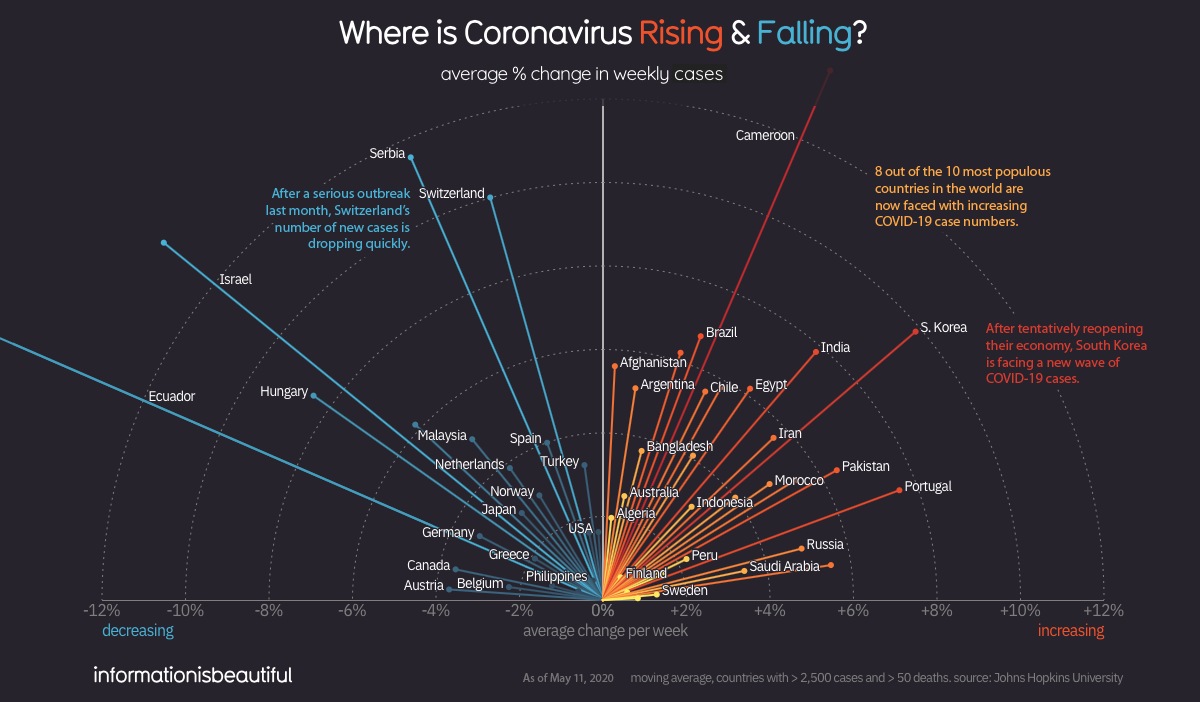
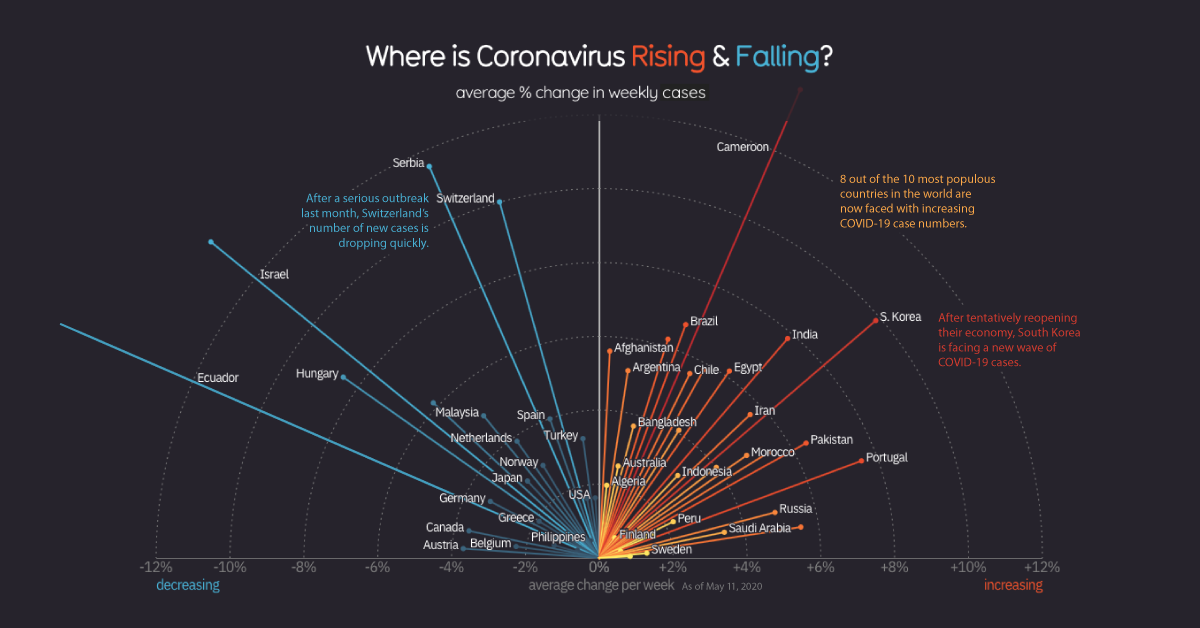
Today’s graphic, adapted from Information is Beautiful, is an efficient look at where the virus is fading away, and where new infection hotspots are emerging.

The Ebb and Flow of Coronavirus Cases

First, the good news: the number of new confirmed COVID-19 cases has started to level off on a global basis. This metric was rising rapidly until the beginning of April โ€” but since then, it has plateaued and is holding steady (for now).

global new covid-19 cases

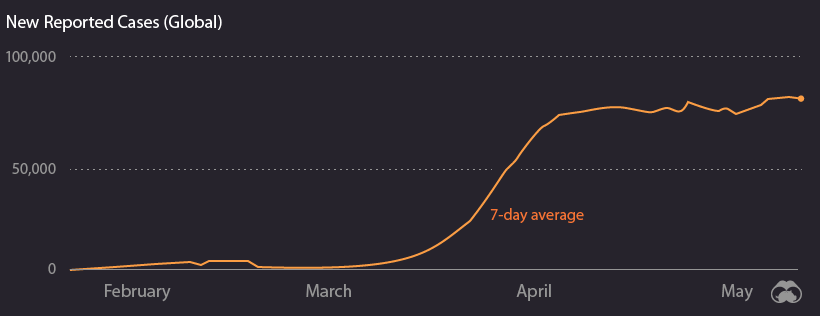
Of course, the global total doesn’t tell the whole story. Different countries, and even regions within countries, are in very different phases of dealing with the pandemic.

Let’s look at the current situation around the world.

New Cases: Falling

Many of the countries that experienced early outbreaks of COVID-19 are now seeing a drop-off in the number of new cases.

countries new covid-19 cases falling

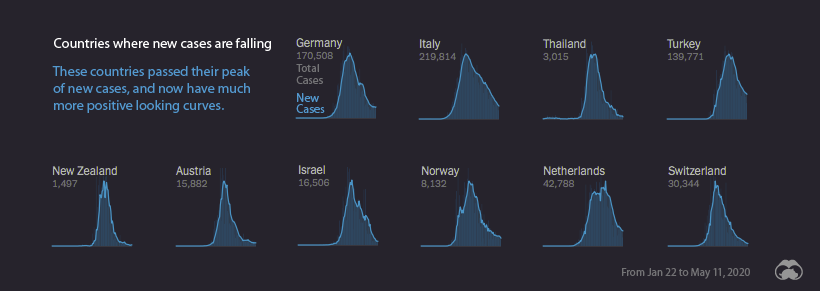
Italy, which experienced one of the most severe outbreaks, is finally emerging from the world’s longest nationwide lockdown. Switzerland and the Netherlands both had some of the highest confirmed case rates per capita, but are now in better situations as fresh cases drop off.

The narrow, pointy curves exhibited by New Zealand and Austria give us an indication of where containment measures were successful at curbing the spread of the virus. This type of pronounced curve is less common, and is generally seen in nations with smaller populations.

New Cases: Leveling Off

For many of the world’s major economies, containing the spread of the virus has proven exceptionally difficult. Despite increased testing and lockdown measures, the United States still has one of the steepest infection trajectory curves. The UK also has a very similar new case curve.

countries new covid-19 cases steady

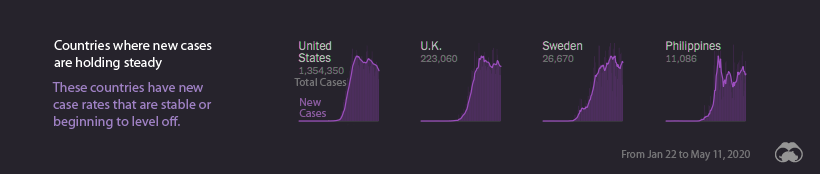
Even as countries’ curves begin to flatten and level off, there is still a danger of new flare-ups of the virus โ€“ as is now the case in South Korea and China. Even in Singapore, which saw early success in containing the virus, is experiencing a rise in new COVID-19 cases.

New Cases: Rising

Some countries โ€“ particularly developing economies โ€“ are only in the beginning stages of facing COVID-19’s rapid spread. This is a cause for concern, as many of the countries with steeply rising curves have larger populations and fewer resources to deal with a pandemic.

countries where new covid-19 cases are rising

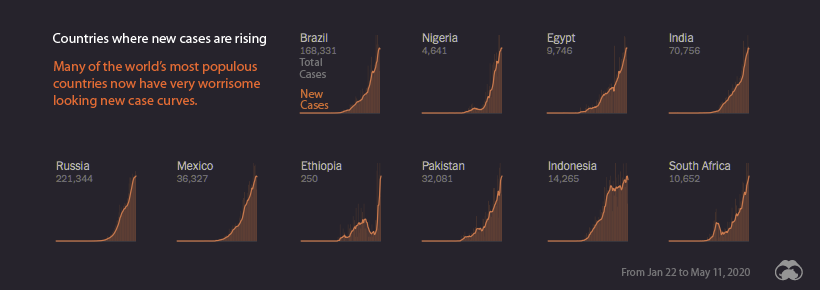
In late March, as the virus was spreading rapidly through Europe, Russia appeared to have avoided an outbreak within its borders. Today, however, that situation is much different. Russia has the world’s steepest infection trajectory curve, with the number of cases on a course to double roughly every five days.

The countries in the image above have a combined population of 2.8 billion people, so as COVID-19 continues to spread through those countries, the eyes of the world will be watching.

Subscribe to Visual Capitalist
Click for Comments

Countries

Charted: The Worldโ€™s Aging Population from 1950 to 2100

This graphic visualizes the worldโ€™s aging population, showing data for every country and territory around the world.

Published

on

Charted: The Worldโ€™s Aging Population from 1950 to 2100

As demographics continue to shift in the 21st century, the worldโ€™s aging population will continue to be a focal point for many global decision makers.

Most countries around the world have experienced population explosions, or are about to. Combine this with declining birth rates and falling mortality rates, and it’s clear that the global senior population will continue to reach new heights.

These graphics by Pablo Alvarez use data from the 2022 UN World Population Prospects to visualize this increasing aging population across countries.

The Worldโ€™s Aging Population from 1950 to 2100

In 2022, there were 771 million people aged 65+ years globally, accounting for almost 10% of the world’s population.

This segment has been growing at an increasing rate, and it’s expected to hit 16% in 2050, and eventually 24% by 2100. Here’s what that’s projected to look like, for every country and territory.

Country by Population Aged +65 Years195020222100
๐Ÿ‡ฆ๐Ÿ‡ซ Afghanistan2.85%2.39%16.03%
๐Ÿ‡ฆ๐Ÿ‡ฑ Albania6.04%16.66%49.08%
๐Ÿ‡ฉ๐Ÿ‡ฟ Algeria3.49%6.39%28.83%
๐Ÿ‡ฆ๐Ÿ‡ธ American Samoa2.38%7.27%45.41%
๐Ÿ‡ฆ๐Ÿ‡ฉ Andorra10.02%14.98%37.04%
๐Ÿ‡ฆ๐Ÿ‡ด Angola2.93%2.6%12.07%
๐Ÿ‡ฆ๐Ÿ‡ฎ Anguilla3.69%10.71%37.49%
๐Ÿ‡ฆ๐Ÿ‡ฌ Antigua and Barbuda4.14%10.63%35.4%
๐Ÿ‡ฆ๐Ÿ‡ท Argentina4.13%11.92%31.79%
๐Ÿ‡ฆ๐Ÿ‡ฒ Armenia8.17%13.15%36.13%
๐Ÿ‡ฆ๐Ÿ‡ผ Aruba1.77%16.15%36.51%
๐Ÿ‡ฆ๐Ÿ‡บ Australia8.17%16.9%31.38%
๐Ÿ‡ฆ๐Ÿ‡น Austria10.42%19.81%33.93%
๐Ÿ‡ฆ๐Ÿ‡ฟ Azerbaijan6.89%7.11%30.5%
๐Ÿ‡ง๐Ÿ‡ธ Bahamas4.76%8.89%29.58%
๐Ÿ‡ง๐Ÿ‡ญ Bahrain2.88%3.76%21.89%
๐Ÿ‡ง๐Ÿ‡ฉ Bangladesh3.9%6.04%32.56%
๐Ÿ‡ง๐Ÿ‡ง Barbados5.24%16.28%33.19%
๐Ÿ‡ง๐Ÿ‡พ Belarus8.24%17.18%30.45%
๐Ÿ‡ง๐Ÿ‡ช Belgium11.03%19.73%32.83%
๐Ÿ‡ง๐Ÿ‡ฟ Belize3.57%5.09%29.21%
๐Ÿ‡ง๐Ÿ‡ฏ Benin7.85%3.06%11.03%
๐Ÿ‡ง๐Ÿ‡ฒ Bermuda5.71%20.41%37.73%
๐Ÿ‡ง๐Ÿ‡น Bhutan2.53%6.25%33.35%
๐Ÿ‡ง๐Ÿ‡ด Bolivia6.11%4.85%21.75%
๐Ÿ‡ง๐Ÿ‡ถ Bonaire Sint Eustatius and Saba14.22%13.84%28.94%
๐Ÿ‡ง๐Ÿ‡ฆ Bosnia and Herzegovina3.95%18.4%36.4%
๐Ÿ‡ง๐Ÿ‡ผ Botswana4.32%3.65%17.96%
๐Ÿ‡ง๐Ÿ‡ท Brazil2.39%9.88%33.52%
๐Ÿ‡ป๐Ÿ‡ฌ British Virgin Islands8.63%9.95%32.47%
๐Ÿ‡ง๐Ÿ‡ณ Brunei4.85%6.17%30.93%
๐Ÿ‡ง๐Ÿ‡ฌ Bulgaria6.66%22.38%37.13%
๐Ÿ‡ง๐Ÿ‡ซ Burkina Faso2.01%2.53%13.07%
๐Ÿ‡ง๐Ÿ‡ฎ Burundi3.22%2.48%13.23%
๐Ÿ‡ฐ๐Ÿ‡ญ Cambodia2.67%5.81%26.43%
๐Ÿ‡จ๐Ÿ‡ฒ Cameroon3.47%2.67%11.89%
๐Ÿ‡จ๐Ÿ‡ฆ Canada7.7%19.03%31.55%
๐Ÿ‡จ๐Ÿ‡ป Cape Verde3.67%5.55%32.63%
๐Ÿ‡ฐ๐Ÿ‡พ Cayman Islands6.05%8.17%28.75%
๐Ÿ‡จ๐Ÿ‡ซ Central African Republic5.%2.51%11.43%
๐Ÿ‡น๐Ÿ‡ฉ Chad4.33%2.01%9.64%
๐Ÿ‡จ๐Ÿ‡ฑ Chile3.3%13.03%36.61%
๐Ÿ‡จ๐Ÿ‡ณ China5.04%13.72%40.93%
๐Ÿ‡จ๐Ÿ‡ด Colombia3.22%9.%34.49%
๐Ÿ‡ฐ๐Ÿ‡ฒ Comoros3.8%4.28%17.81%
๐Ÿ‡จ๐Ÿ‡ฌ Congo3.36%2.72%11.99%
๐Ÿ‡จ๐Ÿ‡ฐ Cook Islands2.94%11.73%29.75%
๐Ÿ‡จ๐Ÿ‡ท Costa Rica2.97%10.83%36.99%
๐Ÿ‡จ๐Ÿ‡ฎ Cote d'Ivoire2.21%2.4%10.86%
๐Ÿ‡ญ๐Ÿ‡ท Croatia7.82%22.36%37.03%
๐Ÿ‡จ๐Ÿ‡บ Cuba4.36%15.81%36.31%
๐Ÿ‡จ๐Ÿ‡ผ Curacao5.82%14.95%30.46%
๐Ÿ‡จ๐Ÿ‡พ Cyprus5.95%14.83%33.36%
๐Ÿ‡จ๐Ÿ‡ฟ Czechia8.29%20.64%26.94%
๐Ÿ‡จ๐Ÿ‡ฉ Democratic Republic of Congo3.77%2.92%10.62%
๐Ÿ‡ฉ๐Ÿ‡ฐ Denmark9.04%20.49%30.45%
๐Ÿ‡ฉ๐Ÿ‡ฏ Djibouti1.99%4.54%19.68%
๐Ÿ‡ฉ๐Ÿ‡ฒ Dominica7.67%9.53%34.28%
๐Ÿ‡ฉ๐Ÿ‡ด Dominican Republic2.72%7.4%30.47%
๐Ÿ‡ช๐Ÿ‡จ Ecuador5.2%7.83%31.97%
๐Ÿ‡ช๐Ÿ‡ฌ Egypt2.95%4.83%21.77%
๐Ÿ‡ธ๐Ÿ‡ป El Salvador3.93%8.22%36.02%
๐Ÿ‡ฌ๐Ÿ‡ถ Equatorial Guinea5.53%3.12%15.13%
๐Ÿ‡ช๐Ÿ‡ท Eritrea3.2%4.01%19.86%
๐Ÿ‡ช๐Ÿ‡ช Estonia10.56%20.58%34.15%
๐Ÿ‡ธ๐Ÿ‡ฟ Eswatini2.68%4.%16.26%
๐Ÿ‡ช๐Ÿ‡น Ethiopia3.01%3.14%18.6%
๐Ÿ‡ซ๐Ÿ‡ด Faeroe Islands7.59%17.92%26.91%
๐Ÿ‡ซ๐Ÿ‡ฐ Falkland Islands8.27%11.08%35.86%
๐Ÿ‡ซ๐Ÿ‡ฏ Fiji5.99%5.9%20.6%
๐Ÿ‡ซ๐Ÿ‡ฎ Finland6.63%23.27%34.04%
๐Ÿ‡ซ๐Ÿ‡ท France11.39%21.66%34.23%
๐Ÿ‡ฌ๐Ÿ‡ซ French Guiana7.96%5.98%21.13%
๐Ÿ‡ต๐Ÿ‡ซ French Polynesia3.%10.07%37.85%
๐Ÿ‡ฌ๐Ÿ‡ฆ Gabon7.21%3.89%16.25%
๐Ÿ‡ฌ๐Ÿ‡ฒ Gambia2.5%2.43%16.06%
๐Ÿ‡ฌ๐Ÿ‡ช Georgia9.35%14.61%31.19%
๐Ÿ‡ฉ๐Ÿ‡ช Germany9.46%22.41%33.72%
๐Ÿ‡ฌ๐Ÿ‡ญ Ghana4.62%3.55%15.91%
๐Ÿ‡ฌ๐Ÿ‡ฎ Gibraltar6.94%20.84%37.63%
๐Ÿ‡ฌ๐Ÿ‡ท Greece6.8%22.82%37.52%
๐Ÿ‡ฌ๐Ÿ‡ฑ Greenland3.06%10.02%29.16%
๐Ÿ‡ฌ๐Ÿ‡ฉ Grenada5.12%10.07%30.54%
๐Ÿ‡ฌ๐Ÿ‡ต Guadeloupe5.51%20.04%34.45%
๐Ÿ‡ฌ๐Ÿ‡บ Guam1.11%11.84%31.19%
๐Ÿ‡ฌ๐Ÿ‡น Guatemala2.31%4.91%28.05%
๐Ÿ‡ฌ๐Ÿ‡ฌ Guernsey11.96%16.64%35.4%
๐Ÿ‡ฌ๐Ÿ‡ณ Guinea5.39%3.32%14.%
๐Ÿ‡ฌ๐Ÿ‡ผ Guinea-Bissau3.45%2.82%14.34%
๐Ÿ‡ฌ๐Ÿ‡พ Guyana3.89%6.28%28.94%
๐Ÿ‡ญ๐Ÿ‡น Haiti3.64%4.54%19.07%
๐Ÿ‡ญ๐Ÿ‡ณ Honduras3.96%4.27%26.5%
๐Ÿ‡ญ๐Ÿ‡ฐ Hong Kong2.48%20.47%41.64%
๐Ÿ‡ญ๐Ÿ‡บ Hungary7.81%20.01%31.85%
๐Ÿ‡ฎ๐Ÿ‡ธ Iceland7.52%15.33%34.25%
๐Ÿ‡ฎ๐Ÿ‡ณ India3.1%6.9%29.81%
๐Ÿ‡ฎ๐Ÿ‡ฉ Indonesia1.74%6.86%25.28%
๐Ÿ‡ฎ๐Ÿ‡ท Iran5.22%7.62%33.72%
๐Ÿ‡ฎ๐Ÿ‡ถ Iraq2.79%3.41%18.44%
๐Ÿ‡ฎ๐Ÿ‡ช Ireland10.99%15.14%32.48%
๐Ÿ‡ฎ๐Ÿ‡ฒ Isle of Man13.9%22.29%31.8%
๐Ÿ‡ฎ๐Ÿ‡ฑ Israel4.%12.04%25.97%
๐Ÿ‡ฎ๐Ÿ‡น Italy8.09%24.05%38.19%
๐Ÿ‡ฏ๐Ÿ‡ฒ Jamaica3.83%7.45%44.05%
๐Ÿ‡ฏ๐Ÿ‡ต Japan4.89%29.92%38.7%
๐Ÿ‡ฏ๐Ÿ‡ช Jersey12.34%16.22%30.52%
๐Ÿ‡ฏ๐Ÿ‡ด Jordan5.03%3.84%27.3%
๐Ÿ‡ฐ๐Ÿ‡ฟ Kazakhstan6.47%8.04%19.58%
๐Ÿ‡ฐ๐Ÿ‡ช Kenya5.28%2.87%16.98%
๐Ÿ‡ฐ๐Ÿ‡ฎ Kiribati7.13%3.81%17.33%
๐Ÿ‡ฝ๐Ÿ‡ฐ Kosovo5.33%10.19%43.35%
๐Ÿ‡ฐ๐Ÿ‡ผ Kuwait2.88%4.93%31.56%
๐Ÿ‡ฐ๐Ÿ‡ฌ Kyrgyzstan7.91%4.54%21.08%
๐Ÿ‡ฑ๐Ÿ‡ฆ Laos2.13%4.45%25.24%
๐Ÿ‡ฑ๐Ÿ‡ป Latvia10.12%21.86%32.86%
๐Ÿ‡ฑ๐Ÿ‡ง Lebanon7.24%9.89%32.11%
๐Ÿ‡ฑ๐Ÿ‡ธ Lesotho6.34%4.2%13.44%
๐Ÿ‡ฑ๐Ÿ‡ท Liberia2.97%3.31%13.88%
๐Ÿ‡ฑ๐Ÿ‡พ Libya5.21%4.86%27.77%
๐Ÿ‡ฑ๐Ÿ‡ฎ Liechtenstein7.89%19.37%34.79%
๐Ÿ‡ฑ๐Ÿ‡น Lithuania8.65%20.8%32.79%
๐Ÿ‡ฑ๐Ÿ‡บ Luxembourg9.71%15.03%31.55%
๐Ÿ‡ฒ๐Ÿ‡ด Macao3.11%13.%32.39%
๐Ÿ‡ฒ๐Ÿ‡ฌ Madagascar3.25%3.35%16.21%
๐Ÿ‡ฒ๐Ÿ‡ผ Malawi3.06%2.61%15.61%
๐Ÿ‡ฒ๐Ÿ‡พ Malaysia4.91%7.5%30.78%
๐Ÿ‡ฒ๐Ÿ‡ป Maldives3.14%4.78%35.61%
๐Ÿ‡ฒ๐Ÿ‡ฑ Mali2.78%2.38%11.%
๐Ÿ‡ฒ๐Ÿ‡น Malta7.42%19.13%38.26%
๐Ÿ‡ฒ๐Ÿ‡ญ Marshall Islands5.68%4.56%17.8%
๐Ÿ‡ฒ๐Ÿ‡ถ Martinique5.85%22.77%37.31%
๐Ÿ‡ฒ๐Ÿ‡ท Mauritania1.44%3.22%15.03%
๐Ÿ‡ฒ๐Ÿ‡บ Mauritius3.18%12.79%33.76%
๐Ÿ‡พ๐Ÿ‡น Mayotte6.61%2.88%18.15%
๐Ÿ‡ฒ๐Ÿ‡ฝ Mexico2.99%8.32%34.88%
๐Ÿ‡ซ๐Ÿ‡ฒ Micronesia (country)4.11%6.16%27.59%
๐Ÿ‡ฒ๐Ÿ‡ฉ Moldova7.56%12.98%26.36%
๐Ÿ‡ฒ๐Ÿ‡จ Monaco15.64%35.92%30.16%
๐Ÿ‡ฒ๐Ÿ‡ณ Mongolia3.87%4.61%26.18%
๐Ÿ‡ฒ๐Ÿ‡ช Montenegro7.85%16.55%34.16%
๐Ÿ‡ฒ๐Ÿ‡ธ Montserrat7.92%17.7%33.05%
๐Ÿ‡ฒ๐Ÿ‡ฆ Morocco2.86%7.72%29.97%
๐Ÿ‡ฒ๐Ÿ‡ฟ Mozambique3.13%2.57%13.43%
๐Ÿ‡ฒ๐Ÿ‡ฒ Myanmar3.21%6.82%23.69%
๐Ÿ‡ณ๐Ÿ‡ฆ Namibia4.1%3.97%15.38%
๐Ÿ‡ณ๐Ÿ‡ท Nauru8.98%2.5%15.87%
๐Ÿ‡ณ๐Ÿ‡ต Nepal2.74%6.09%29.51%
๐Ÿ‡ณ๐Ÿ‡ฑ Netherlands7.76%20.31%32.89%
๐Ÿ‡ณ๐Ÿ‡จ New Caledonia5.%11.02%31.61%
๐Ÿ‡ณ๐Ÿ‡ฟ New Zealand9.09%16.31%33.2%
๐Ÿ‡ณ๐Ÿ‡ฎ Nicaragua2.71%5.29%28.92%
๐Ÿ‡ณ๐Ÿ‡ช Niger.92%2.4%9.76%
๐Ÿ‡ณ๐Ÿ‡ฌ Nigeria3.%2.97%12.31%
๐Ÿ‡ณ๐Ÿ‡บ Niue4.79%15.16%22.55%
๐Ÿ‡ฐ๐Ÿ‡ต North Korea2.72%11.71%30.49%
๐Ÿ‡ฒ๐Ÿ‡ฐ North Macedonia5.87%14.91%36.56%
๐Ÿ‡ฒ๐Ÿ‡ต Northern Mariana Islands2.95%10.81%32.09%
๐Ÿ‡ณ๐Ÿ‡ด Norway9.52%18.44%31.65%
๐Ÿ‡ด๐Ÿ‡ฒ Oman3.05%2.76%23.96%
๐Ÿ‡ต๐Ÿ‡ฐ Pakistan5.48%4.27%17.23%
๐Ÿ‡ต๐Ÿ‡ผ Palau8.59%9.93%21.48%
๐Ÿ‡ต๐Ÿ‡ธ Palestine4.77%3.53%23.44%
๐Ÿ‡ต๐Ÿ‡ฆ Panama3.57%8.77%30.03%
๐Ÿ‡ต๐Ÿ‡ฌ Papua New Guinea1.09%3.19%16.81%
๐Ÿ‡ต๐Ÿ‡พ Paraguay3.73%6.26%26.51%
๐Ÿ‡ต๐Ÿ‡ช Peru3.43%8.41%30.33%
๐Ÿ‡ต๐Ÿ‡ญ Philippines3.56%5.44%23.38%
๐Ÿ‡ต๐Ÿ‡ฑ Poland5.22%18.55%35.69%
๐Ÿ‡ต๐Ÿ‡น Portugal7.%22.9%36.28%
๐Ÿ‡ต๐Ÿ‡ท Puerto Rico3.63%22.93%48.9%
๐Ÿ‡ถ๐Ÿ‡ฆ Qatar3.5%1.52%15.01%
๐Ÿ‡ท๐Ÿ‡ช Reunion3.81%13.28%32.4%
๐Ÿ‡ท๐Ÿ‡ด Romania7.16%18.64%32.22%
๐Ÿ‡ท๐Ÿ‡บ Russia4.8%15.8%27.86%
๐Ÿ‡ท๐Ÿ‡ผ Rwanda2.76%3.2%17.36%
๐Ÿ‡ง๐Ÿ‡ฑ Saint Barthlemy7.3%10.61%43.89%
๐Ÿ‡ธ๐Ÿ‡ญ Saint Helena8.63%28.66%32.61%
๐Ÿ‡ฐ๐Ÿ‡ณ Saint Kitts and Nevis5.36%10.13%29.79%
๐Ÿ‡ฑ๐Ÿ‡จ Saint Lucia3.59%9.23%33.39%
๐Ÿ‡ฒ๐Ÿ‡ซ Saint Martin (French part)4.47%11.14%30.08%
๐Ÿ‡ต๐Ÿ‡ฒ Saint Pierre and Miquelon6.34%17.32%33.4%
๐Ÿ‡ป๐Ÿ‡จ Saint Vincent and the Grenadines7.71%10.86%32.34%
๐Ÿ‡ผ๐Ÿ‡ธ Samoa2.52%5.22%18.75%
๐Ÿ‡ธ๐Ÿ‡ฒ San Marino10.15%20.47%35.73%
๐Ÿ‡ธ๐Ÿ‡น Sao Tome and Principe3.92%3.76%15.6%
๐Ÿ‡ธ๐Ÿ‡ฆ Saudi Arabia3.32%2.81%30.28%
๐Ÿ‡ธ๐Ÿ‡ณ Senegal3.42%3.14%16.54%
๐Ÿ‡ท๐Ÿ‡ธ Serbia6.15%20.56%37.55%
๐Ÿ‡ธ๐Ÿ‡จ Seychelles10.68%8.16%28.84%
๐Ÿ‡ธ๐Ÿ‡ฑ Sierra Leone3.02%3.14%15.52%
๐Ÿ‡ธ๐Ÿ‡ฌ Singapore2.29%15.12%36.51%
๐Ÿ‡ธ๐Ÿ‡ฝ Sint Maarten (Dutch part)12.03%10.57%34.51%
๐Ÿ‡ธ๐Ÿ‡ฐ Slovakia6.63%16.98%33.4%
๐Ÿ‡ธ๐Ÿ‡ฎ Slovenia7.52%20.96%33.59%
๐Ÿ‡ธ๐Ÿ‡ง Solomon Islands4.03%3.47%15.29%
๐Ÿ‡ธ๐Ÿ‡ด Somalia2.6%2.57%10.75%
๐Ÿ‡ฟ๐Ÿ‡ฆ South Africa4.06%5.89%20.55%
๐Ÿ‡ฐ๐Ÿ‡ท South Korea2.74%17.49%44.44%
๐Ÿ‡ธ๐Ÿ‡ธ South Sudan3.48%2.89%13.11%
๐Ÿ‡ช๐Ÿ‡ธ Spain7.23%20.27%38.72%
๐Ÿ‡ฑ๐Ÿ‡ฐ Sri Lanka8.76%11.54%35.73%
๐Ÿ‡ธ๐Ÿ‡ฉ Sudan3.03%3.5%13.28%
๐Ÿ‡ธ๐Ÿ‡ท Suriname4.09%7.39%25.8%
๐Ÿ‡ธ๐Ÿ‡ช Sweden10.19%20.25%31.83%
๐Ÿ‡จ๐Ÿ‡ญ Switzerland9.49%19.31%32.61%
๐Ÿ‡ธ๐Ÿ‡พ Syria7.66%4.68%24.62%
๐Ÿ‡น๐Ÿ‡ผ Taiwan2.11%16.71%37.32%
๐Ÿ‡น๐Ÿ‡ฏ Tajikistan4.34%3.47%19.43%
๐Ÿ‡น๐Ÿ‡ฟ Tanzania2.2%3.1%14.97%
๐Ÿ‡น๐Ÿ‡ญ Thailand3.21%15.21%39.17%
๐Ÿ‡น๐Ÿ‡ฑ Timor3.14%5.21%25.42%
๐Ÿ‡น๐Ÿ‡ฌ Togo4.29%3.13%11.77%
๐Ÿ‡น๐Ÿ‡ฐ Tokelau4.7%8.66%25.03%
๐Ÿ‡น๐Ÿ‡ด Tonga4.6%6.22%21.65%
๐Ÿ‡น๐Ÿ‡น Trinidad and Tobago3.93%11.52%32.67%
๐Ÿ‡น๐Ÿ‡ณ Tunisia4.4%9.02%31.24%
๐Ÿ‡น๐Ÿ‡ท Turkey3.77%8.64%33.9%
๐Ÿ‡น๐Ÿ‡ฒ Turkmenistan5.84%5.15%21.55%
๐Ÿ‡น๐Ÿ‡จ Turks and Caicos Islands5.79%10.34%28.25%
๐Ÿ‡น๐Ÿ‡ป Tuvalu4.98%6.48%16.15%
๐Ÿ‡บ๐Ÿ‡ฌ Uganda2.87%1.69%14.33%
๐Ÿ‡บ๐Ÿ‡ฆ Ukraine7.54%18.81%33.2%
๐Ÿ‡ฆ๐Ÿ‡ช United Arab Emirates3.35%1.83%15.77%
๐Ÿ‡ฌ๐Ÿ‡ง United Kingdom10.84%19.17%32.56%
๐Ÿ‡บ๐Ÿ‡ธ United States8.18%17.13%30.47%
๐Ÿ‡ป๐Ÿ‡ฎ United States Virgin Islands7.54%20.42%39.11%
๐Ÿ‡บ๐Ÿ‡พ Uruguay8.23%15.58%35.98%
๐Ÿ‡บ๐Ÿ‡ฟ Uzbekistan5.87%5.14%22.24%
๐Ÿ‡ป๐Ÿ‡บ Vanuatu5.65%3.74%16.29%
๐Ÿ‡ป๐Ÿ‡ช Venezuela2.29%8.61%27.71%
๐Ÿ‡ป๐Ÿ‡ณ Vietnam4.13%9.12%30.02%
๐Ÿ‡ผ๐Ÿ‡ซ Wallis and Futuna1.76%13.47%32.98%
๐Ÿ‡ช๐Ÿ‡ญ Western Sahara2.82%5.84%23.73%
๐Ÿ‡พ๐Ÿ‡ช Yemen3.98%2.66%18.25%
๐Ÿ‡ฟ๐Ÿ‡ฒ Zambia2.76%1.75%12.66%
๐Ÿ‡ฟ๐Ÿ‡ผ Zimbabwe3.18%3.32%14.22%
๐ŸŒ World5.13%9.82%24.03%

Some of the places with high elderly shares today include high-income countries like Japan (30%), Italy (24%), and Finland (23%).

The lowest shares are concentrated in the Middle East and Africa. Many countries have just 2% of their population aged 65 years and older, such as Qatar, Uganda, and Afghanistan.

But over time, almost all countries are expected to see their older population segments grow. In just three decades, it is estimated that one-in-four European, North American, and Asian residents will be over 65 years of age.

By 2100, a variety of Asian countries and island nations facing low population growth are expected to see more than one-third of their populations aged 65 years or older, including South Korea and Jamaica at 44%. However, it’s actually Albania that’s the biggest outlier overall, with a projected 49% of its population to be aged 65 and older by 2100.

Passing the Generational Torch

The challenge of an aging population is set to impact all sectors of society, including labor and financial markets, demand for housing and transportation, and especially family structures and intergenerational ties.

One way to help grasp the nature of transition is to note the changing ratio between seniors and young children in the world population, as seen in the below crossover diagram:

Elderly population surpass that of children aged 5 and below

Dropping fertility rates, in addition to improved child and infant mortality rates, are known to have played a major role in the plateauing population of children.

However, not all countries have witnessed this crossover yet, as it usually coincides with higher levels of economic development.

As countries such as India, Brazil, and South Africa reach higher levels of per capita income, they will be likely to follow down the paths of more advanced economies, eventually experiencing similar demographic fates and challenges.

Continue Reading

Subscribe

Popular