Healthcare
Animation: The World’s Rapid Rise in Life Expectancy, in Just 13 Seconds
Pandemics have been a thorn in the side of humanity for thousands of years.
But despite COVID-19 being the latest iteration in these deadly infectious diseases to strike, we are experiencing it in a very different public health context than past pandemics throughout history.
A New Era of Medicine
Since the onset of the 1918 influenza pandemic, humans have seen a monumental and undeniable leap forward in the health sciences.
Advancements in everything from sanitation to pharmacology have spread globally, resulting in a health landscape that is almost unrecognizable from those during past disease outbreaks.
While it’s not possible to demonstrate every life-saving advancement in medical knowledge in just one chart, the rise of life expectancy at birth can be a useful proxy. In just 65 years, modern medicine has propelled countries around the world to see a rapid surge in this crucial measure:
The above animation, which comes to us from Reddit user u/karthikvcp, provides a helpful reminder of just how much has changed in public health over recent decades.
And although countries seem to move up following a linear line, here’s another look at this surge in global life expectancy on a much longer timeline — since the dawn of human civilization:
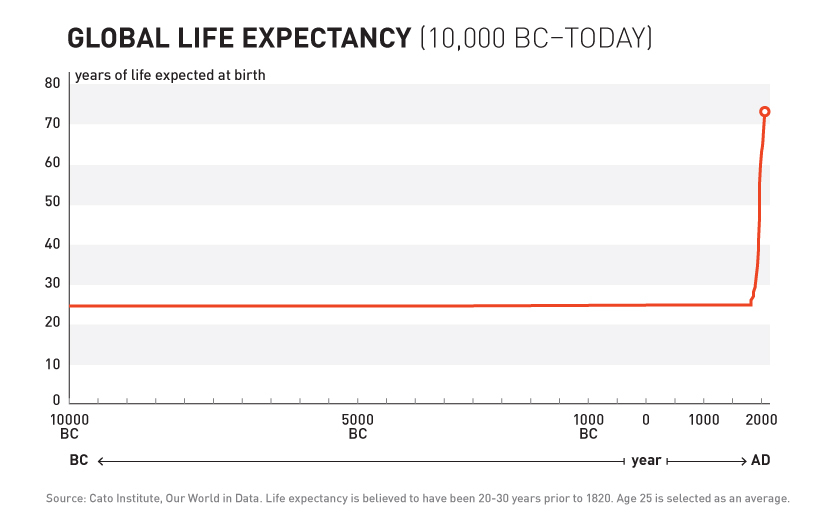
Yes, for most of human history, it’s been estimated that global life expectancy at birth has bounced between 20 and 30 years.
Beginning approximately in the year 1820, global life expectancy started its exponential ascent, seeing its most impressive gains after 1950 as modern sanitation and medical advancements began to trickle down to developing nations.
Life Expectancy: Interactive Version
While the 13-second animation is a fast summation of the revolution that has occurred in public health, here’s an interactive version from Our World in Data that plots the exact same data:
Still at the Mercy of Nature
Although our understandings of epidemiology and disease treatment are better than they’ve been during previous pandemics, other aspects of modern society have still compounded to make COVID-19 a complex challenge for public health officials.
Population density, frequency of travel, and a modern tendency to gather in large groups are all factors that have contributed to an initial spread of the virus that was faster and more widespread than anything humanity has ever seen.
And so, even with our increased level of medical sophistication, it seems we are still at the mercy of Mother Nature — just in a very different set of circumstances than in pandemics past.


Healthcare
The Cost of an EpiPen in Major Markets
This visualization compares EpiPen prices around the world, with the U.S. having the highest prices by far.


The Cost of an EpiPen in Major Markets
This was originally posted on our Voronoi app. Download the app for free on iOS or Android and discover incredible data-driven charts from a variety of trusted sources.
EpiPens are auto-injectors containing epinephrine, a drug that can treat or reverse severe allergic reactions, potentially preventing death.
The global epinephrine market was valued at $1.75 billion in 2022 and is projected to reach $4.08 billion by 2030. North America represents over 60% of the market.
EpiPens, however, can be prohibitively expensive in some regions.
In this graphic, we present estimated EpiPen prices in major global markets, compiled by World Population Review and converted to U.S. dollars as of August 2023.
Why are U.S. Prices so High?
The U.S. stands out as the most expensive market for EpiPens, despite over 1 million Americans having epinephrine prescriptions. After Mylan (now part of Pfizer) acquired the rights to produce EpiPens in the U.S. in 2007, the cost of a two-pack skyrocketed to $600, up from about $60.
| Country | Price (USD) |
|---|---|
| 🇺🇸 U.S. | 300* |
| 🇯🇵 Japan | 98 |
| 🇩🇪 Germany | 85 |
| 🇨🇦 Canada | 80 |
| 🇫🇷 France | 76 |
| 🇦🇺 Australia | 66 |
| 🇬🇧 UK | 61 |
| 🇮🇳 India | 30 |
*Per unit cost. Commonly sold as a two-pack, meaning total cost is equal to $600
Former Mylan CEO Heather Bresch defended the price hikes to Congress, citing minimal profit margins. Mylan eventually settled with the U.S. government for a nine-figure sum.
Notably, EpiPens are available at a fraction of the cost in other developed countries like Japan, Germany, and Canada.
Making EpiPens More Affordable
Efforts to improve EpiPen affordability are underway in several U.S. states. For instance, the Colorado House approved a $60 price cap on epinephrine, now under review by the state Senate.
Similar measures in Rhode Island, Delaware, Missouri, and Vermont aim to ensure insurance coverage for epinephrine, which is not currently mandatory, although most health plans cover it.

-

 Education1 week ago
How Hard Is It to Get Into an Ivy League School?
-

 Technology2 weeks ago
Ranked: Semiconductor Companies by Industry Revenue Share
-

 Markets2 weeks ago
Ranked: The World’s Top Flight Routes, by Revenue
-

 Demographics2 weeks ago
Population Projections: The World’s 6 Largest Countries in 2075
-

 Markets2 weeks ago
The Top 10 States by Real GDP Growth in 2023
-

 Demographics2 weeks ago
The Smallest Gender Wage Gaps in OECD Countries
-

 Economy2 weeks ago
Where U.S. Inflation Hit the Hardest in March 2024
-

 Green2 weeks ago
Top Countries By Forest Growth Since 2001