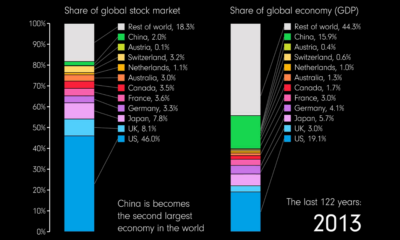

This animation compares countries' share of the global stock market and GDP over 122 years from 1900 to 2022.
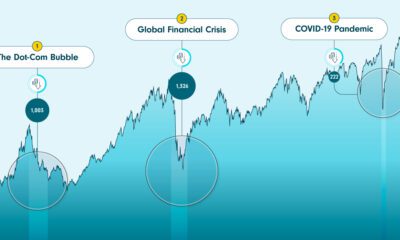

The S&P/TSX Composite Index withstood three recessions in 2000, 2008, and 2020. Through their build-up, crashes, and recoveries, valuable lessons emerged.
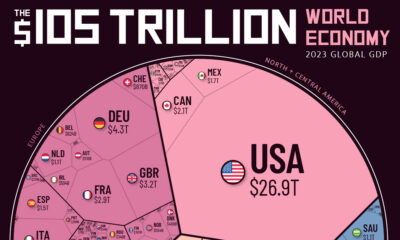

How much does each country contribute to the $105 trillion world economy in 2023, and what nations are seeing their nominal GDPs shrink?
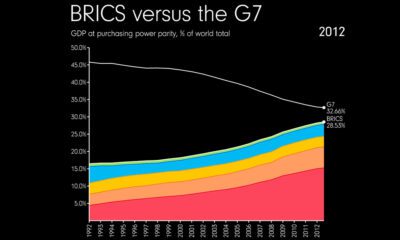

How fast have the economies of BRICS countries grown? This video highlights the rapid rise of BRICS compared to the G7.
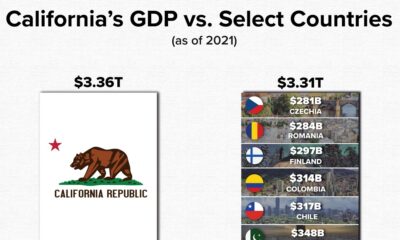

California’s GDP makes the state one of the most powerful economies in the world. This graphic compares it to the GDP of 10 select countries.
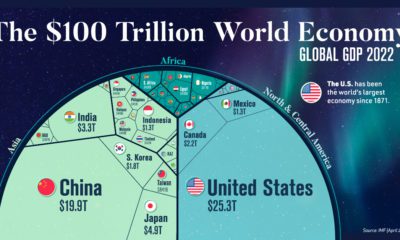

Despite ripple effects from conflict and inflation, global growth continues. According to the IMF, the global GDP will hit $104 trillion by end of year.
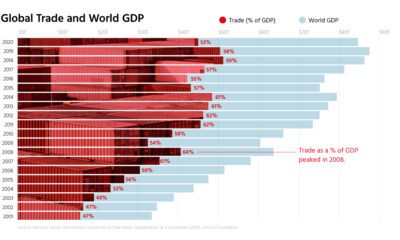

Free trade is a powerful engine for economic growth, but rising protectionism stands in the way. See what the data says in this infographic.
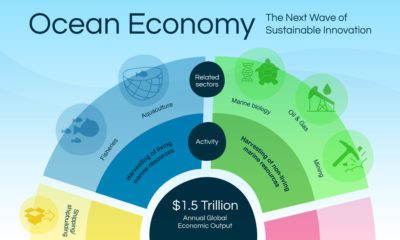

This graphic explores how the $1.5 trillion ocean economy can help fight against some of the toughest challenges facing the world today.
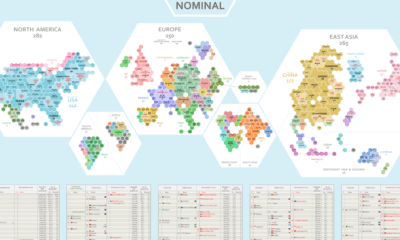

Where does the world's economic activity take place? This cartogram shows the $94 trillion global economy divided into 1,000 hexagons.
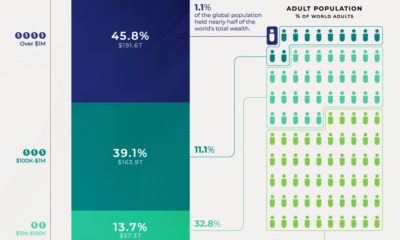

Global wealth at the end of 2020 was about $418 trillion. Here's a breakdown of the global wealth distribution among the adult population.