Economy
Visualizing California’s GDP Compared to Countries
Article/Editing:
California’s GDP Compared to Countries
Comedian Trevor Noah once said America is fifty little countries masquerading as one.
From an economic sense, this might carry some truth. When looking at the economic output of each state, especially the largest and wealthiest ones, they often compare to or even exceed the GDPs of entire nations.
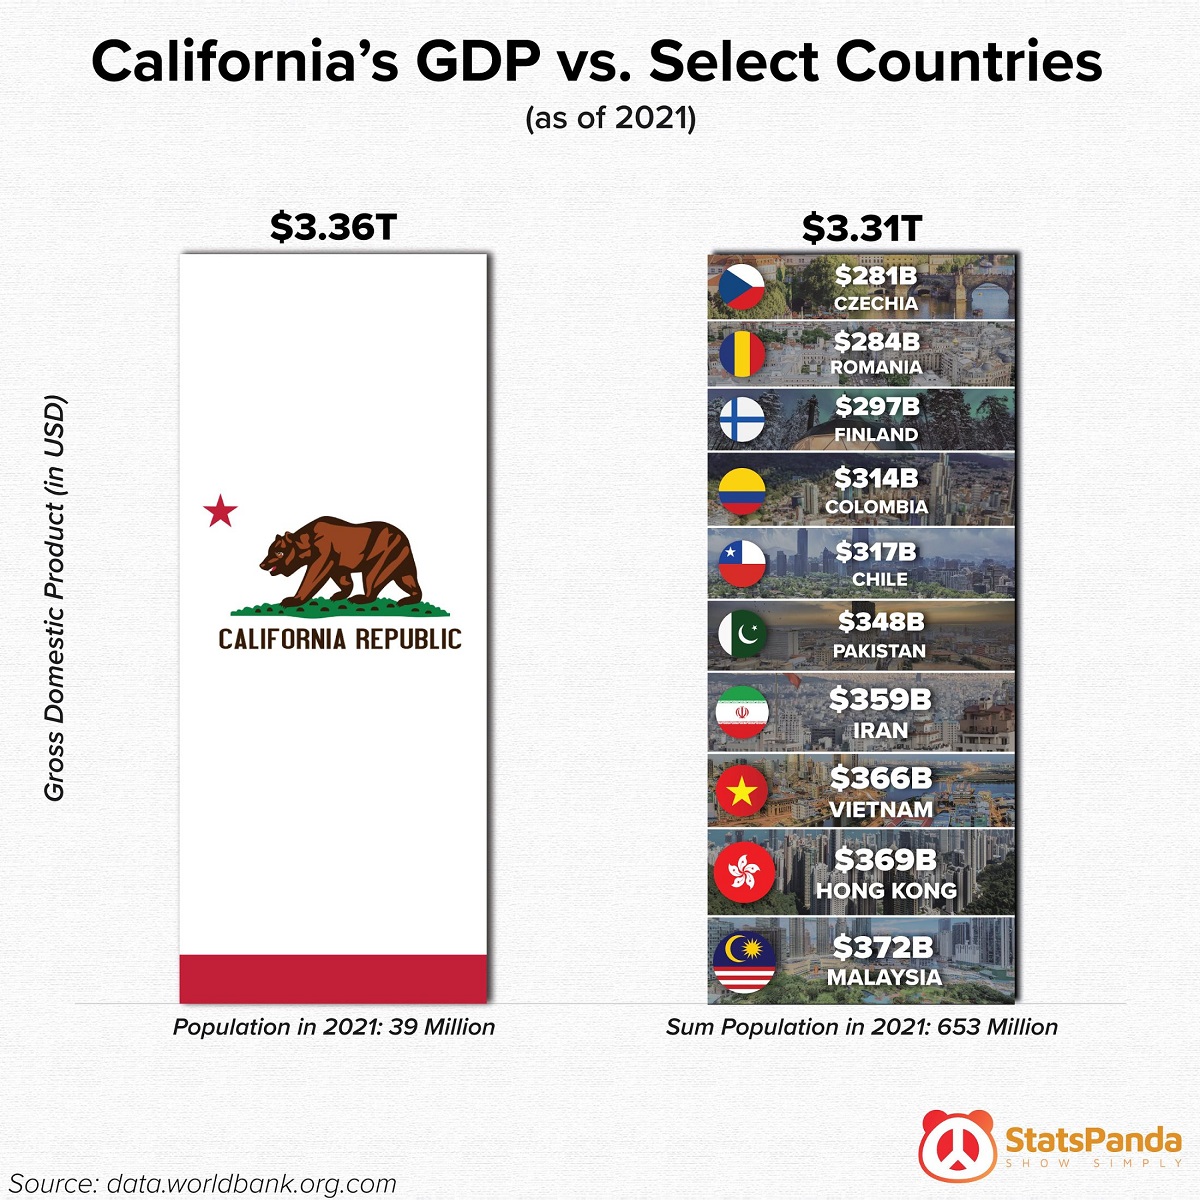
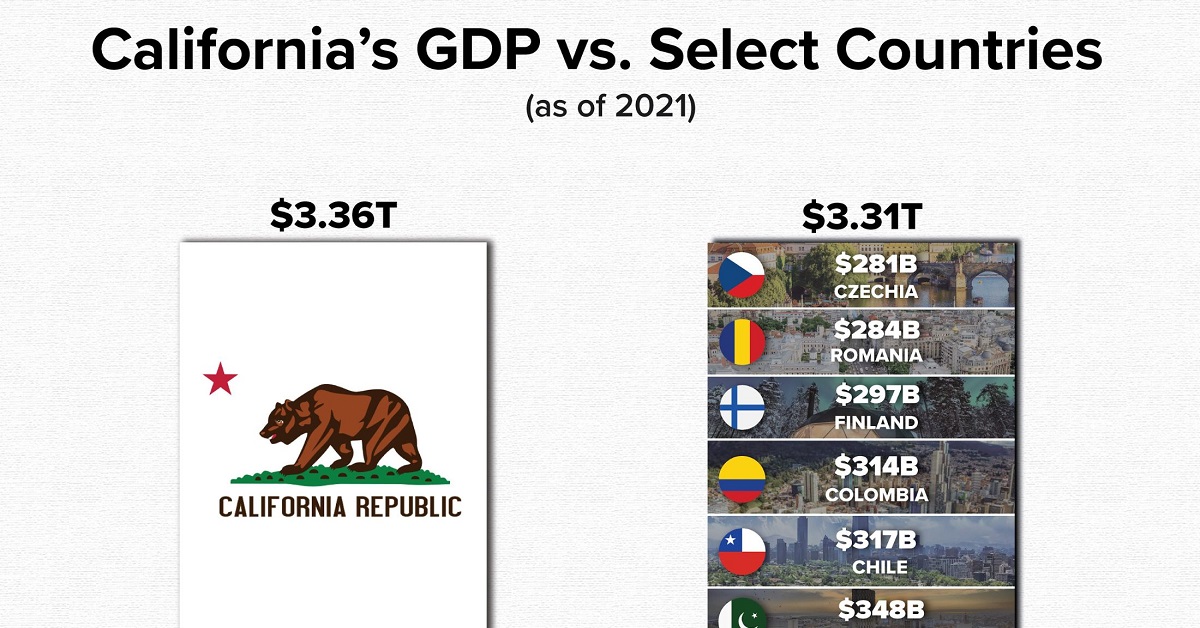
To illustrate, this visual from StatsPanda looks at California’s $3.36 trillion GDP using data from The World Bank and compares it to 10 sizable country economies. Let’s take a closer look.
Sizing Up California’s GDP in 2021
California’s $3+ trillion GDP is an enormous figure in its own right, so it’s no surprise that it is larger than certain nations’ economic output.
But even when comparing with economies like Malaysia, Colombia, and Finland, all among the top 50 countries by GDP, California stands tall.
| Country | GDP (2021 USD) |
|---|---|
| 🇲🇾 Malaysia | $372B |
| 🇭🇰 Hong Kong | $369B |
| 🇻🇳 Vietnam | $366B |
| 🇮🇷 Iran | $359B |
| 🇵🇰 Pakistan | $348B |
| 🇨🇱 Chile | $317B |
| 🇨🇴 Colombia | $314B |
| 🇫🇮 Finland | $297B |
| 🇷🇴 Romania | $284B |
| 🇨🇿 Czechia | $281B |
| Total | $3.31T |
| California | $3.36T |
What’s more, these 10 countries are quite densely populated, with a combined population of 653 million compared to California’s 39 million total.
A Closer Look At California’s Economy
What makes California’s GDP so vast and their economy so powerful?
Relative population is a big factor, as the state is the most populous in the U.S. with roughly 12% of the country’s population calling it home. But since California’s GDP makes up over 15% of the country’s economic output, there must be something else at work.
One key driver is the technology sector. Not only does Silicon Valley generate massive amounts of technological output, this also translates directly to wealth and economic activity. Many tech markets follow winner-take-all dynamics, bringing large revenues back to the state. In addition, smaller technology companies are frequently gobbled up by larger competitors, adding wealth back into the mix through M&A.
This might partly explain why California’s GDP is actually estimated to overtake Germany’s in the coming years and become the world’s 4th largest economy.

This article was published as a part of Visual Capitalist's Creator Program, which features data-driven visuals from some of our favorite Creators around the world.


Markets
Ranked: The Largest U.S. Corporations by Number of Employees
We visualized the top U.S. companies by employees, revealing the massive scale of retailers like Walmart, Target, and Home Depot.


The Largest U.S. Corporations by Number of Employees
This was originally posted on our Voronoi app. Download the app for free on Apple or Android and discover incredible data-driven charts from a variety of trusted sources.
Revenue and profit are common measures for measuring the size of a business, but what about employee headcount?
To see how big companies have become from a human perspective, we’ve visualized the top U.S. companies by employees. These figures come from companiesmarketcap.com, and were accessed in March 2024. Note that this ranking includes publicly-traded companies only.
Data and Highlights
The data we used to create this list of largest U.S. corporations by number of employees can be found in the table below.
| Company | Sector | Number of Employees |
|---|---|---|
| Walmart | Consumer Staples | 2,100,000 |
| Amazon | Consumer Discretionary | 1,500,000 |
| UPS | Industrials | 500,000 |
| Home Depot | Consumer Discretionary | 470,000 |
| Concentrix | Information Technology | 440,000 |
| Target | Consumer Staples | 440,000 |
| Kroger | Consumer Staples | 430,000 |
| UnitedHealth | Health Care | 400,000 |
| Berkshire Hathaway | Financials | 383,000 |
| Starbucks | Consumer Discretionary | 381,000 |
| Marriott International | Consumer Discretionary | 377,000 |
| Cognizant | Information Technology | 346,600 |
Retail and Logistics Top the List
Companies like Walmart, Target, and Kroger have a massive headcount due to having many locations spread across the country, which require everything from cashiers to IT professionals.
Moving goods around the world is also highly labor intensive, explaining why UPS has half a million employees globally.
Below the Radar?
Two companies that rank among the largest U.S. corporations by employees which may be less familiar to the public include Concentrix and Cognizant. Both of these companies are B2B brands, meaning they primarily work with other companies rather than consumers. This contrasts with brands like Amazon or Home Depot, which are much more visible among average consumers.
A Note on Berkshire Hathaway
Warren Buffett’s company doesn’t directly employ 383,000 people. This headcount actually includes the employees of the firm’s many subsidiaries, such as GEICO (insurance), Dairy Queen (retail), and Duracell (batteries).
If you’re curious to see how Buffett’s empire has grown over the years, check out this animated graphic that visualizes the growth of Berkshire Hathaway’s portfolio from 1994 to 2022.

-

 Real Estate2 weeks ago
Visualizing America’s Shortage of Affordable Homes
-

 Technology1 week ago
Ranked: Semiconductor Companies by Industry Revenue Share
-

 Money1 week ago
Which States Have the Highest Minimum Wage in America?
-

 Real Estate1 week ago
Ranked: The Most Valuable Housing Markets in America
-

 Business2 weeks ago
Charted: Big Four Market Share by S&P 500 Audits
-

 AI2 weeks ago
The Stock Performance of U.S. Chipmakers So Far in 2024
-

 Misc2 weeks ago
Almost Every EV Stock is Down After Q1 2024
-

 Money2 weeks ago
Where Does One U.S. Tax Dollar Go?