Misc
Visualized: The World’s Busiest Airports, by Passenger Count


Visualized: The World’s Busiest Airports, by Passenger Count
Airports, with their slow-moving queues and bustling gates, can be some of the most crowded, stressful places in the world. Despite the negatives associated with commercial air travel, overall it’s an impressive system, with the biggest air transit hubs recording passenger traffic numbers that rival the populations of large countries.
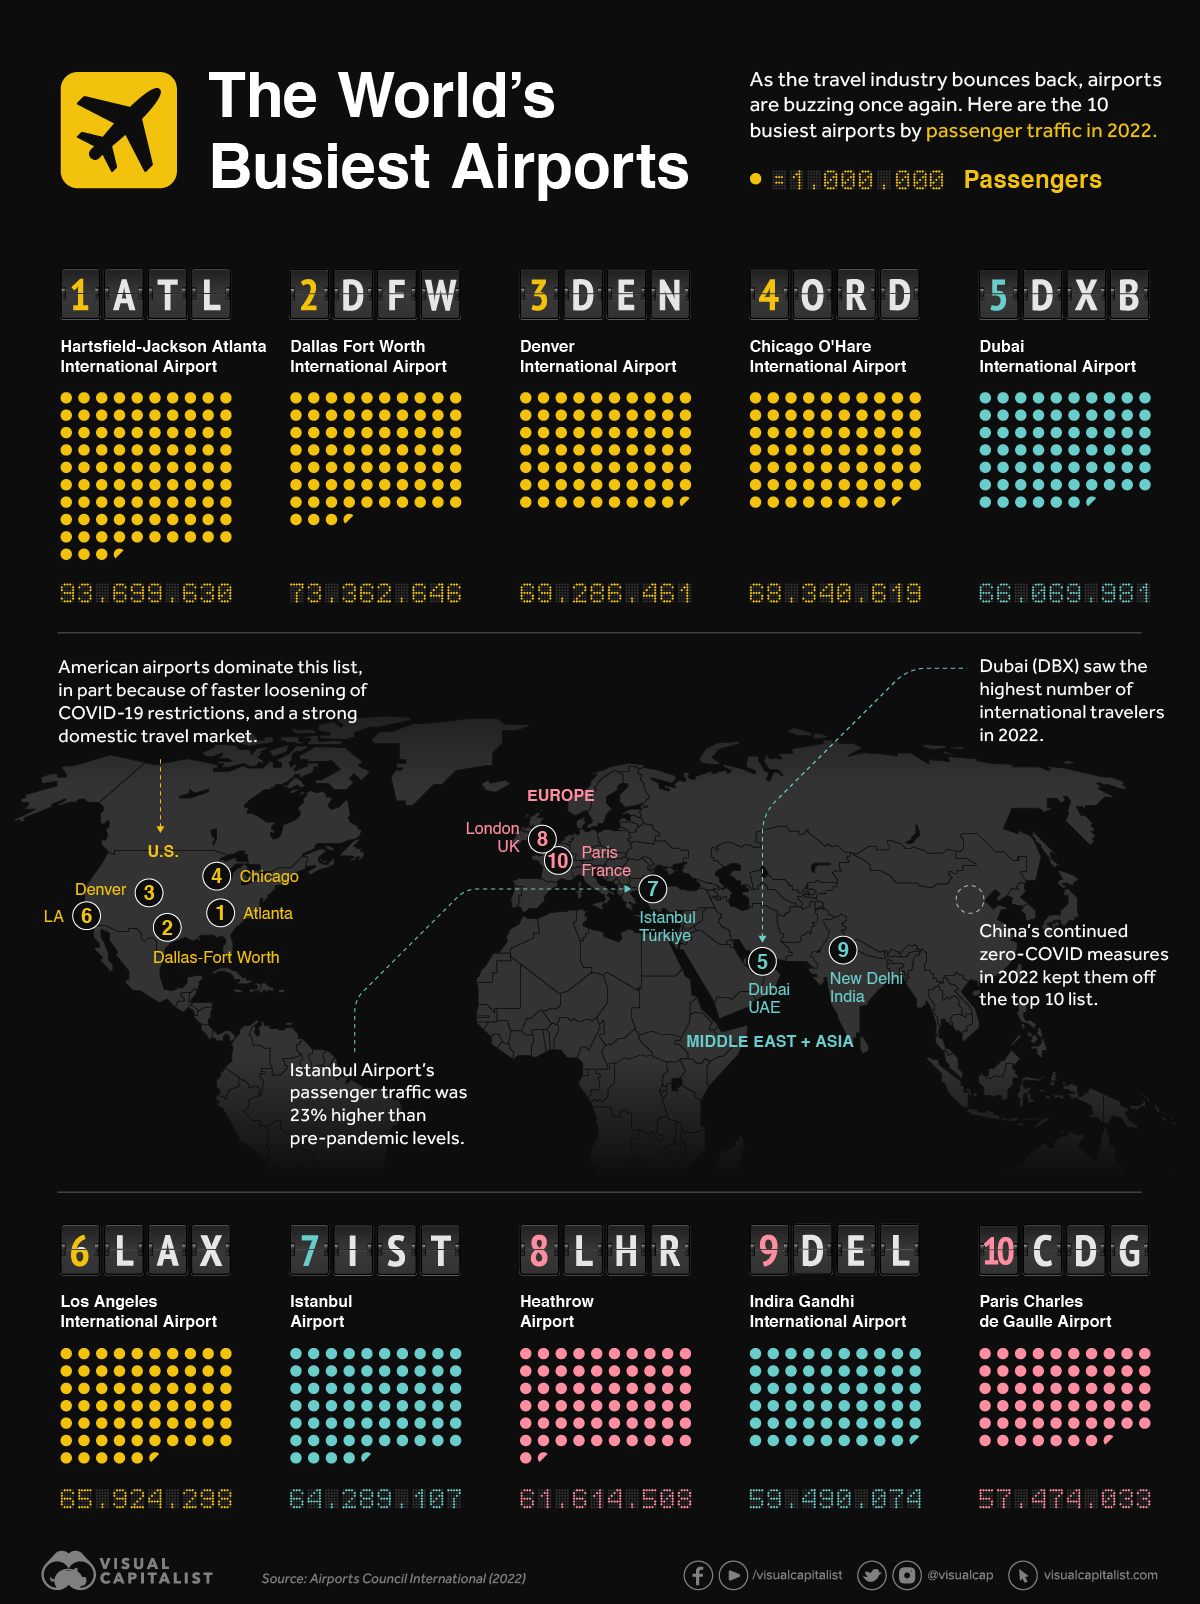
The infographic above uses data from Airports Council International (ACI) to rank the top 10 busiest airports in the world, looking at total passengers enplaned and deplaned, with passengers in transit counted once.
The Most Bustling Airports in 2022
In 2022, worldwide passenger traffic came near to 7 billion, an increase of almost 54% from 2021, and a 74% recovery from pre-pandemic levels.
Here’s a closer look at the data, alongside the year-over-year increases at each airport:
| Rank | Airport | City | Passengers (2022) | Change vs. 2021 |
|---|---|---|---|---|
| #1 | Hartsfield-Jackson Atlanta International Airport (ATL) | 🇺🇸 Atlanta | 93,699,630 | 24% |
| #2 | Dallas Fort Worth International Airport (DFW) | 🇺🇸 Dallas | 73,362,946 | 18% |
| #3 | Denver International Airport (DEN) | 🇺🇸 Denver | 69,286,461 | 18% |
| #4 | Chicago O'Hare International Airport (ORD) | 🇺🇸 Chicago | 68,340,619 | 27% |
| #5 | Dubai International Airport (DXB) | 🇦🇪 Dubai | 66,069,981 | 127% |
| #6 | Los Angeles International Airport (LAX) | 🇺🇸 Los Angeles | 65,924,298 | 37% |
| #7 | Istanbul Airport (IST) | 🇹🇷 Istanbul | 64,289,107 | 74% |
| #8 | Heathrow Airport (LHR) | 🇬🇧 London | 61,614,508 | 218% |
| #9 | Indira Gandhi International Airport (DEL) | 🇮🇳 New Delhi | 59,490,074 | 60% |
| #10 | Paris Charles de Gaulle Airport (CDG) | 🇫🇷 Paris | 57,474,033 | 119% |
These 10 airports made up 10% of all passenger traffic in the world last year. Half of these airports are in the U.S. and their numbers were largely buoyed by domestic travelers, according to the ACI Director General.
While Atlanta’s airport saw the highest number of passengers at nearly 94 million, London’s Heathrow airport saw passenger traffic grow the most annually by over 217%.
In this dataset, such big percentage increases between 2021 and 2022 are usually linked to the scaling back or full removal of COVID-19 restrictions.
The Travel Industry Looking Ahead
Despite high levels of passenger traffic globally, the travel and tourism industry has actually not yet fully recovered to pre-pandemic peaks, but it is getting close. A recent report from the World Travel & Tourism Council found that the industry has recovered to 95% of its market size in 2019.
Jobs also recovered in the industry with 21.6 million workers added in 2022, hitting over 295 million globally and representing one in 11 jobs worldwide. Spending by overseas tourists also hit a record growth rate last year of 82%, totaling out to $1.1 trillion. Overall, the trend is looking positive for those in travel and tourism.
In fact, many popular travel destinations have already had spending exceed 2019 figures, with 34 countries seeing their travel industries return to pre-pandemic levels of contribution to GDP.
“By the end of the year, the sector’s contribution will be within touching distance of the 2019 peak. We expect 2024 to exceed 2019.”– Julia Simpson, WTTC President & CEO
While conflicts like the war in Ukraine have hindered recovery somewhat, recent moves by countries like China to reopen borders will help bolster growth in the travel and tourism industries.


Misc
Visualizing the Most Common Pets in the U.S.
Lions, tigers, and bears, oh my!—these animals do not feature on this list of popular American household pets.


Visualizing The Most Common Pets in the U.S.
This was originally posted on our Voronoi app. Download the app for free on iOS or Android and discover incredible data-driven charts from a variety of trusted sources.
In this graphic, we visualized the most common American household pets, based on 2023-2024 data from the American Pet Products Association (accessed via Forbes Advisor).
Figures represent the number of households that own each pet type, rather than the actual number of each animal. The “small animal” category includes hamsters, gerbils, rabbits, guinea pigs, chinchillas, mice, rats, and ferrets.
What is the Most Popular American Household Pet?
Based on this data, dogs—one of the first domesticated animals—are the most common pets in the United States. In fact, around 65 million households own a dog, and spend an average of $900 a year on their care.
| Rank | Species | Households |
|---|---|---|
| 1 | 🐶 Dog | 65M |
| 2 | 🐱 Cat | 47M |
| 3 | 🐟 Freshwater Fish | 11M |
| 4 | 🐰 Small Animals | 7M |
| 5 | 🐦 Bird | 6M |
| 6 | 🦎 Reptile | 6M |
| 7 | 🐴 Horse | 2M |
| 8 | 🐠 Saltwater Fish | 2M |
Note: Households can own multiple pets, and are counted for all relevant categories.
Cats rank second, at 47 million households, and these smaller felines are a little less expensive to own at $700/year according to Forbes estimates.
But aside from these two juggernauts, there are plenty of other common pet types found in households across the country.
Freshwater fish can be found in 11 million households, along with small animals—rabbits, hamsters, guinea pigs—in 7 million. Meanwhile, nearly 6 million homes have birds or reptiles.
Pet Ownership is on the Rise in America
Forbes found that 66% of all American households (numbering 87 million) own at least one pet, up from 56% in 1988. One third of these (29 million) own multiple pets.
A combination of factors is driving this increase: rising incomes, delayed childbirth, and of course the impact of the pandemic which nearly cleared out animal shelters across the globe.
America’s loneliness epidemic may also be a factor. Fledgling research has shown that single-individual households with pets recorded lower rates of loneliness during the pandemic than those without a pet.

-

 Science1 week ago
Visualizing the Average Lifespans of Mammals
-

 Demographics2 weeks ago
The Smallest Gender Wage Gaps in OECD Countries
-

 United States2 weeks ago
Where U.S. Inflation Hit the Hardest in March 2024
-

 Green2 weeks ago
Top Countries By Forest Growth Since 2001
-

 United States2 weeks ago
Ranked: The Largest U.S. Corporations by Number of Employees
-

 Maps2 weeks ago
The Largest Earthquakes in the New York Area (1970-2024)
-

 Green2 weeks ago
Ranked: The Countries With the Most Air Pollution in 2023
-

 Green2 weeks ago
Ranking the Top 15 Countries by Carbon Tax Revenue