Energy
Which Companies Are Responsible For the Most Carbon Emissions?
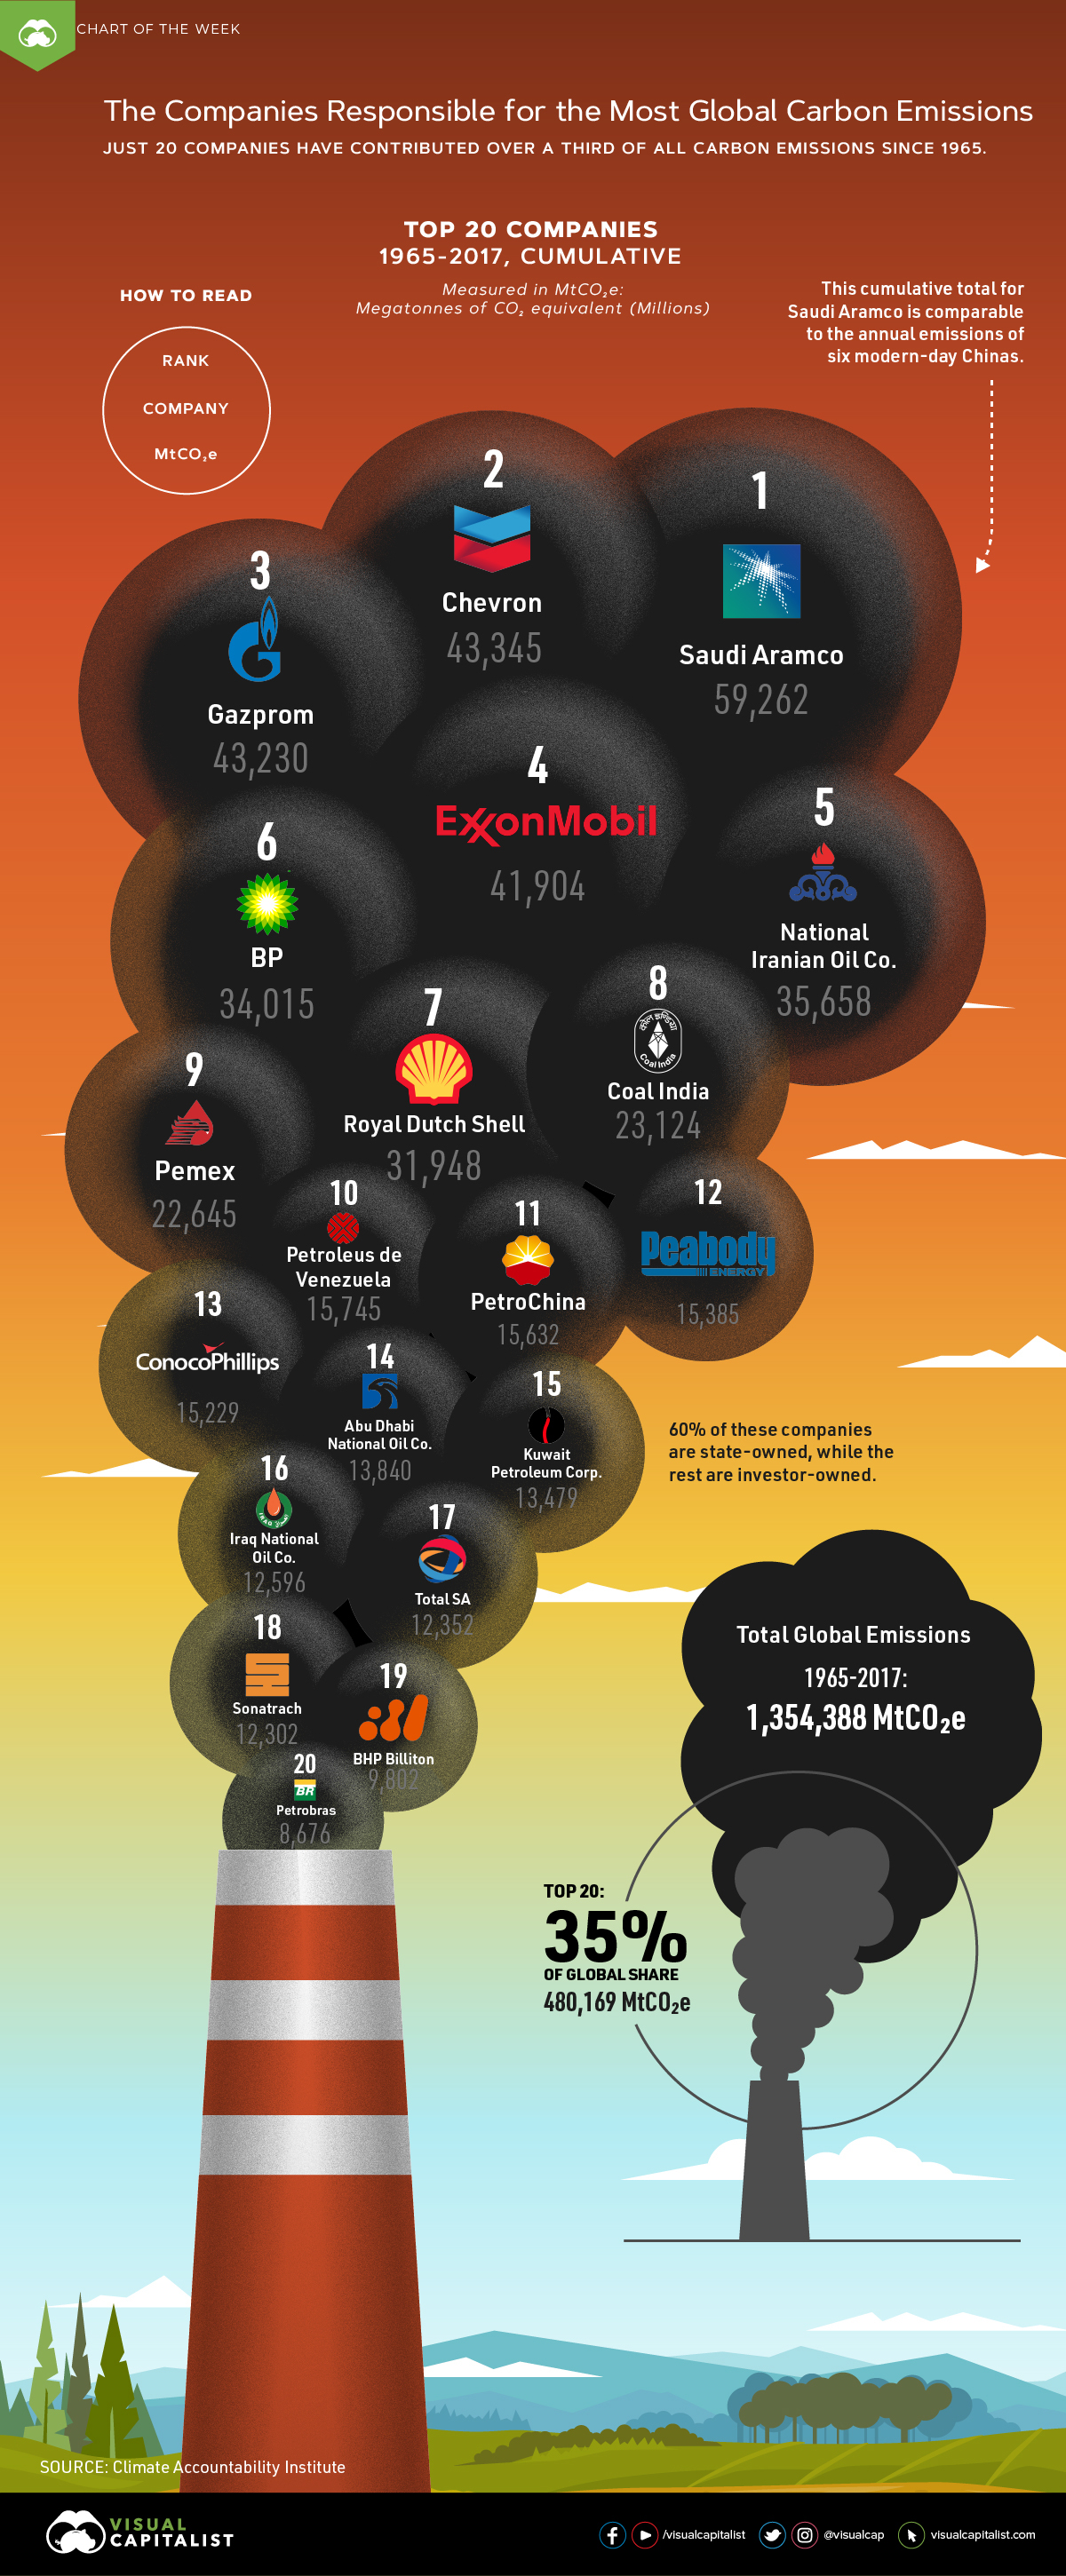
20 Companies Responsible For the Most Carbon Emissions?
Since 1965, it’s estimated over 1.35 trillion metric tons of greenhouse gases have been released into the atmosphere—and over a third can be traced back to just 20 companies.
This week’s chart draws on a dataset from the Climate Accountability Institute, and highlights the companies which have been responsible for the most carbon emissions in the past half-century.
Note: Carbon emissions are measured in MtCO₂e: Megatonnes of CO₂ equivalent (Millions).
The Sum of their Carbon Emissions
Between 1965-2017, the top 20 companies have contributed 480,169 MtCO₂e in total carbon emissions, or 35% of cumulative global emissions. This whopping amount is mostly from the combustion of their products—each company on this chart deals in fossil fuels.
The largest contributor? Saudi Aramco, the national petroleum and natural gas company of Saudi Arabia. Saudi Aramco actually comes in first on another list as well—it’s the most profitable company, making over $304 million daily.
However, this financial gain came at a significant cost: the state-owned giant’s operations have resulted in 59,262 MtCO₂e in carbon emissions since 1965. To put that into perspective, this total is more than six times China’s emissions in 2017 alone (9,838 MtCO₂e).
Explore the full list of companies by location, who owns them, and their total 1965–2017 emissions count below:
| Company | Country | Ownership | All Emissions, MtCO₂e |
|---|---|---|---|
| Saudi Aramco | 🇸🇦 Saudi Arabia | State-owned | 59,262 |
| Chevron | 🇺🇸 U.S. | Investor-owned | 43,345 |
| Gazprom | 🇷🇺 Russia | State-owned | 43,230 |
| Exxon Mobil | 🇺🇸 U.S. | Investor-owned | 41,904 |
| National Iranian Oil Co. | 🇮🇷 Iran | State-owned | 35,658 |
| BP | 🇬🇧 UK | Investor-owned | 34,015 |
| Royal Dutch Shell | 🇳🇱 Netherlands | Investor-owned | 31,948 |
| Coal India | 🇮🇳 India | State-owned | 23,124 |
| Pemex | 🇲🇽 Mexico | State-owned | 22,645 |
| Petroleus de Venezuela | 🇻🇪 Venezuela | State-owned | 15,745 |
| PetroChina | 🇨🇳 China | State-owned | 15,632 |
| Peabody Energy | 🇺🇸 U.S. | Investor-owned | 15,385 |
| ConocoPhillips | 🇺🇸 U.S. | Investor-owned | 15,229 |
| Abu Dhabi National Oil Co. | 🇦🇪 UAE | State-owned | 13,840 |
| Kuwait Petroleum Corp. | 🇰🇼 Kuwait | State-owned | 13,479 |
| Iraq National Oil Co. | 🇮🇶 Iraq | State-owned | 12,596 |
| Total SA | 🇫🇷 France | Investor-owned | 12,352 |
| Sonatrach | 🇩🇿 Algeria | State-owned | 12,302 |
| BHP Billiton | 🇦🇺 Australia | Investor-owned | 9,802 |
| Petrobras | 🇧🇷 Brazil | State-owned | 8,676 |
| Total Emissions | 480,169 MtCO₂e |
A Greener Business Model?
According to the researchers, all the companies that show up in today’s chart bear some responsibility for knowingly accelerating the climate crisis even after proven scientific evidence.
In fact, U.S.-based Exxon Mobil is currently on trial for misleading investors: the company downplayed the effect of climate change on its profitability, while internal calculations proved to be much larger. It also sowed public doubt on the immense impacts of rising greenhouse gas levels on the planet.
Growing sustainability and environmental concerns threaten the viability of old business models for these corporations, causing many to pivot away from the fossil fuel focus. Take BP for example—originally named British Petroleum, the company embraced “Beyond Petroleum” as its new rallying cry. More recently, it launched a carbon footprint calculator and is committed to keeping its carbon emissions flat into 2025.
The first step to reducing your emissions is to know where you stand. Find out your #carbonfootprint with our new calculator & share your pledge today!
— BP (@BP_plc) October 22, 2019
However, the Climate Accountability Institute argues that more can still be done, with the researchers calling for these companies to reduce their fossil fuel production in the near future.
Continued pressure on these “Big Oil” companies to peak their carbon emissions, and urgently increase their renewable energy investment, may help curb the climate crisis before it’s too late.
Correction: A previous version of this article mistakenly reported the total cumulative value of carbon emissions in millions instead of trillions. Both the article and graphic have been updated to reflect the changes accurately.


Energy
Charted: 4 Reasons Why Lithium Could Be the Next Gold Rush
Visual Capitalist has partnered with EnergyX to show why drops in prices and growing demand may make now the right time to invest in lithium.


4 Reasons Why You Should Invest in Lithium
Lithium’s importance in powering EVs makes it a linchpin of the clean energy transition and one of the world’s most precious minerals.
In this graphic, Visual Capitalist partnered with EnergyX to explore why now may be the time to invest in lithium.
1. Lithium Prices Have Dropped
One of the most critical aspects of evaluating an investment is ensuring that the asset’s value is higher than its price would indicate. Lithium is integral to powering EVs, and, prices have fallen fast over the last year:
| Date | LiOH·H₂O* | Li₂CO₃** |
|---|---|---|
| Feb 2023 | $76 | $71 |
| March 2023 | $71 | $61 |
| Apr 2023 | $43 | $33 |
| May 2023 | $43 | $33 |
| June 2023 | $47 | $45 |
| July 2023 | $44 | $40 |
| Aug 2023 | $35 | $35 |
| Sept 2023 | $28 | $27 |
| Oct 2023 | $24 | $23 |
| Nov 2023 | $21 | $21 |
| Dec 2023 | $17 | $16 |
| Jan 2024 | $14 | $15 |
| Feb 2024 | $13 | $14 |
Note: Monthly spot prices were taken as close to the 14th of each month as possible.
*Lithium hydroxide monohydrate MB-LI-0033
**Lithium carbonate MB-LI-0029
2. Lithium-Ion Battery Prices Are Also Falling
The drop in lithium prices is just one reason to invest in the metal. Increasing economies of scale, coupled with low commodity prices, have caused the cost of lithium-ion batteries to drop significantly as well.
In fact, BNEF reports that between 2013 and 2023, the price of a Li-ion battery dropped by 82%.
| Year | Price per KWh |
|---|---|
| 2023 | $139 |
| 2022 | $161 |
| 2021 | $150 |
| 2020 | $160 |
| 2019 | $183 |
| 2018 | $211 |
| 2017 | $258 |
| 2016 | $345 |
| 2015 | $448 |
| 2014 | $692 |
| 2013 | $780 |

3. EV Adoption is Sustainable
One of the best reasons to invest in lithium is that EVs, one of the main drivers behind the demand for lithium, have reached a price point similar to that of traditional vehicle.
According to the Kelly Blue Book, Tesla’s average transaction price dropped by 25% between 2022 and 2023, bringing it in line with many other major manufacturers and showing that EVs are a realistic transport option from a consumer price perspective.
| Manufacturer | September 2022 | September 2023 |
|---|---|---|
| BMW | $69,000 | $72,000 |
| Ford | $54,000 | $56,000 |
| Volkswagon | $54,000 | $56,000 |
| General Motors | $52,000 | $53,000 |
| Tesla | $68,000 | $51,000 |
4. Electricity Demand in Transport is Growing
As EVs become an accessible transport option, there’s an investment opportunity in lithium. But possibly the best reason to invest in lithium is that the IEA reports global demand for the electricity in transport could grow dramatically by 2030:
| Transport Type | 2022 | 2025 | 2030 |
|---|---|---|---|
| Buses 🚌 | 23,000 GWh | 50,000 GWh | 130,000 GWh |
| Cars 🚙 | 65,000 GWh | 200,000 GWh | 570,000 GWh |
| Trucks 🛻 | 4,000 GWh | 15,000 GWh | 94,000 GWh |
| Vans 🚐 | 6,000 GWh | 16,000 GWh | 72,000 GWh |
The Lithium Investment Opportunity
Lithium presents a potentially classic investment opportunity. Lithium and battery prices have dropped significantly, and recently, EVs have reached a price point similar to other vehicles. By 2030, the demand for clean energy, especially in transport, will grow dramatically.
With prices dropping and demand skyrocketing, now is the time to invest in lithium.
EnergyX is poised to exploit lithium demand with cutting-edge lithium extraction technology capable of extracting 300% more lithium than current processes.

-

 Lithium5 days ago
Ranked: The Top 10 EV Battery Manufacturers in 2023
Asia dominates this ranking of the world’s largest EV battery manufacturers in 2023.
-

 Energy1 week ago
The World’s Biggest Nuclear Energy Producers
China has grown its nuclear capacity over the last decade, now ranking second on the list of top nuclear energy producers.
-

 Energy1 month ago
The World’s Biggest Oil Producers in 2023
Just three countries accounted for 40% of global oil production last year.
-

 Energy1 month ago
How Much Does the U.S. Depend on Russian Uranium?
Currently, Russia is the largest foreign supplier of nuclear power fuel to the U.S.
-

 Uranium2 months ago
Charted: Global Uranium Reserves, by Country
We visualize the distribution of the world’s uranium reserves by country, with 3 countries accounting for more than half of total reserves.
-

 Energy3 months ago
Visualizing the Rise of the U.S. as Top Crude Oil Producer
Over the last decade, the United States has established itself as the world’s top producer of crude oil, surpassing Saudi Arabia and Russia.


-

 Debt1 week ago
How Debt-to-GDP Ratios Have Changed Since 2000
-

 Markets2 weeks ago
Ranked: The World’s Top Flight Routes, by Revenue
-

 Countries2 weeks ago
Population Projections: The World’s 6 Largest Countries in 2075
-

 Markets2 weeks ago
The Top 10 States by Real GDP Growth in 2023
-

 Demographics2 weeks ago
The Smallest Gender Wage Gaps in OECD Countries
-

 United States2 weeks ago
Where U.S. Inflation Hit the Hardest in March 2024
-

 Green2 weeks ago
Top Countries By Forest Growth Since 2001
-

 United States2 weeks ago
Ranked: The Largest U.S. Corporations by Number of Employees