Markets
The World’s 20 Most Profitable Companies
The World’s 20 Most Profitable Companies
The biggest chunk of the earnings pie is increasingly split by fewer and fewer companies.
In the U.S. for example, about 50% of all profit generated by public companies goes to just 30 companies — back in 1975, it took 109 companies to accomplish the same feat:
| Year | Number of Firms Generating 50% of Earnings | Total Public Companies (U.S.) | Portion (%) |
|---|---|---|---|
| 1975 | 109 | 4,819 | 2.2% |
| 2015 | 30 | 3,766 | 0.8% |
This power-law dynamic also manifests itself at a global level — and perhaps it’s little surprise that the world’s most profitable companies generate mind-bending returns that would make any accountant blush.
Which Company Makes the Most Per Day?
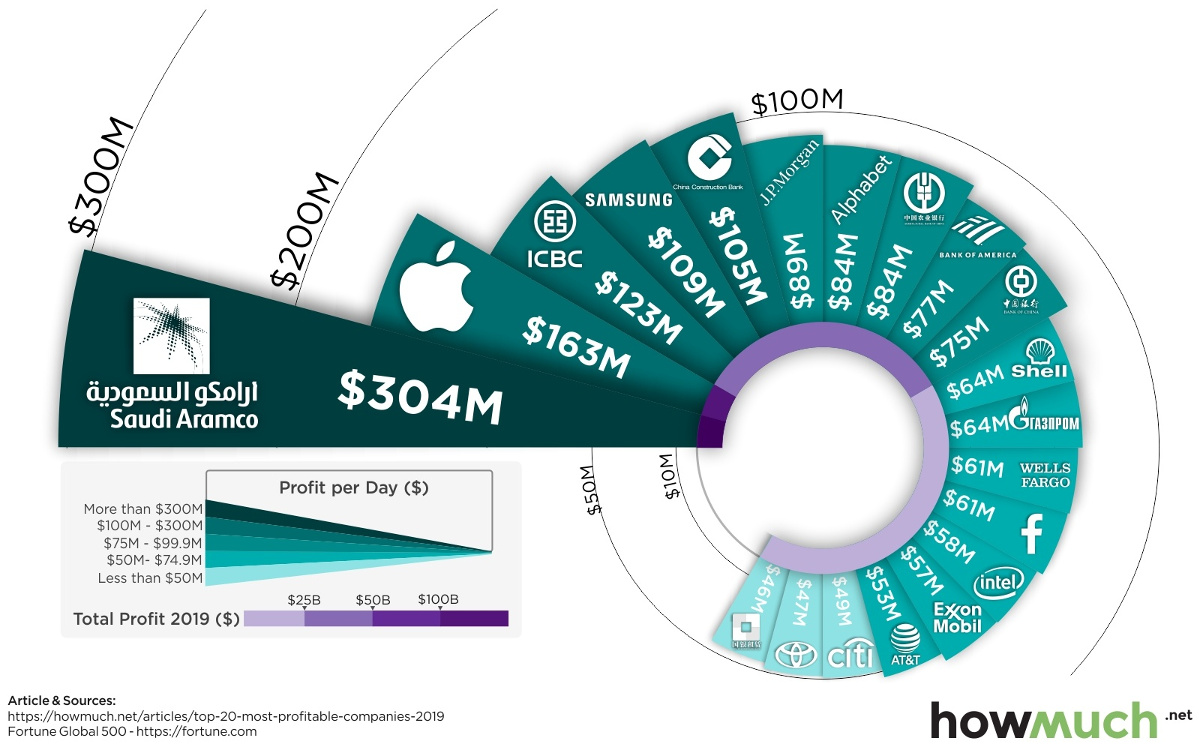
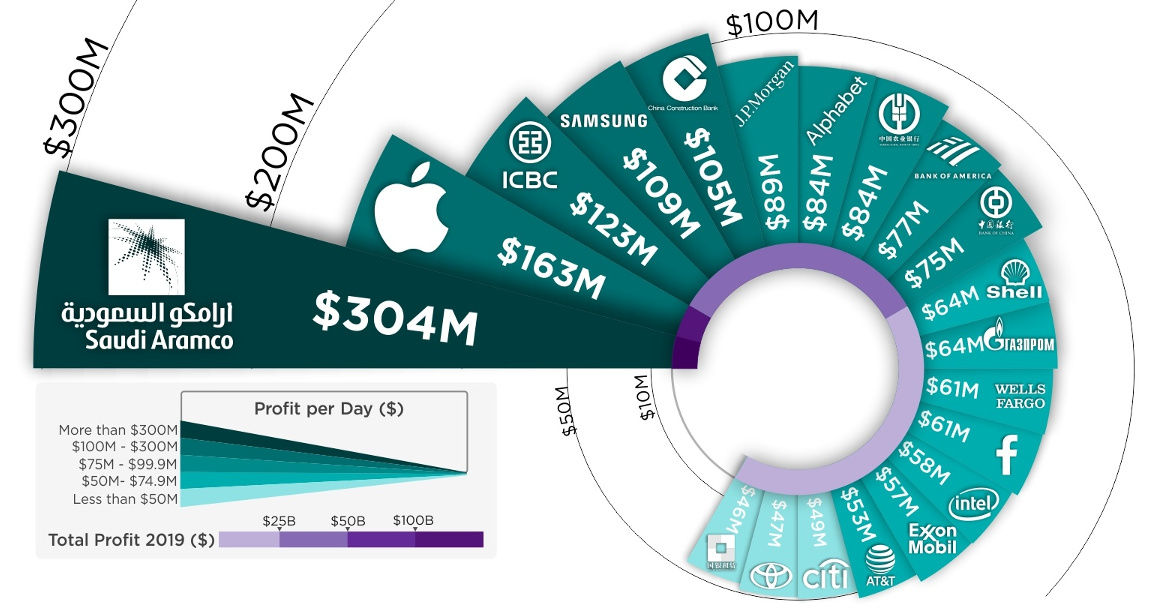
Today’s infographic comes to us from HowMuch.net, and it uses data from Fortune to illustrate how much profit top global companies actually rake in on a daily basis.
The 20 most profitable companies in the world are listed below in order, and we’ve also broken the same data down per second:
| Rank | Company | Country | Profit per Day | Profit Per Second |
|---|---|---|---|---|
| #1 | Saudi Aramco | 🇸🇦 Saudi Arabia | $304,039,726 | $3,519 |
| #2 | Apple | 🇺🇸 United States | $163,098,630 | $1,888 |
| #3 | Industrial & Commercial Bank of China | 🇨🇳 China | $123,293,973 | $1,427 |
| #4 | Samsung Electronics | 🇰🇷 South Korea | $109,301,918 | $1,265 |
| #5 | China Construction Bank | 🇨🇳 China | $105,475,068 | $1,221 |
| #6 | JPMorgan Chase & Co. | 🇺🇸 United States | $88,969,863 | $1,030 |
| #7 | Alphabet | 🇺🇸 United States | $84,208,219 | $975 |
| #8 | Agricultural Bank of China | 🇨🇳 China | $83,990,411 | $972 |
| #9 | Bank of America Corp. | 🇺🇸 United States | $77,115,068 | $893 |
| #10 | Bank of China | 🇨🇳 China | $74,589,589 | $863 |
| #11 | Royal Dutch Shell | 🇬🇧 🇳🇱 UK/Netherlands | $63,978,082 | $740 |
| #12 | Gazprom | 🇷🇺 Russia | $63,559,178 | $736 |
| #13 | Wells Fargo | 🇺🇸 United States | $61,350,685 | $710 |
| #14 | 🇺🇸 United States | $60,580,822 | $701 | |
| #15 | Intel | 🇺🇸 United States | $57,679,452 | $668 |
| #16 | Exxon Mobil | 🇺🇸 United States | $57,095,890 | $661 |
| #17 | AT&T | 🇺🇸 United States | $53,068,493 | $614 |
| #18 | Citigroup | 🇺🇸 United States | $49,438,356 | $572 |
| #19 | Toyota Motor | 🇯🇵 Japan | $46,526,027 | $538 |
| #20 | China Development Bank | 🇨🇳 China | $45,874,795 | $531 |
The Saudi Arabian Oil Company, known to most as Saudi Aramco, is by far the world’s most profitable company, raking in a stunning $304 million of profits every day. When translated to a more micro scale, that works out to $3,519 per second.
You’ve likely seen Saudi Aramco in the news lately, though for other reasons.
The giant state-owned company has been rearing to go public at an aggressive $2 trillion valuation, but it’s since delayed that IPO multiple times, most recently stating the listing will take place in December 2019 or January 2020. Company-owned refineries were also the subject of drone attacks last month, which took offline 5.7 million bpd of oil production temporarily.
Despite these challenges, Saudi Aramco still stands pretty tall — after all, such blows are softened when you churn out the same amount of profit as Apple, Alphabet, and Facebook combined.
Numbers on an Annual Basis
Bringing in over $300 million per day of profit is pretty hard to comprehend, but the numbers are even more unfathomable when they are annualized.
| Rank | Company | Country | Profit |
|---|---|---|---|
| #1 | Saudi Aramco | 🇸🇦 Saudi Arabia | $110,974,500,000 |
| #2 | Apple | 🇺🇸 United States | $59,531,000,000 |
| #3 | Industrial & Commercial Bank of China | 🇨🇳 China | $45,002,300,000 |
| #4 | Samsung Electronics | 🇰🇷 South Korea | $39,895,200,000 |
| #5 | China Construction Bank | 🇨🇳 China | $38,498,400,000 |
| #6 | JPMorgan Chase & Co. | 🇺🇸 United States | $32,474,000,000 |
| #7 | Alphabet | 🇺🇸 United States | $30,736,000,000 |
| #8 | Agricultural Bank of China | 🇨🇳 China | $30,656,500,000 |
| #9 | Bank of America Corp. | 🇺🇸 United States | $28,147,000,000 |
| #10 | Bank of China | 🇨🇳 China | $27,225,200,000 |
| #11 | Royal Dutch Shell | 🇬🇧 🇳🇱 UK/Netherlands | $23,352,000,000 |
| #12 | Gazprom | 🇷🇺 Russia | $23,199,100,000 |
| #13 | Wells Fargo | 🇺🇸 United States | $22,393,000,000 |
| #14 | 🇺🇸 United States | $22,112,000,000 | |
| #15 | Intel | 🇺🇸 United States | $21,053,000,000 |
| #16 | Exxon Mobil | 🇺🇸 United States | $20,840,000,000 |
| #17 | AT&T | 🇺🇸 United States | $19,370,000,000 |
| #18 | Citigroup | 🇺🇸 United States | $18,045,000,000 |
| #19 | Toyota Motor | 🇯🇵 Japan | $16,982,000,000 |
| #20 | China Development Bank | 🇨🇳 China | $16,744,300,000 |
On an annual basis, Saudi Aramco is raking in $111 billion of profit per year, and that’s with oil prices sitting in the $50-$70 per barrel range.
To put this number in perspective, take a look at Chevron. The American oil giant is one of the 20 biggest companies on the S&P 500, but it generated just $15 billion in profit in 2018 and currently sits at a $221 billion market capitalization.
That puts Chevron’s profits at roughly 10% of Aramco’s — and if Aramco does IPO at a $2 trillion valuation, that would put Chevron at roughly 10% of its market cap, as well.


Markets
The European Stock Market: Attractive Valuations Offer Opportunities
On average, the European stock market has valuations that are nearly 50% lower than U.S. valuations. But how can you access the market?


European Stock Market: Attractive Valuations Offer Opportunities
Europe is known for some established brands, from L’Oréal to Louis Vuitton. However, the European stock market offers additional opportunities that may be lesser known.
The above infographic, sponsored by STOXX, outlines why investors may want to consider European stocks.
Attractive Valuations
Compared to most North American and Asian markets, European stocks offer lower or comparable valuations.
| Index | Price-to-Earnings Ratio | Price-to-Book Ratio |
|---|---|---|
| EURO STOXX 50 | 14.9 | 2.2 |
| STOXX Europe 600 | 14.4 | 2 |
| U.S. | 25.9 | 4.7 |
| Canada | 16.1 | 1.8 |
| Japan | 15.4 | 1.6 |
| Asia Pacific ex. China | 17.1 | 1.8 |
Data as of February 29, 2024. See graphic for full index names. Ratios based on trailing 12 month financials. The price to earnings ratio excludes companies with negative earnings.
On average, European valuations are nearly 50% lower than U.S. valuations, potentially offering an affordable entry point for investors.
Research also shows that lower price ratios have historically led to higher long-term returns.
Market Movements Not Closely Connected
Over the last decade, the European stock market had low-to-moderate correlation with North American and Asian equities.
The below chart shows correlations from February 2014 to February 2024. A value closer to zero indicates low correlation, while a value of one would indicate that two regions are moving in perfect unison.
| EURO STOXX 50 | STOXX EUROPE 600 | U.S. | Canada | Japan | Asia Pacific ex. China |
|
|---|---|---|---|---|---|---|
| EURO STOXX 50 | 1.00 | 0.97 | 0.55 | 0.67 | 0.24 | 0.43 |
| STOXX EUROPE 600 | 1.00 | 0.56 | 0.71 | 0.28 | 0.48 | |
| U.S. | 1.00 | 0.73 | 0.12 | 0.25 | ||
| Canada | 1.00 | 0.22 | 0.40 | |||
| Japan | 1.00 | 0.88 | ||||
| Asia Pacific ex. China | 1.00 |
Data is based on daily USD returns.
European equities had relatively independent market movements from North American and Asian markets. One contributing factor could be the differing sector weights in each market. For instance, technology makes up a quarter of the U.S. market, but health care and industrials dominate the broader European market.
Ultimately, European equities can enhance portfolio diversification and have the potential to mitigate risk for investors.
Tracking the Market
For investors interested in European equities, STOXX offers a variety of flagship indices:
| Index | Description | Market Cap |
|---|---|---|
| STOXX Europe 600 | Pan-regional, broad market | €10.5T |
| STOXX Developed Europe | Pan-regional, broad-market | €9.9T |
| STOXX Europe 600 ESG-X | Pan-regional, broad market, sustainability focus | €9.7T |
| STOXX Europe 50 | Pan-regional, blue-chip | €5.1T |
| EURO STOXX 50 | Eurozone, blue-chip | €3.5T |
Data is as of February 29, 2024. Market cap is free float, which represents the shares that are readily available for public trading on stock exchanges.
The EURO STOXX 50 tracks the Eurozone’s biggest and most traded companies. It also underlies one of the world’s largest ranges of ETFs and mutual funds. As of November 2023, there were €27.3 billion in ETFs and €23.5B in mutual fund assets under management tracking the index.
“For the past 25 years, the EURO STOXX 50 has served as an accurate, reliable and tradable representation of the Eurozone equity market.”
— Axel Lomholt, General Manager at STOXX
Partnering with STOXX to Track the European Stock Market
Are you interested in European equities? STOXX can be a valuable partner:
- Comprehensive, liquid and investable ecosystem
- European heritage, global reach
- Highly sophisticated customization capabilities
- Open architecture approach to using data
- Close partnerships with clients
- Part of ISS STOXX and Deutsche Börse Group
With a full suite of indices, STOXX can help you benchmark against the European stock market.
Learn how STOXX’s European indices offer liquid and effective market access.

-

 Economy2 days ago
Economic Growth Forecasts for G7 and BRICS Countries in 2024
The IMF has released its economic growth forecasts for 2024. How do the G7 and BRICS countries compare?
-

 Markets1 week ago
U.S. Debt Interest Payments Reach $1 Trillion
U.S. debt interest payments have surged past the $1 trillion dollar mark, amid high interest rates and an ever-expanding debt burden.
-

 United States2 weeks ago
Ranked: The Largest U.S. Corporations by Number of Employees
We visualized the top U.S. companies by employees, revealing the massive scale of retailers like Walmart, Target, and Home Depot.
-

 Markets2 weeks ago
The Top 10 States by Real GDP Growth in 2023
This graphic shows the states with the highest real GDP growth rate in 2023, largely propelled by the oil and gas boom.
-

 Markets2 weeks ago
Ranked: The World’s Top Flight Routes, by Revenue
In this graphic, we show the highest earning flight routes globally as air travel continued to rebound in 2023.
-

 Markets2 weeks ago
Ranked: The Most Valuable Housing Markets in America
The U.S. residential real estate market is worth a staggering $47.5 trillion. Here are the most valuable housing markets in the country.


-

 Education1 week ago
How Hard Is It to Get Into an Ivy League School?
-

 Technology2 weeks ago
Ranked: Semiconductor Companies by Industry Revenue Share
-
Markets2 weeks ago
Ranked: The World’s Top Flight Routes, by Revenue
-

 Demographics2 weeks ago
Population Projections: The World’s 6 Largest Countries in 2075
-
Markets2 weeks ago
The Top 10 States by Real GDP Growth in 2023
-

 Demographics2 weeks ago
The Smallest Gender Wage Gaps in OECD Countries
-

 Economy2 weeks ago
Where U.S. Inflation Hit the Hardest in March 2024
-

 Environment2 weeks ago
Top Countries By Forest Growth Since 2001