Markets
Why It’s Time for Banks to Make Bold Late-Cycle Moves
View the full report from McKinsey & Company here

Why It’s Time for Banks to Make Bold Late-Cycle Moves
An economic downturn is approaching on the horizon. Amid low interest rates and a manufacturing slowdown, industries and investors alike are scrambling to prepare as the window of opportunity closes.
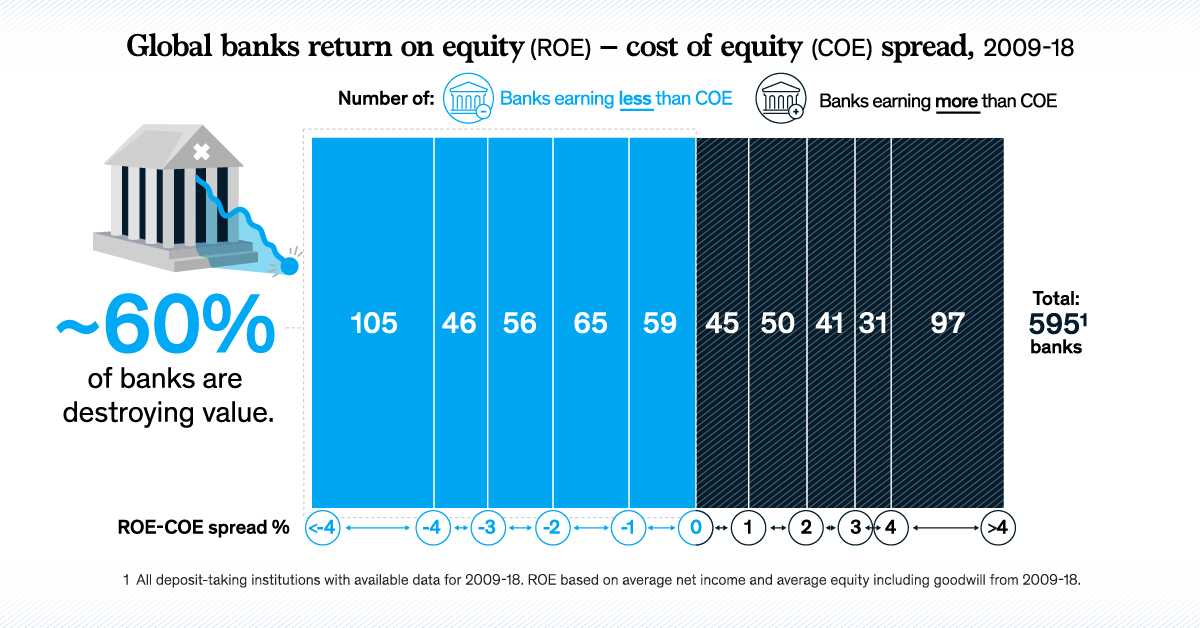
Banking is no different. After a decade of expansion, the industry is showing many signs of a late-cycle economy. On top of this, a staggering 60% of banks are destroying value. Today’s infographic from McKinsey & Company explores the steps banks can immediately take to succeed in the next economic cycle.
How is Value Created?
In the banking sector, three main factors contribute to value creation:
- The location of the bank
- The scale of its operations
- The effectiveness of its business model
Given that geographic reach is mostly out of a bank’s control, and scale takes time to build, banks must focus on their business model.
There are three universal business model levers that all banks can immediately act on to change their destiny.
1. Risk Management
Banks can protect returns in an economic downturn by managing risk. For example, new machine-learning models can predict the riskiest customers with 35 percentage points more accuracy than traditional models.
2. Productivity
To radically reduce costs, banks can transfer non-differentiating activities to third-party “utilities”, through outsourcing, carve-outs, or partnerships. This has the potential to increase return on equity by as much as 100 basis points.
3. Revenue Growth
When customers are satisfied, they generate more value for banks—and vice versa. For instance, customers who report low satisfaction with their mortgage experience are almost seven times more likely to refinance with a different bank.
By materially improving decisive points in the customer experience, banks can increase revenue and reduce churn rates within 12-18 months.
The Four Banking Archetypes
Beyond these universal performance levers, a bank should prioritize late-cycle economic decisions based on the archetype it falls under.
- Market leaders are top-performing financial institutions in attractive markets
- Resilients are top-performing operators despite challenging market conditions
- Followers are mid-tier organizations generating returns due to favourable market conditions
- Challenged banks are poor performers in unattractive markets
Different archetypal levers are available depending on each bank’s unique circumstances.
- Ecosystem
Banks can find new revenue streams across and beyond banking, leveraging customer relationships and white-label partnerships. - Innovation
Banks can create value by developing new methods, ideas, products and services. To implement this effectively, banks must set goals for the return on innovation as well as the timeframe. - Zero-based budgeting
By justifying expenses for each new period, banks can drastically reduce costs. This involves starting from a “zero base” rather than prior years’ numbers.
Here’s how banks across the various archetypes can take action:
| Market Leaders | |||
| Resilients | |||
| Followers | |||
| Challenged |
For example, while market leaders’ large capital base is best used for ecosystem and innovation plays, challenged banks need to radically rethink their business model or merge with similar banks.
Reinvent, Scale, or Perish
As the late-cycle economy slows even further, no banks can afford complacency. In fact, history has shown that 35% of market leaders drop to the bottom half of peers in the next cycle.
Now is the time for banks to take bold action through universal and archetypal levers—or risk being left behind.
For a more detailed breakdown of the actions that banks can take in this market environment, check out the full report by McKinsey & Company.


Markets
U.S. Debt Interest Payments Reach $1 Trillion
U.S. debt interest payments have surged past the $1 trillion dollar mark, amid high interest rates and an ever-expanding debt burden.


U.S. Debt Interest Payments Reach $1 Trillion
This was originally posted on our Voronoi app. Download the app for free on iOS or Android and discover incredible data-driven charts from a variety of trusted sources.
The cost of paying for America’s national debt crossed the $1 trillion dollar mark in 2023, driven by high interest rates and a record $34 trillion mountain of debt.
Over the last decade, U.S. debt interest payments have more than doubled amid vast government spending during the pandemic crisis. As debt payments continue to soar, the Congressional Budget Office (CBO) reported that debt servicing costs surpassed defense spending for the first time ever this year.
This graphic shows the sharp rise in U.S. debt payments, based on data from the Federal Reserve.
A $1 Trillion Interest Bill, and Growing
Below, we show how U.S. debt interest payments have risen at a faster pace than at another time in modern history:
| Date | Interest Payments | U.S. National Debt |
|---|---|---|
| 2023 | $1.0T | $34.0T |
| 2022 | $830B | $31.4T |
| 2021 | $612B | $29.6T |
| 2020 | $518B | $27.7T |
| 2019 | $564B | $23.2T |
| 2018 | $571B | $22.0T |
| 2017 | $493B | $20.5T |
| 2016 | $460B | $20.0T |
| 2015 | $435B | $18.9T |
| 2014 | $442B | $18.1T |
| 2013 | $425B | $17.2T |
| 2012 | $417B | $16.4T |
| 2011 | $433B | $15.2T |
| 2010 | $400B | $14.0T |
| 2009 | $354B | $12.3T |
| 2008 | $380B | $10.7T |
| 2007 | $414B | $9.2T |
| 2006 | $387B | $8.7T |
| 2005 | $355B | $8.2T |
| 2004 | $318B | $7.6T |
| 2003 | $294B | $7.0T |
| 2002 | $298B | $6.4T |
| 2001 | $318B | $5.9T |
| 2000 | $353B | $5.7T |
| 1999 | $353B | $5.8T |
| 1998 | $360B | $5.6T |
| 1997 | $368B | $5.5T |
| 1996 | $362B | $5.3T |
| 1995 | $357B | $5.0T |
| 1994 | $334B | $4.8T |
| 1993 | $311B | $4.5T |
| 1992 | $306B | $4.2T |
| 1991 | $308B | $3.8T |
| 1990 | $298B | $3.4T |
| 1989 | $275B | $3.0T |
| 1988 | $254B | $2.7T |
| 1987 | $240B | $2.4T |
| 1986 | $225B | $2.2T |
| 1985 | $219B | $1.9T |
| 1984 | $205B | $1.7T |
| 1983 | $176B | $1.4T |
| 1982 | $157B | $1.2T |
| 1981 | $142B | $1.0T |
| 1980 | $113B | $930.2B |
| 1979 | $96B | $845.1B |
| 1978 | $84B | $789.2B |
| 1977 | $69B | $718.9B |
| 1976 | $61B | $653.5B |
| 1975 | $55B | $576.6B |
| 1974 | $50B | $492.7B |
| 1973 | $45B | $469.1B |
| 1972 | $39B | $448.5B |
| 1971 | $36B | $424.1B |
| 1970 | $35B | $389.2B |
| 1969 | $30B | $368.2B |
| 1968 | $25B | $358.0B |
| 1967 | $23B | $344.7B |
| 1966 | $21B | $329.3B |
Interest payments represent seasonally adjusted annual rate at the end of Q4.
At current rates, the U.S. national debt is growing by a remarkable $1 trillion about every 100 days, equal to roughly $3.6 trillion per year.
As the national debt has ballooned, debt payments even exceeded Medicaid outlays in 2023—one of the government’s largest expenditures. On average, the U.S. spent more than $2 billion per day on interest costs last year. Going further, the U.S. government is projected to spend a historic $12.4 trillion on interest payments over the next decade, averaging about $37,100 per American.
Exacerbating matters is that the U.S. is running a steep deficit, which stood at $1.1 trillion for the first six months of fiscal 2024. This has accelerated due to the 43% increase in debt servicing costs along with a $31 billion dollar increase in defense spending from a year earlier. Additionally, a $30 billion increase in funding for the Federal Deposit Insurance Corporation in light of the regional banking crisis last year was a major contributor to the deficit increase.
Overall, the CBO forecasts that roughly 75% of the federal deficit’s increase will be due to interest costs by 2034.

-

 Real Estate2 weeks ago
Visualizing America’s Shortage of Affordable Homes
-

 Technology1 week ago
Ranked: Semiconductor Companies by Industry Revenue Share
-

 Money1 week ago
Which States Have the Highest Minimum Wage in America?
-

 Real Estate1 week ago
Ranked: The Most Valuable Housing Markets in America
-

 Business2 weeks ago
Charted: Big Four Market Share by S&P 500 Audits
-

 AI2 weeks ago
The Stock Performance of U.S. Chipmakers So Far in 2024
-

 Misc2 weeks ago
Almost Every EV Stock is Down After Q1 2024
-

 Money2 weeks ago
Where Does One U.S. Tax Dollar Go?