

This graphic highlights France and Canada as the global leaders when it comes to generating carbon tax revenue.
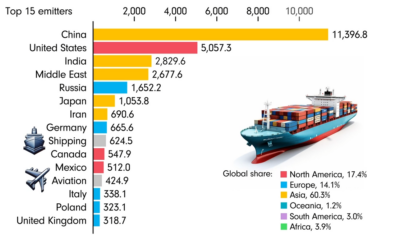

This animated chart by James Eagle uses data from Our World in Data to show the 15 largest carbon emitters between 1850 and 2022.


This graphic showcases electricity emissions by state, highlighting each state's largest source of power.
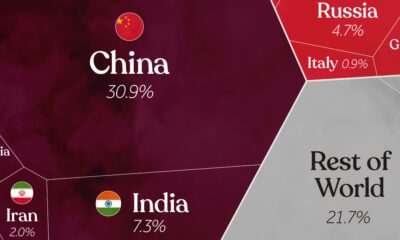

China, India, and the U.S. together account for roughly half of the world's CO₂. This visual breaks down all carbon emissions by country.


We look at carbon emissions of electric, hybrid, and combustion engine vehicles through an analysis of their life cycle emissions.


Discover how the average person's carbon footprint impacts the environment and learn how carbon credits can offset your carbon footprint.
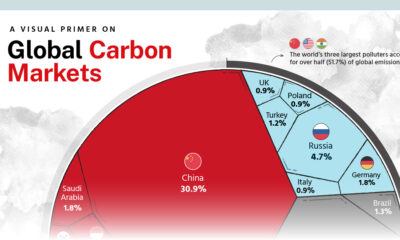

We highlight key findings from the Hinrich Foundation’s latest report on carbon markets, produced in partnership with Visual Capitalist.
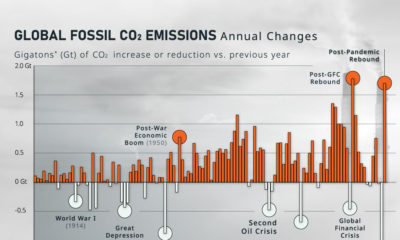

How much do global CO₂ emissions change on a year-to-year basis? Here, we show the annual rate of change in emissions since 1900.


More carbon in the atmosphere is creating a hotter world—and gradually fueling both climate change and instances of wildfires.
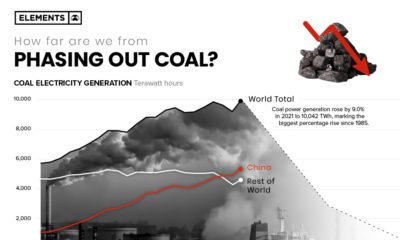

In 2021 coal-fired electricity generation reached all-time highs, rising 9% from the year prior. Here's what it'd take to phase it out of the energy mix.


 Creator Program