Misc
12 Different Ways to Organize the Periodic Table of Elements


The Periodic Tables You’ve Never Seen Before
The Periodic Table of Elements is an iconic image in classrooms and laboratories all around the world.
Yet despite having an almost unanimous agreement amongst scientists on its composition, there are over 1,000 different periodic tables—and that number continues to grow. This is because the standard table does not highlight all of the existing relationships between the elements.
With 118 elements currently known, there are many different interactions and stories to tell. Here are some of the most remarkable, fascinating and bizarre periodic tables that we could find.
Purpose and Properties of the Periodic Table
To understand why there are so many periodic tables, we first need to understand exactly what a periodic table is. “Periodic” tables get their name because they organize the chemical elements by periodicity (or recurring periodic patterns).
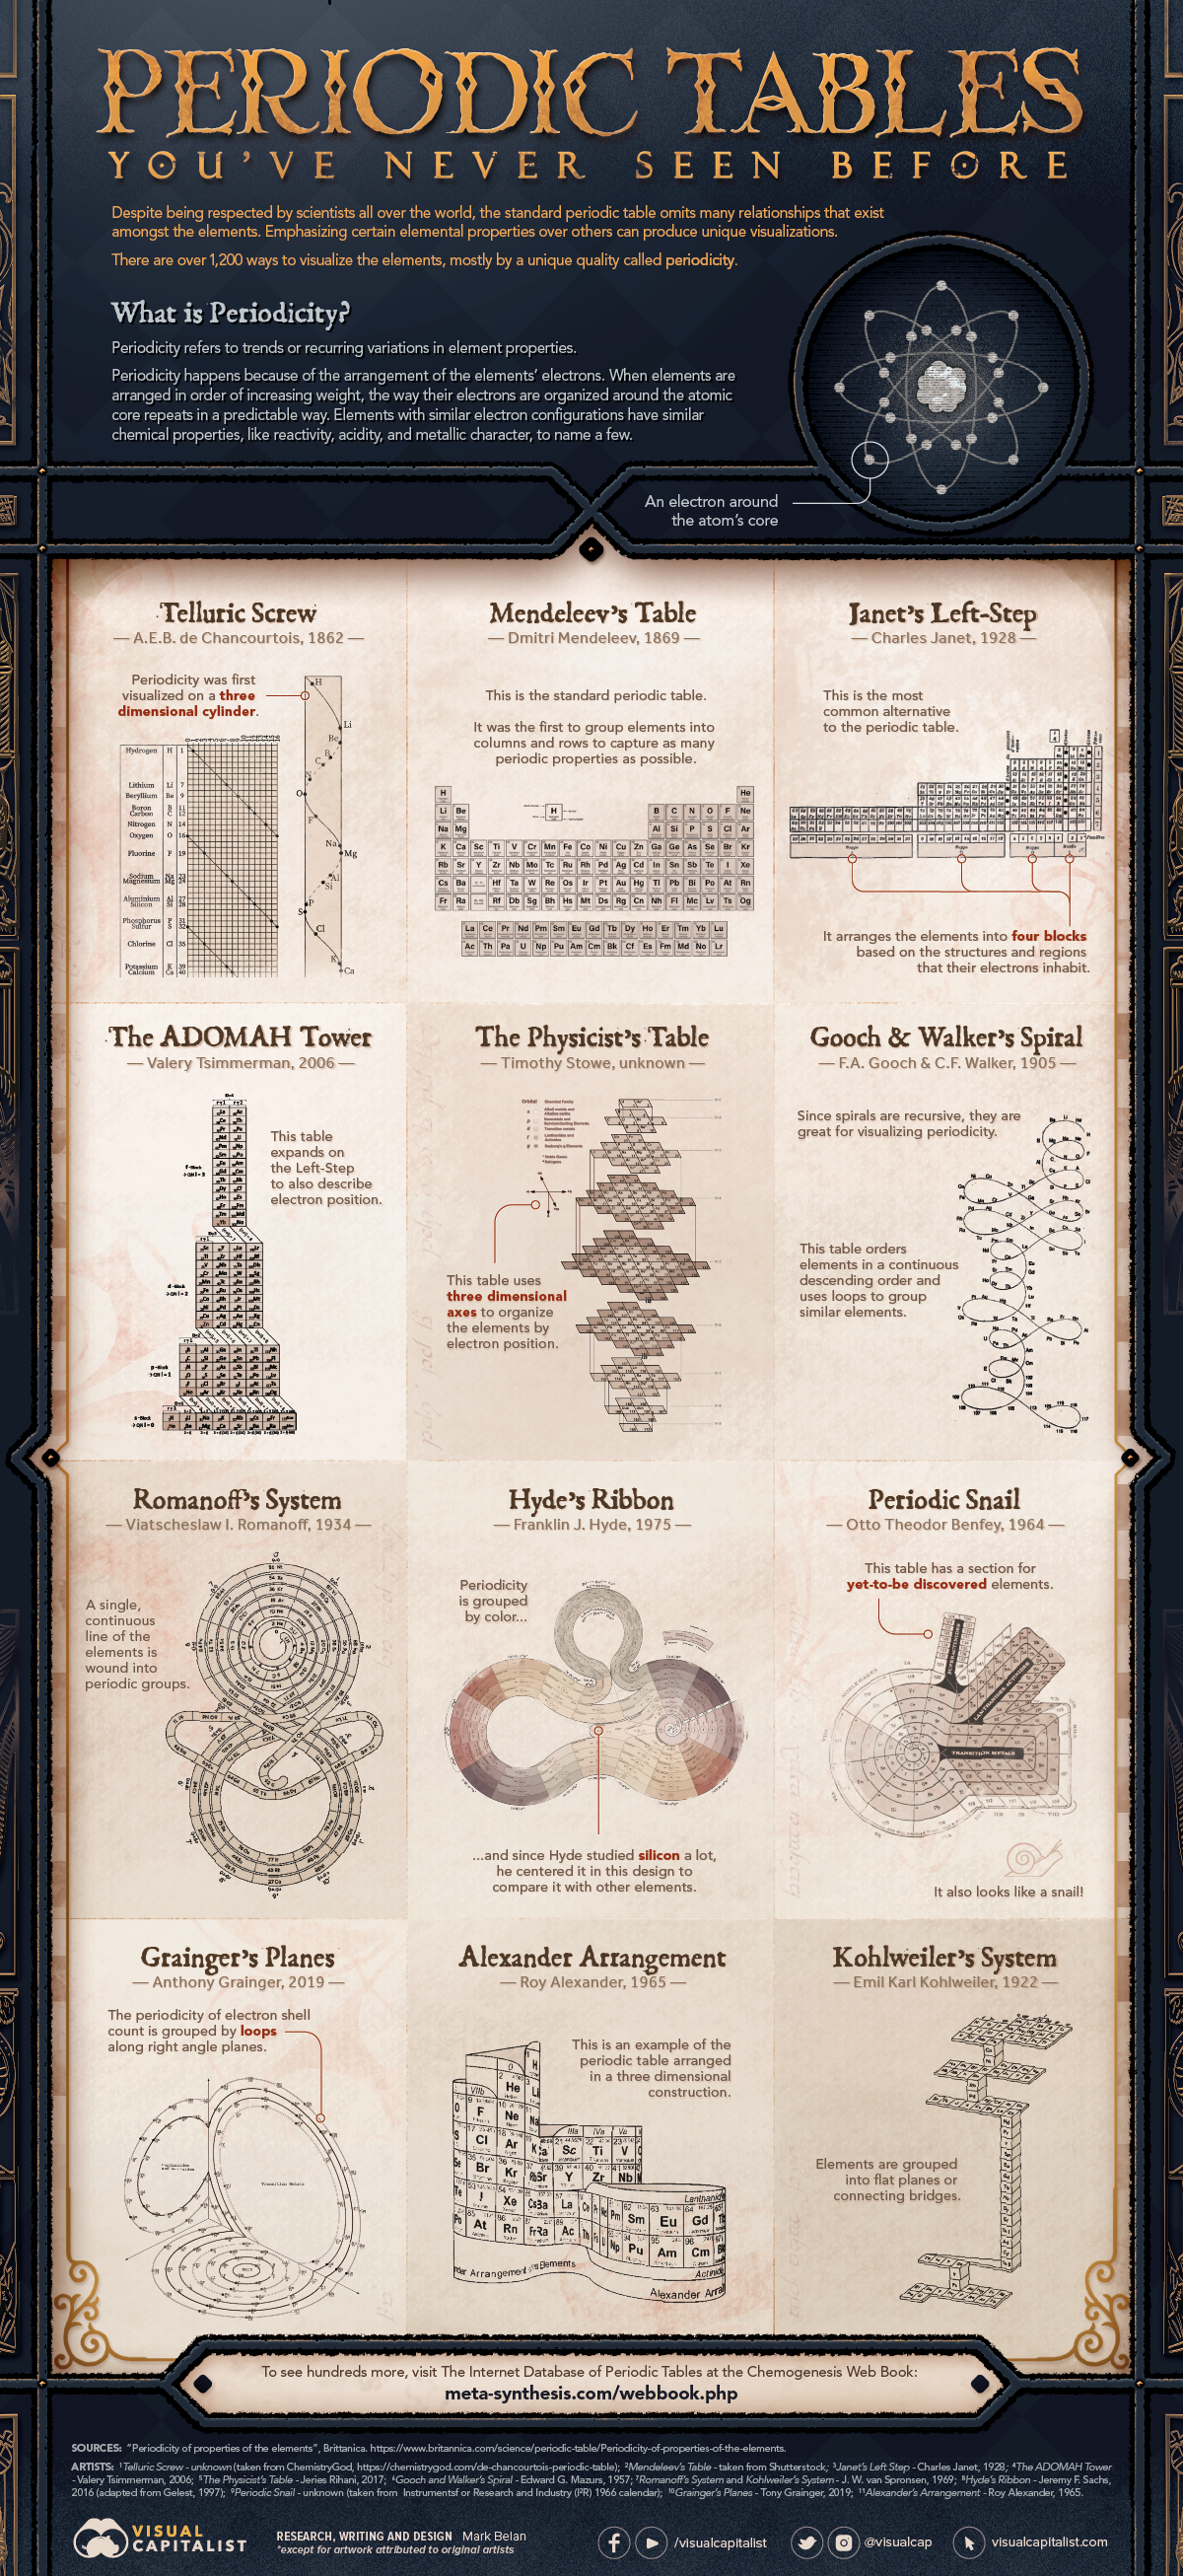
When the elements are organized by their relatively stable number of protons, for example, we get the standard periodic table of elements first devised by Russian chemist Dmitri Mendeleev in the year 1869.
Compared to protons, electrons are very mobile. The way electrons are configured around a nucleus—and how they behave with the electrons of other elements—gives them specific chemical properties.
These properties are similar amongst some elements and repeat periodically. The standard periodic table of elements visualizes this by arranging elements based on these shared chemical properties, providing a guide for understanding similar electron configurations at a glance.
Examining Different Periodic Tables
Below are just a few of the most interesting and unique periodic table permutations not commonly used.
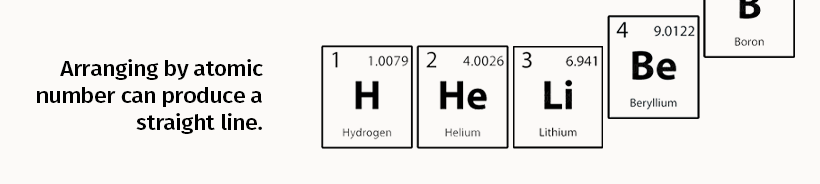
Charles Janet’s “left-step” periodic table is the most popular alternative table. It organizes the elements by the way that electrons fill orbitals (the regions they whir in) rather than valence (an electron’s ability to bond).
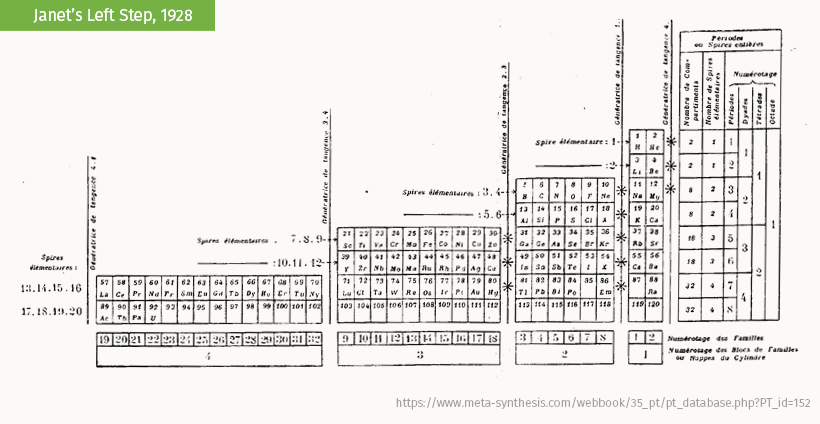
The ADOMAH table by Valery Tsimmerman is a form of the left-step table that groups elements by their principal quantum number.
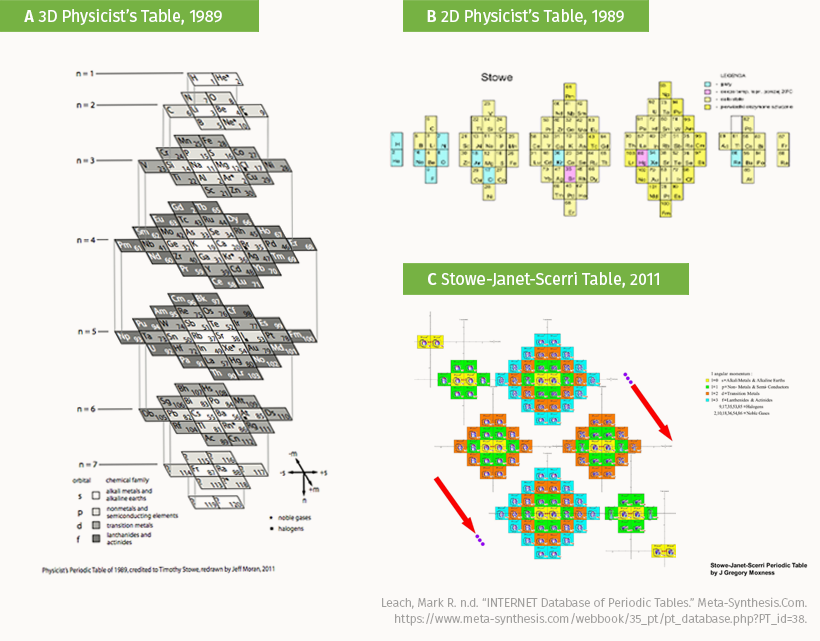
The Physicist’s Periodic Table of Elements by Timothy Stowe rearranges the standard table into both 3D-vertical (A) and 2D-horizontal (B) layouts. When merged with the work of Charles Janet and Eric Scerri (C) the result is a unique map of chemical groups.
Many researchers and scholars also continue to come up with new ways to show the basics of chemical periodicity.
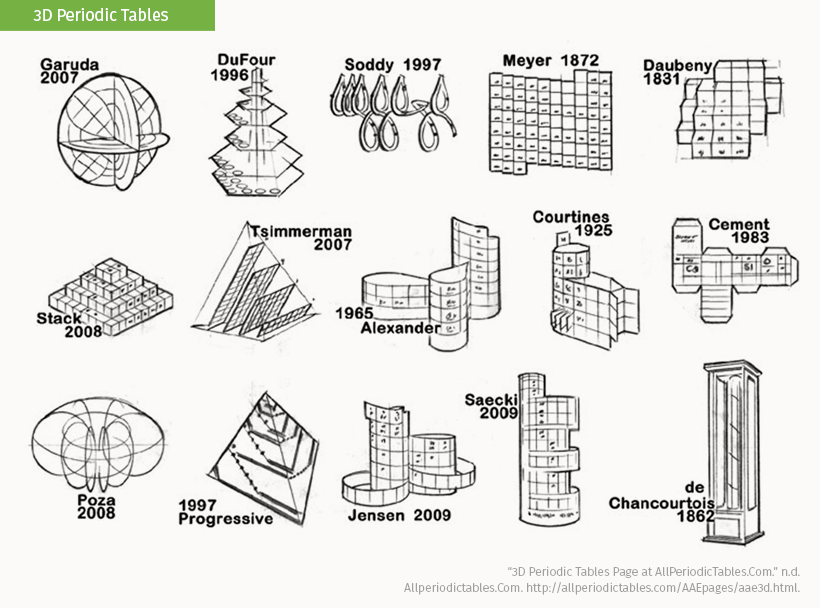
One method is in three-dimensional interpretations of periodicity. Here’s a collection of some of the most well-known designs and their creators, including the Telluric Screw and the Alexander Arrangement from the main graphic above.
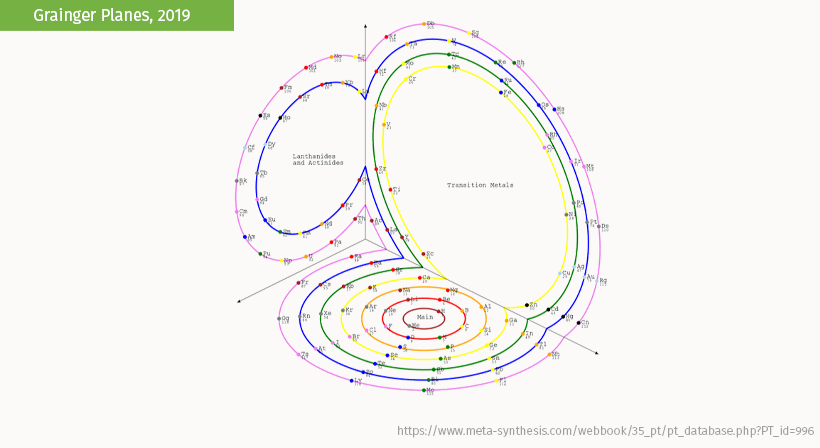
This representation by Anthony Grainger imagines all periods aligning along orthogonal (right-angle) planes cutting a sphere.
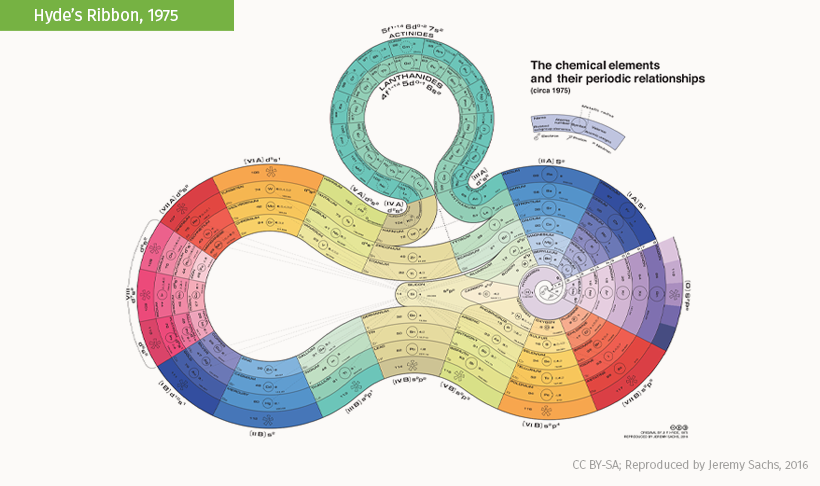
This eye-catching arrangement by Franklin J. Hyde winds a linear count of the elements while putting silicon at center stage.
Not all periodic tables show periodicity like the standard periodic table. Depending on the message, the chemical elements can take on various unique and exciting ways to tell a different kind of story.
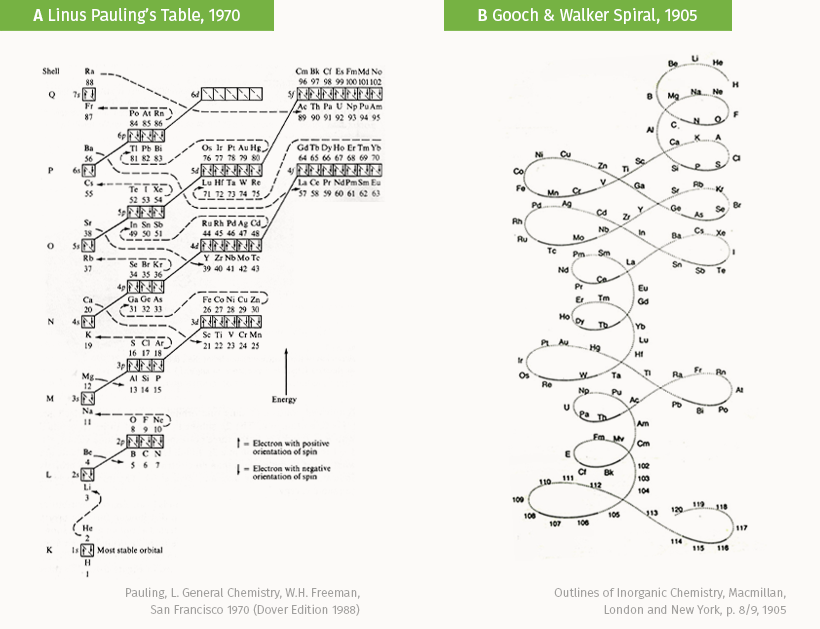
This flowchart from Linus Pauling’s “General Chemistry” (A) organizes elements by the energy levels of their electron shells and subshells. On the other hand, Gooch & Walker’s Spiral (B) is a figure-8 representation that is almost entirely devoid of most atomic information common to other periodic tables.
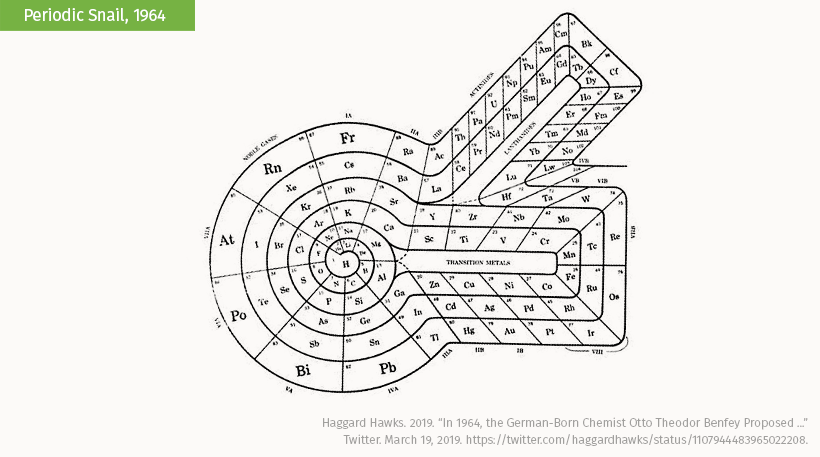
The spiral periodic table known as the Periodic Snail by Theodor Benfey swirls outwards by atomic number before branching into additional groups. The unique aspect of this table is that it reserves space for a hypothesized family of elements, the superactinides, and how they might correlate with the rest of the elements.
These are just a few of the hundreds and thousands of different ways to examine the elements.
As contemporary research continues to break new ground in our understanding of the elements, the opportunities to see the periodic table take on more new forms are shaping an exciting future for chemistry lovers and and data visualizers alike.
For more variations and designs of the periodic table, please visit Dr. Mark R. Leach’s online database at The Chemogenesis Web Book.


Misc
Visualizing the Most Common Pets in the U.S.
Lions, tigers, and bears, oh my!—these animals do not feature on this list of popular American household pets.


Visualizing The Most Common Pets in the U.S.
This was originally posted on our Voronoi app. Download the app for free on iOS or Android and discover incredible data-driven charts from a variety of trusted sources.
In this graphic, we visualized the most common American household pets, based on 2023-2024 data from the American Pet Products Association (accessed via Forbes Advisor).
Figures represent the number of households that own each pet type, rather than the actual number of each animal. The “small animal” category includes hamsters, gerbils, rabbits, guinea pigs, chinchillas, mice, rats, and ferrets.
What is the Most Popular American Household Pet?
Based on this data, dogs—one of the first domesticated animals—are the most common pets in the United States. In fact, around 65 million households own a dog, and spend an average of $900 a year on their care.
| Rank | Species | Households |
|---|---|---|
| 1 | 🐶 Dog | 65M |
| 2 | 🐱 Cat | 47M |
| 3 | 🐟 Freshwater Fish | 11M |
| 4 | 🐰 Small Animals | 7M |
| 5 | 🐦 Bird | 6M |
| 6 | 🦎 Reptile | 6M |
| 7 | 🐴 Horse | 2M |
| 8 | 🐠 Saltwater Fish | 2M |
Note: Households can own multiple pets, and are counted for all relevant categories.
Cats rank second, at 47 million households, and these smaller felines are a little less expensive to own at $700/year according to Forbes estimates.
But aside from these two juggernauts, there are plenty of other common pet types found in households across the country.
Freshwater fish can be found in 11 million households, along with small animals—rabbits, hamsters, guinea pigs—in 7 million. Meanwhile, nearly 6 million homes have birds or reptiles.
Pet Ownership is on the Rise in America
Forbes found that 66% of all American households (numbering 87 million) own at least one pet, up from 56% in 1988. One third of these (29 million) own multiple pets.
A combination of factors is driving this increase: rising incomes, delayed childbirth, and of course the impact of the pandemic which nearly cleared out animal shelters across the globe.
America’s loneliness epidemic may also be a factor. Fledgling research has shown that single-individual households with pets recorded lower rates of loneliness during the pandemic than those without a pet.

-

 Science1 week ago
Visualizing the Average Lifespans of Mammals
-

 Demographics2 weeks ago
The Smallest Gender Wage Gaps in OECD Countries
-

 United States2 weeks ago
Where U.S. Inflation Hit the Hardest in March 2024
-

 Green2 weeks ago
Top Countries By Forest Growth Since 2001
-

 United States2 weeks ago
Ranked: The Largest U.S. Corporations by Number of Employees
-

 Maps2 weeks ago
The Largest Earthquakes in the New York Area (1970-2024)
-

 Green2 weeks ago
Ranked: The Countries With the Most Air Pollution in 2023
-

 Green2 weeks ago
Ranking the Top 15 Countries by Carbon Tax Revenue