Misc
Visualizing the Origin of Elements
Visualizing the Origin of Elements
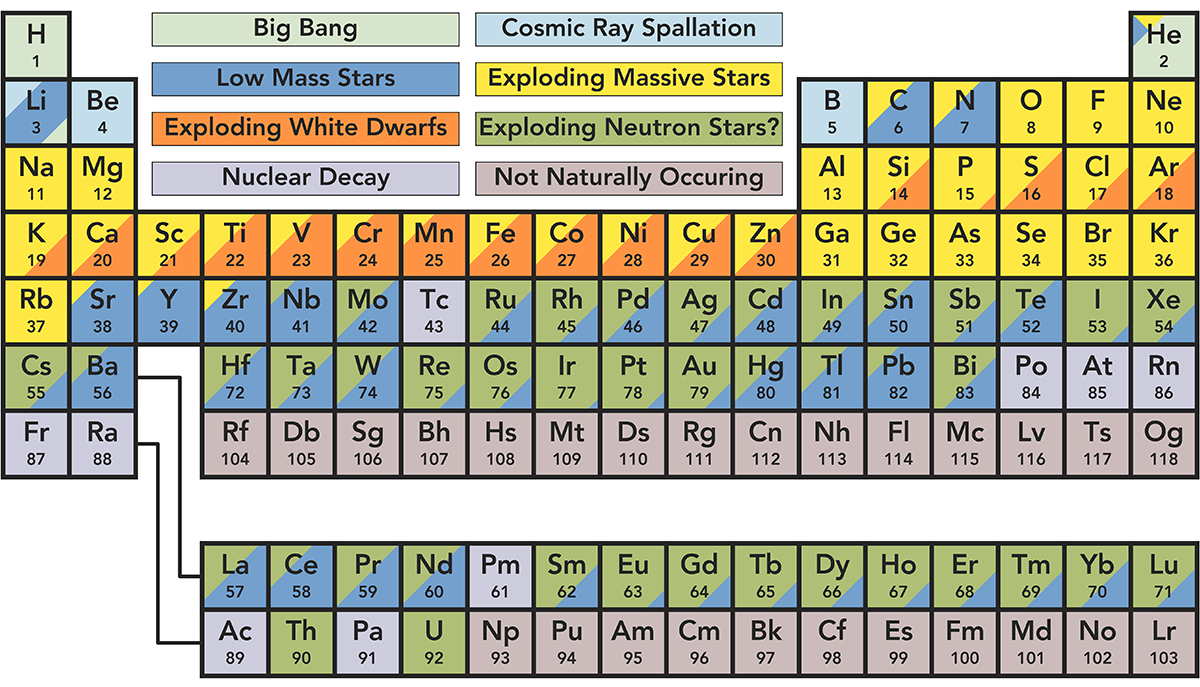
Most of us are familiar with the periodic table of elements from high school chemistry. We learned about atoms, and how elements combine to form chemical compounds. But perhaps a lesser-known aspect is where these elements actually come from.
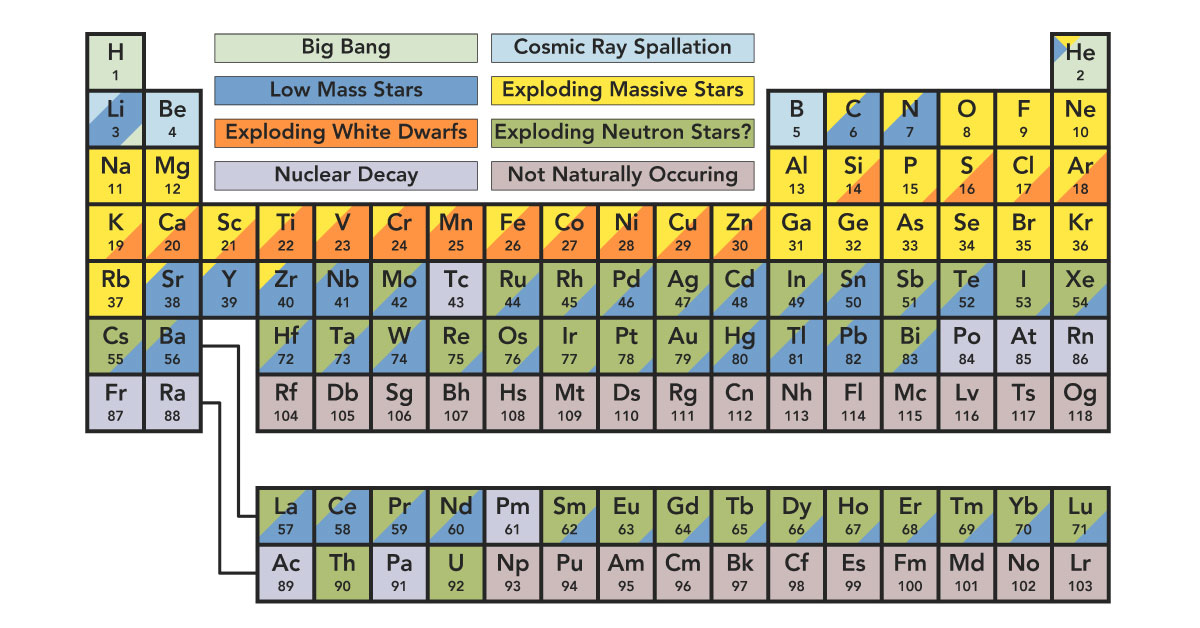
Today’s periodic table showing the origin of elements comes to us from Reddit user u/only_home, inspired by an earlier version created by astronomer Jennifer Johnson. It should be noted that elements with multiple sources are shaded proportionally to reflect the amount of said element produced from each source.
Let’s dive into the eight origin stories in more detail.
The Big Bang
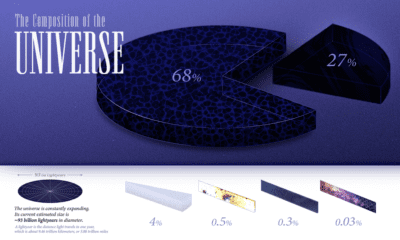
The universe began as a hot, dense region of radiant energy about 14 billion years ago. It cooled and expanded immediately after formation, creating the lightest and most plentiful elements: hydrogen and helium. This process also created trace amounts of lithium.
Low Mass Stars
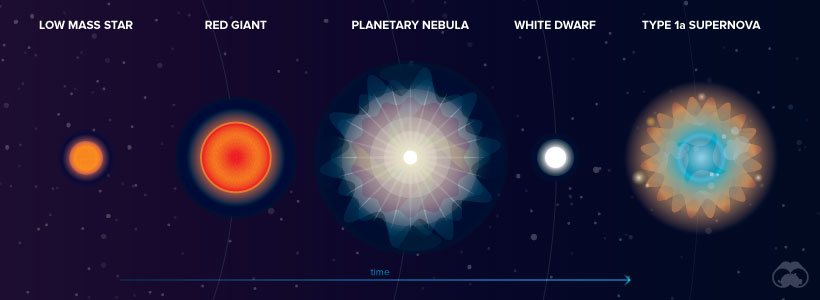
At the beginning of their lives, all stars create energy by fusing hydrogen atoms to form helium. Once the hydrogen is depleted, stars fuse helium into carbon and expand to become red giants.
From this point on, the journey of a low and a high mass star differs. Low mass stars reach a temperature of roughly one million kelvin and continue to heat up. Outer layers of helium and hydrogen expand around the carbon core until they can no longer be contained by gravity. These gas layers, known as a planetary nebula, are ejected into space. It is thought that a low mass star’s death creates many heavy elements such as lead.
Exploding White Dwarfs
In the wake of this planetary nebula expulsion, a carbon core known as a “white dwarf” remains with a temperature of about 100,000 kelvin. In many cases, a white dwarf will simply fade away.
Sometimes, however, white dwarfs gain enough mass from a nearby companion star to become unstable and explode in a Type 1a supernova. This explosion likely creates heavier elements such as iron, nickel, and manganese.
Exploding Massive Stars
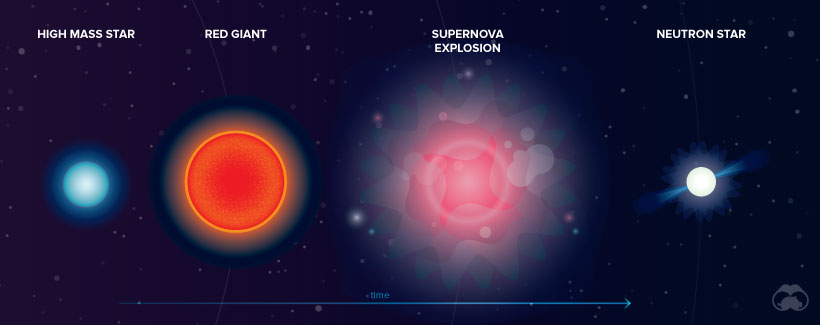
Massive stars evolve faster and generate much more heat. In addition to forming carbon, they also create layers of oxygen, nitrogen, and iron. When the core contains only iron, which is stable and compact, fusion ceases and gravitational collapse occurs. The star reaches a temperature of over several billion kelvin—resulting in a supernova explosion. Astronomers speculate that a variety of elements, including arsenic and rubidium, are formed during such explosions.
Exploding Neutron Stars
When a supernova occurs, the star’s core collapses, crushing protons and neutrons together into neutrons. If the mass of a collapsing star is low enough—about four to eight times that of the sun—a neutron star is formed. In 2017, it was discovered that when these dense neutron stars collide, they create heavier elements such as gold and platinum.
Cosmic Ray Spallation
The shockwaves from supernova explosions send cosmic rays, or high energy atoms/subatomic particles, flying through space. When these cosmic rays hit another atom at nearly the speed of light, they break apart and form a new element. The elements of lithium, beryllium, and boron are products of this process.
Nuclear Decay
Supernova explosions also create very heavy elements with unstable nuclei. Over time, these nuclei eject a neutron or proton, or a neutron decays into a proton and electron. This process is known as radioactive decay and often creates lighter, more stable elements such as radium and francium.
Not Naturally Occurring
There are currently 26 elements on the periodic table that are not naturally occurring; instead, these are all created synthetically in a laboratory using nuclear reactors and particle accelerators. For example, plutonium can be created when fast-moving neutrons collide with a common uranium isotope in a nuclear reactor.
Discoveries Yet to be Made
There is still some uncertainty as to where elements with a middle-range atomic number—neither heavy nor light—come from. As scientific breakthroughs emerge, we will continue to learn more about the elements that make up the mass of our solar system.


Politics
Charted: Trust in Government Institutions by G7 Countries
How much do you trust the government and its various institutions? We look at data for G7 countries for the time period of 2006-2023.


Trust in Government Institutions by G7 Countries
This was originally posted on our Voronoi app. Download the app for free on iOS or Android and discover incredible data-driven charts from a variety of trusted sources.
How much do you trust the government, and its various institutions?
It’s likely that your level of confidence probably depends on a wide range of factors, such as perceived competency, historical context, economic performance, accountability, social cohesion, and transparency.
And for these same reasons, trust levels in government institutions also change all the time, even in the world’s most developed countries: the G7.
Confidence in Government by G7 Countries (2006-2023)
This chart looks at the changes in trust in government institutions between the years 2006 and 2023, based on data from a multi-country Gallup poll.
Specifically, this dataset aggregates confidence in multiple national institutions, including the military, the judicial system, the national government, and the integrity of the electoral system.
| Country | Confidence (2006) | Confidence (2023) | Change (p.p.) |
|---|---|---|---|
| Canada | 57% | 64% | +7 |
| Britain | 63% | 63% | +0 |
| Germany | 55% | 61% | +6 |
| France | 54% | 60% | +6 |
| Japan | 48% | 59% | +11 |
| Italy | 41% | 54% | +13 |
| United States | 63% | 50% | -13 |
What’s interesting here is that in the G7, a group of the world’s most developed economies, there is only one country bucking the general trend: the United States.
Across most G7 countries, confidence in institutions has either improved or stayed the same between 2006 and 2023. The largest percentage point (p.p.) increases occur in Italy and Japan, which saw +13 p.p. and +11 p.p. increases in trust over the time period.
In the U.S., however, confidence in government institutions has fallen by 13 p.p. over the years. What happened?
Key Figures on U.S. Trust in Institutions
In 2006, the U.S. was tied with the UK as having the highest confidence in government institutions, at 63%.
But here’s where the scores stand in 2023, across various institutions:
| 🇺🇸 Institutions | Confidence (2023) |
|---|---|
| Military | 81% |
| Judiciary | 42% |
| National Government | 30% |
| Elections | 44% |
| Overall | 49% |
Based on this data, it’s clear that the U.S. lags behind in three key indicators: confidence in the national government, confidence in the justice system, and confidence in fair elections. It ranked in last place for each indicator in the G7.
One other data point that stands out: despite leading the world in military spending, the U.S. is only the third most confident in its military in the G7. It lags behind France (86%) and the United Kingdom (83%).

-

 Wealth6 days ago
Charted: Which City Has the Most Billionaires in 2024?
-

 Mining2 weeks ago
Gold vs. S&P 500: Which Has Grown More Over Five Years?
-

 Uranium2 weeks ago
The World’s Biggest Nuclear Energy Producers
-

 Education2 weeks ago
How Hard Is It to Get Into an Ivy League School?
-

 Debt2 weeks ago
How Debt-to-GDP Ratios Have Changed Since 2000
-

 Sports2 weeks ago
The Highest Earning Athletes in Seven Professional Sports
-

 Science2 weeks ago
Visualizing the Average Lifespans of Mammals
-

 Brands1 week ago
How Tech Logos Have Evolved Over Time